Weekly technical analysis and forecast (15–19 June 2026)
In this weekly technical analysis, we review key chart patterns and levels for EUSUSD, USDJPY, GBPUSD, AUDUSD, USDCAD, gold (XAUUSD), Brent oil, and bitcoin (BTCUSD) to forecast developments for the upcoming week (15–19 June 2026)
Major technical levels to watch this week
- EURUSD: Support: 1.1487, 1.1313. Resistance: 1.1555, 1.1666
- USDJPY: Support: 159.15, 156.69. Resistance: 160.86, 162.22
- GBPUSD: Support: 1.3232, 1.3094. Resistance: 1.3360, 1.3500
- AUDUSD: Support: 0.6828, 0.6745. Resistance: 0.7016, 0.7186
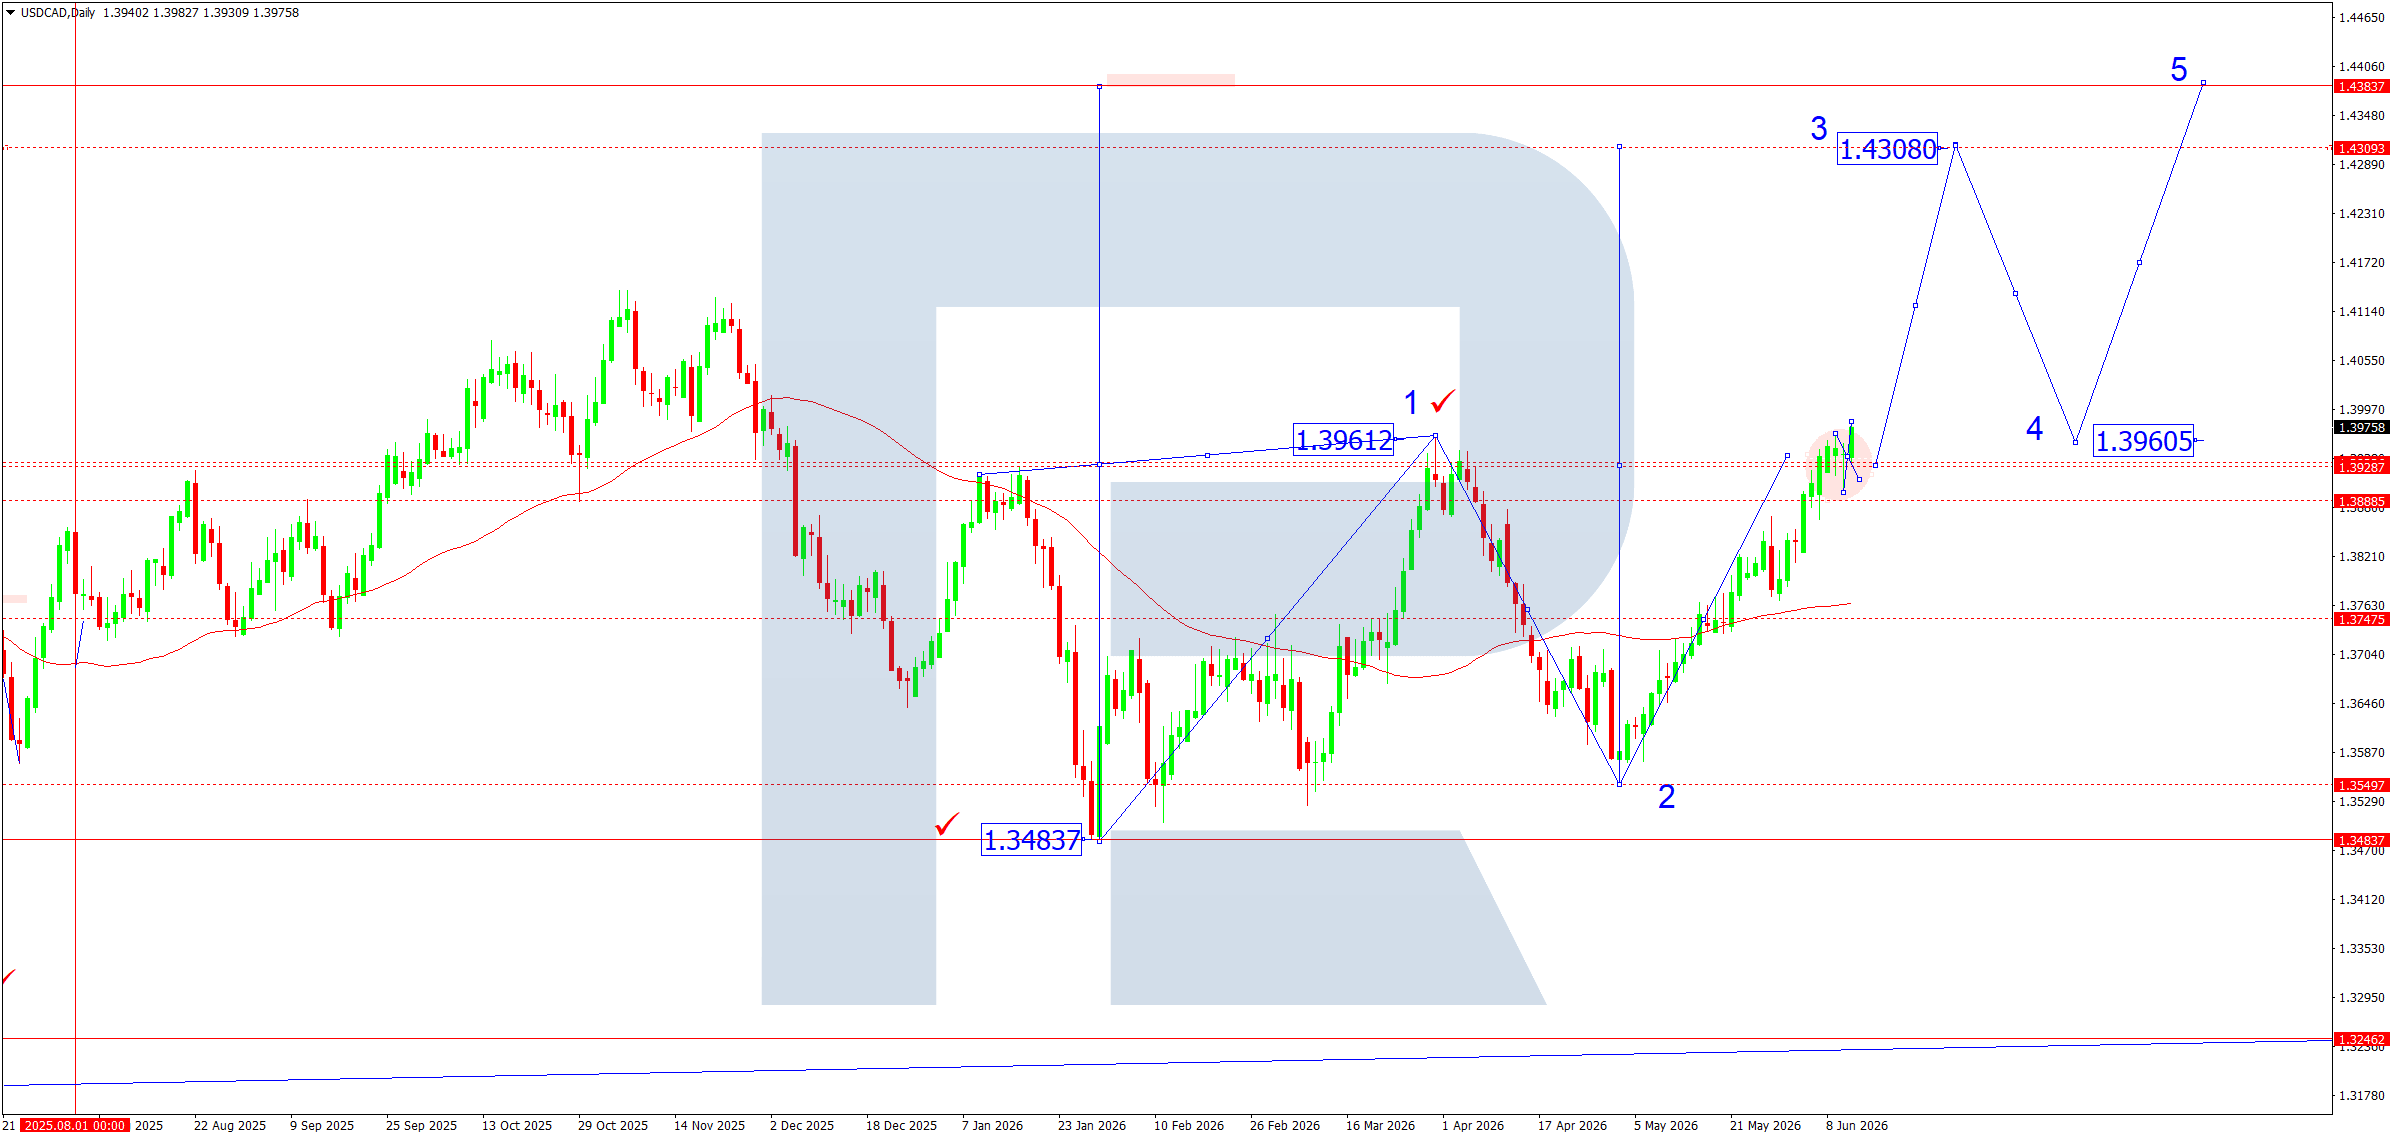
- USDCAD: Support: 1.3885, 1.3750. Resistance: 1.3961, 1.4300
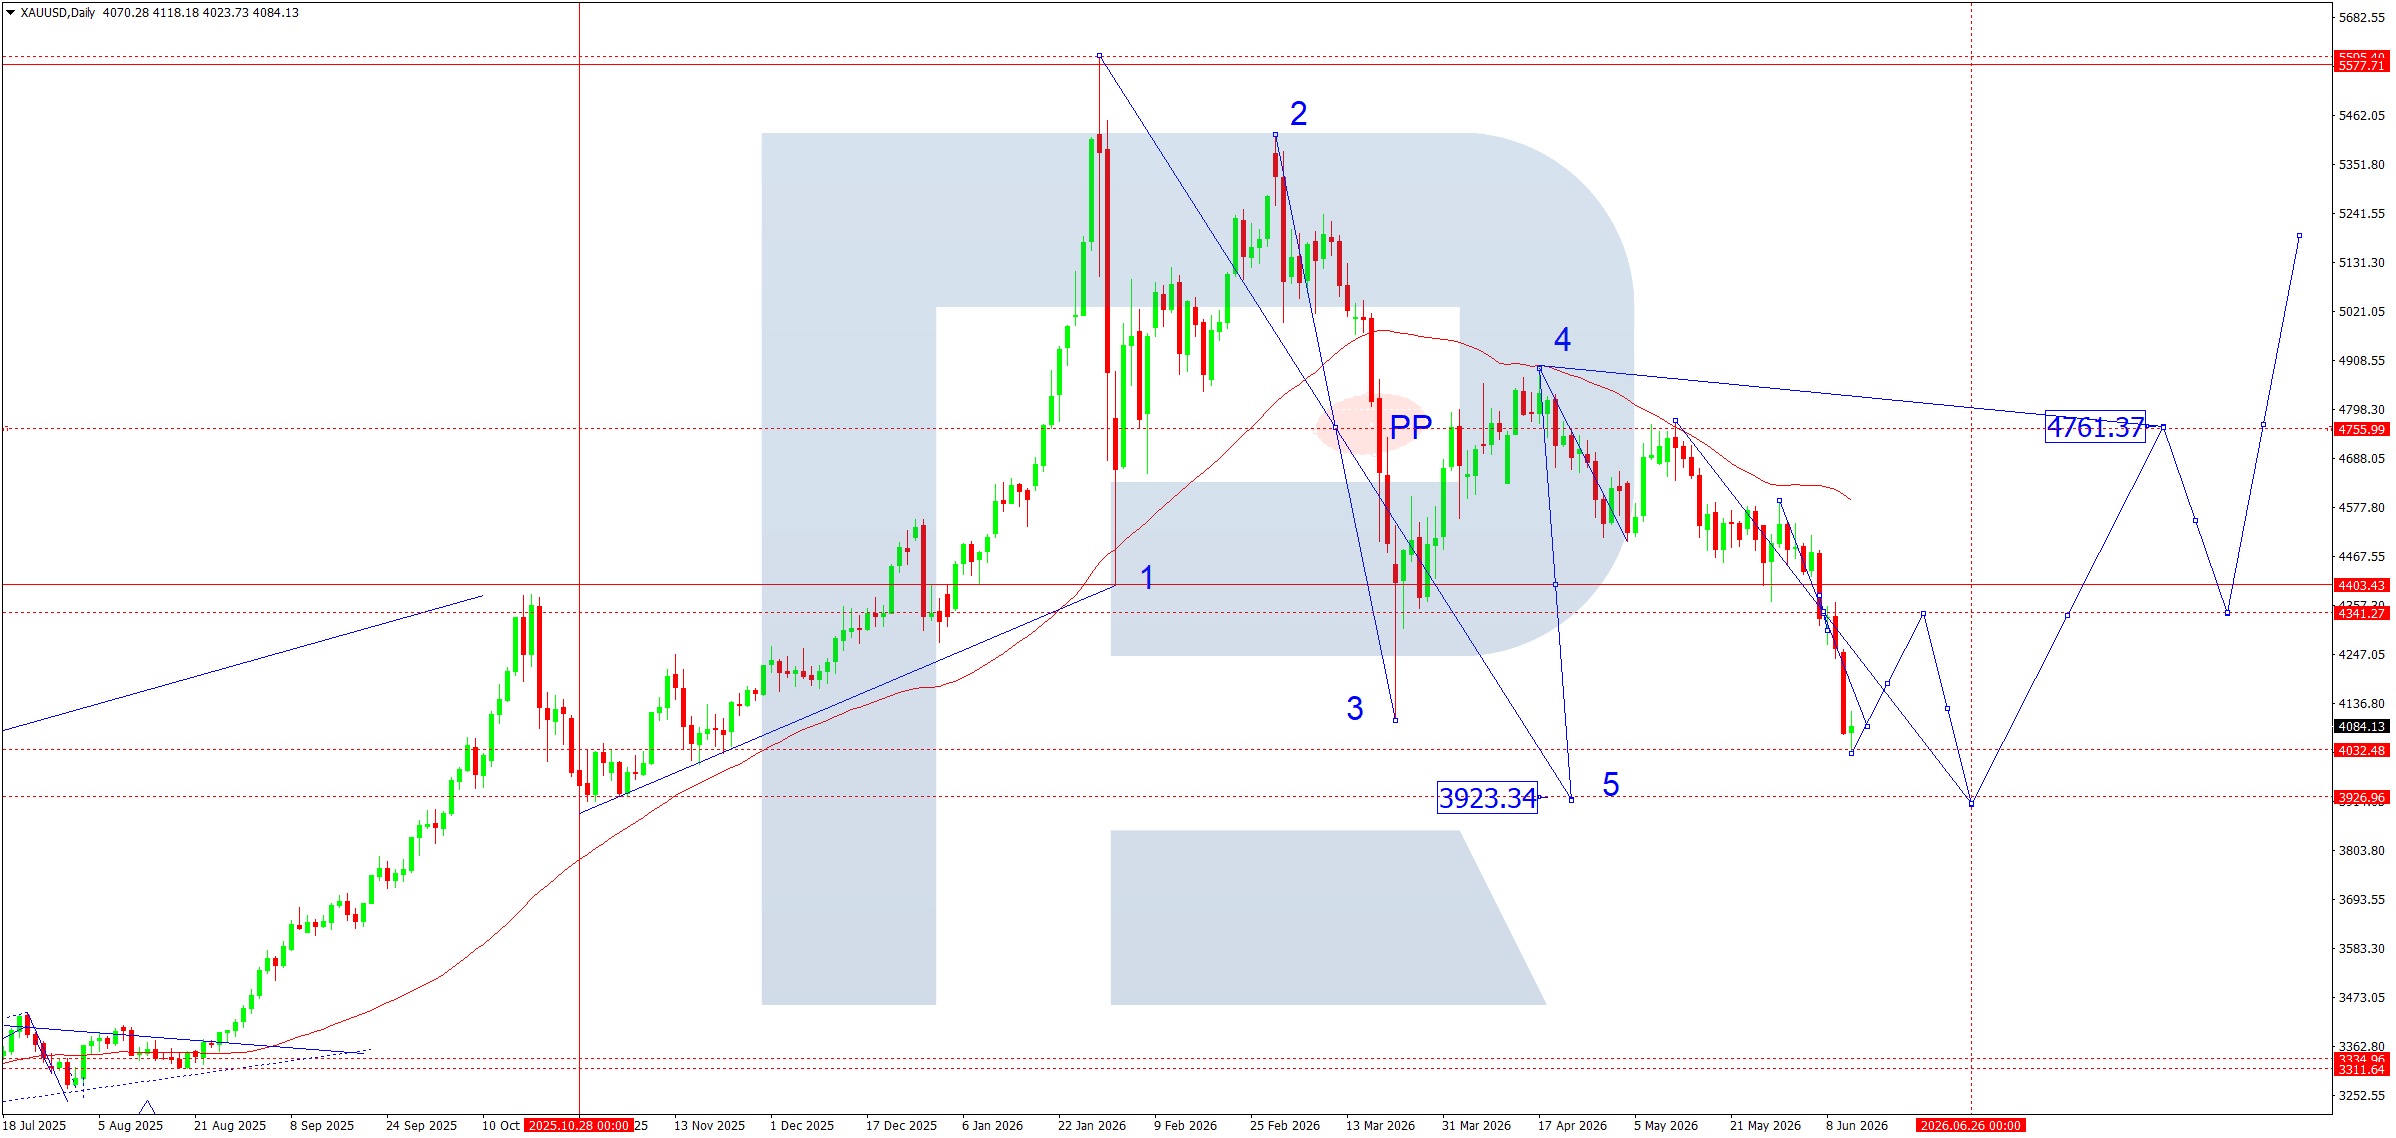
- Gold: Support: 4,032, 3,923. Resistance: 4,341, 4,761
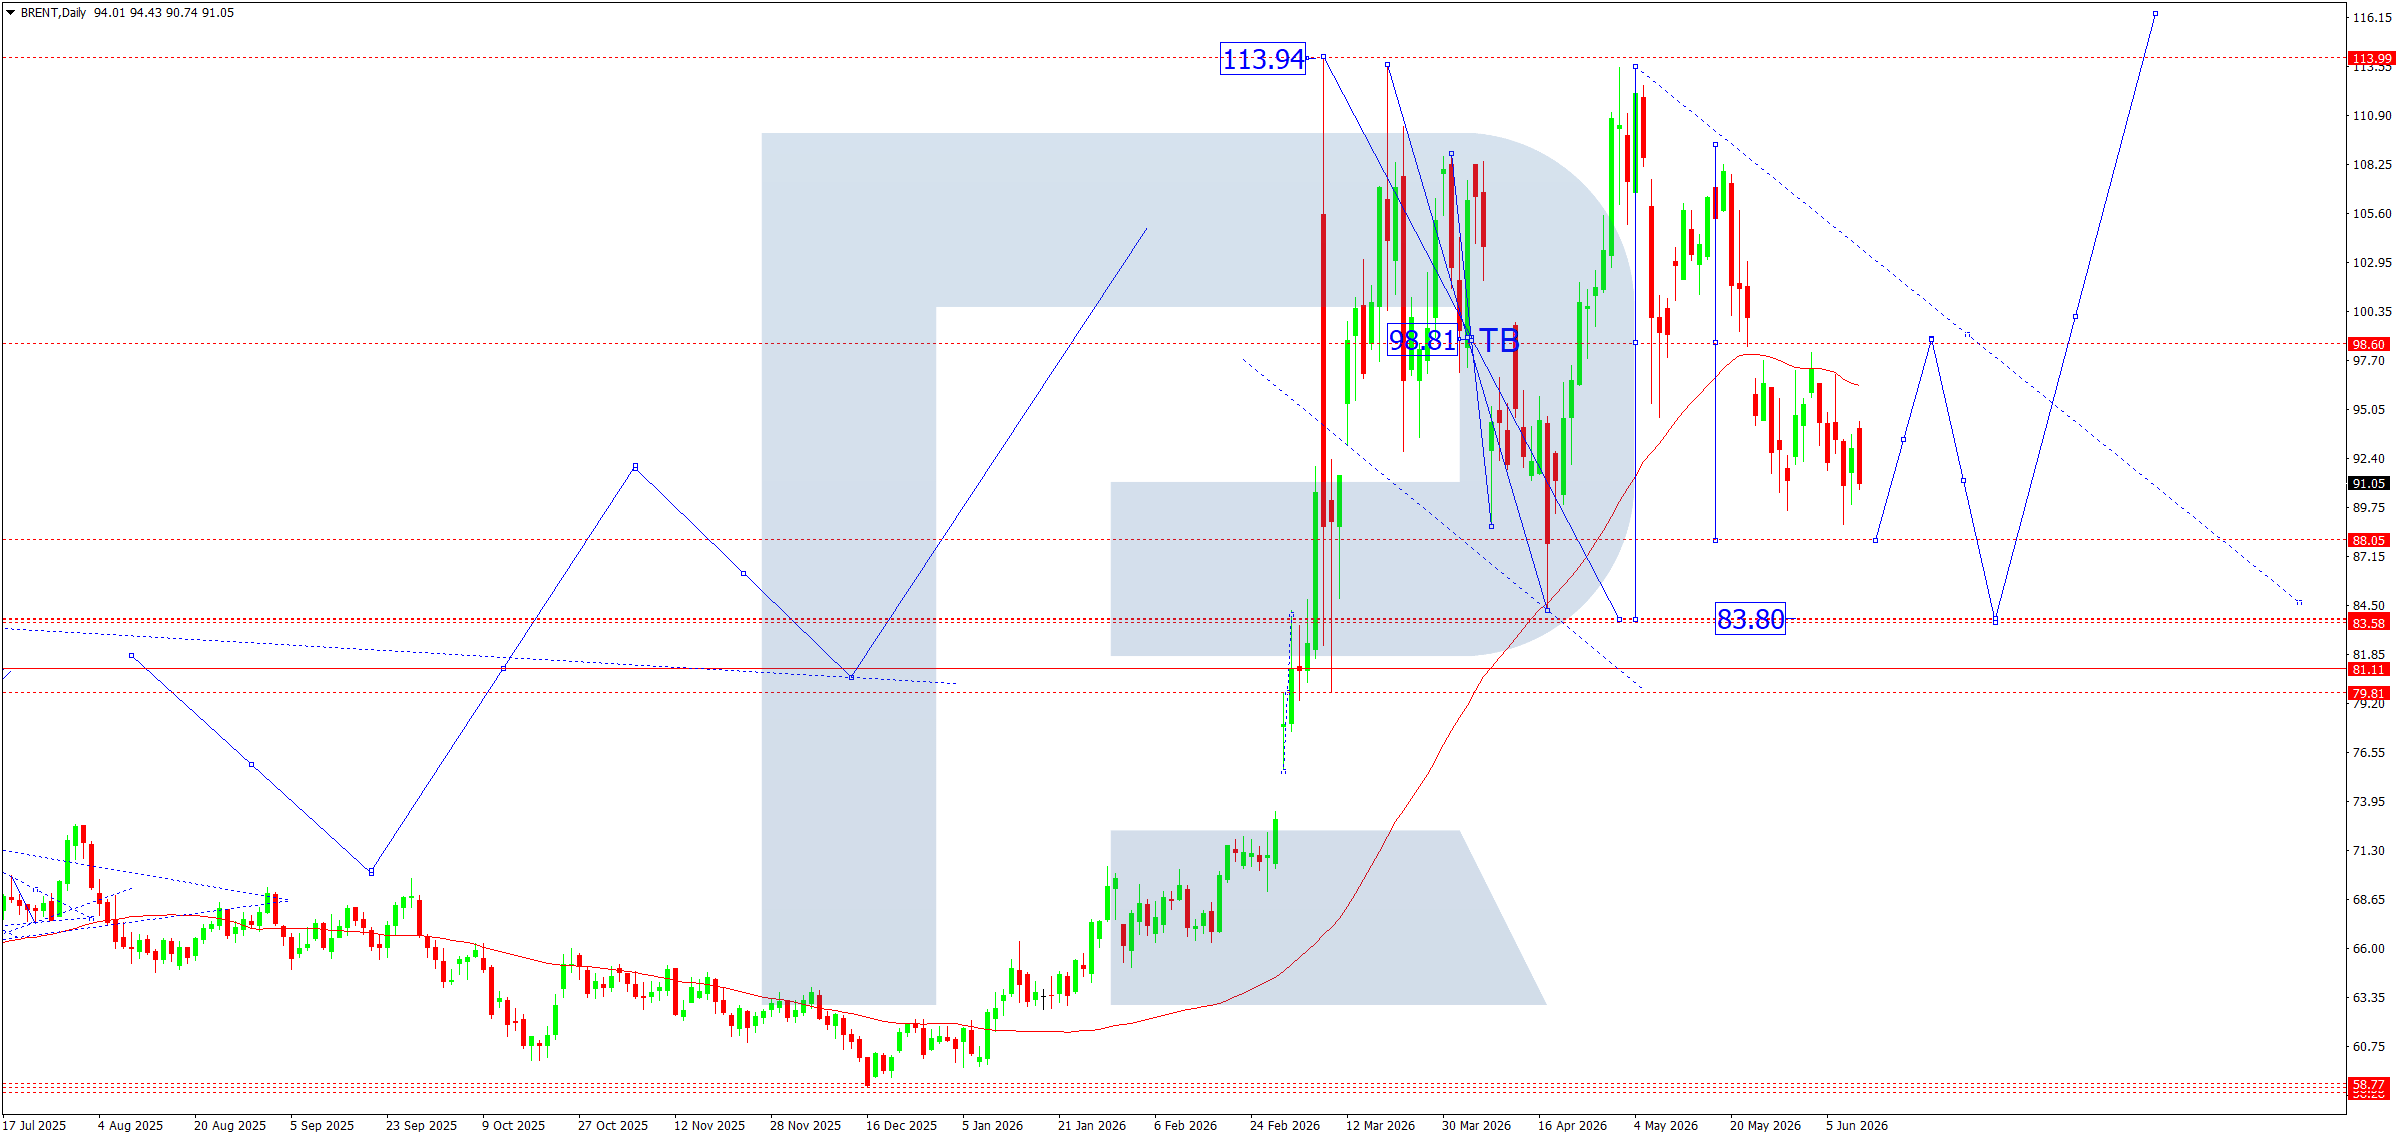
- Brent: Support: 88.05, 83.80. Resistance: 98.60, 113.94
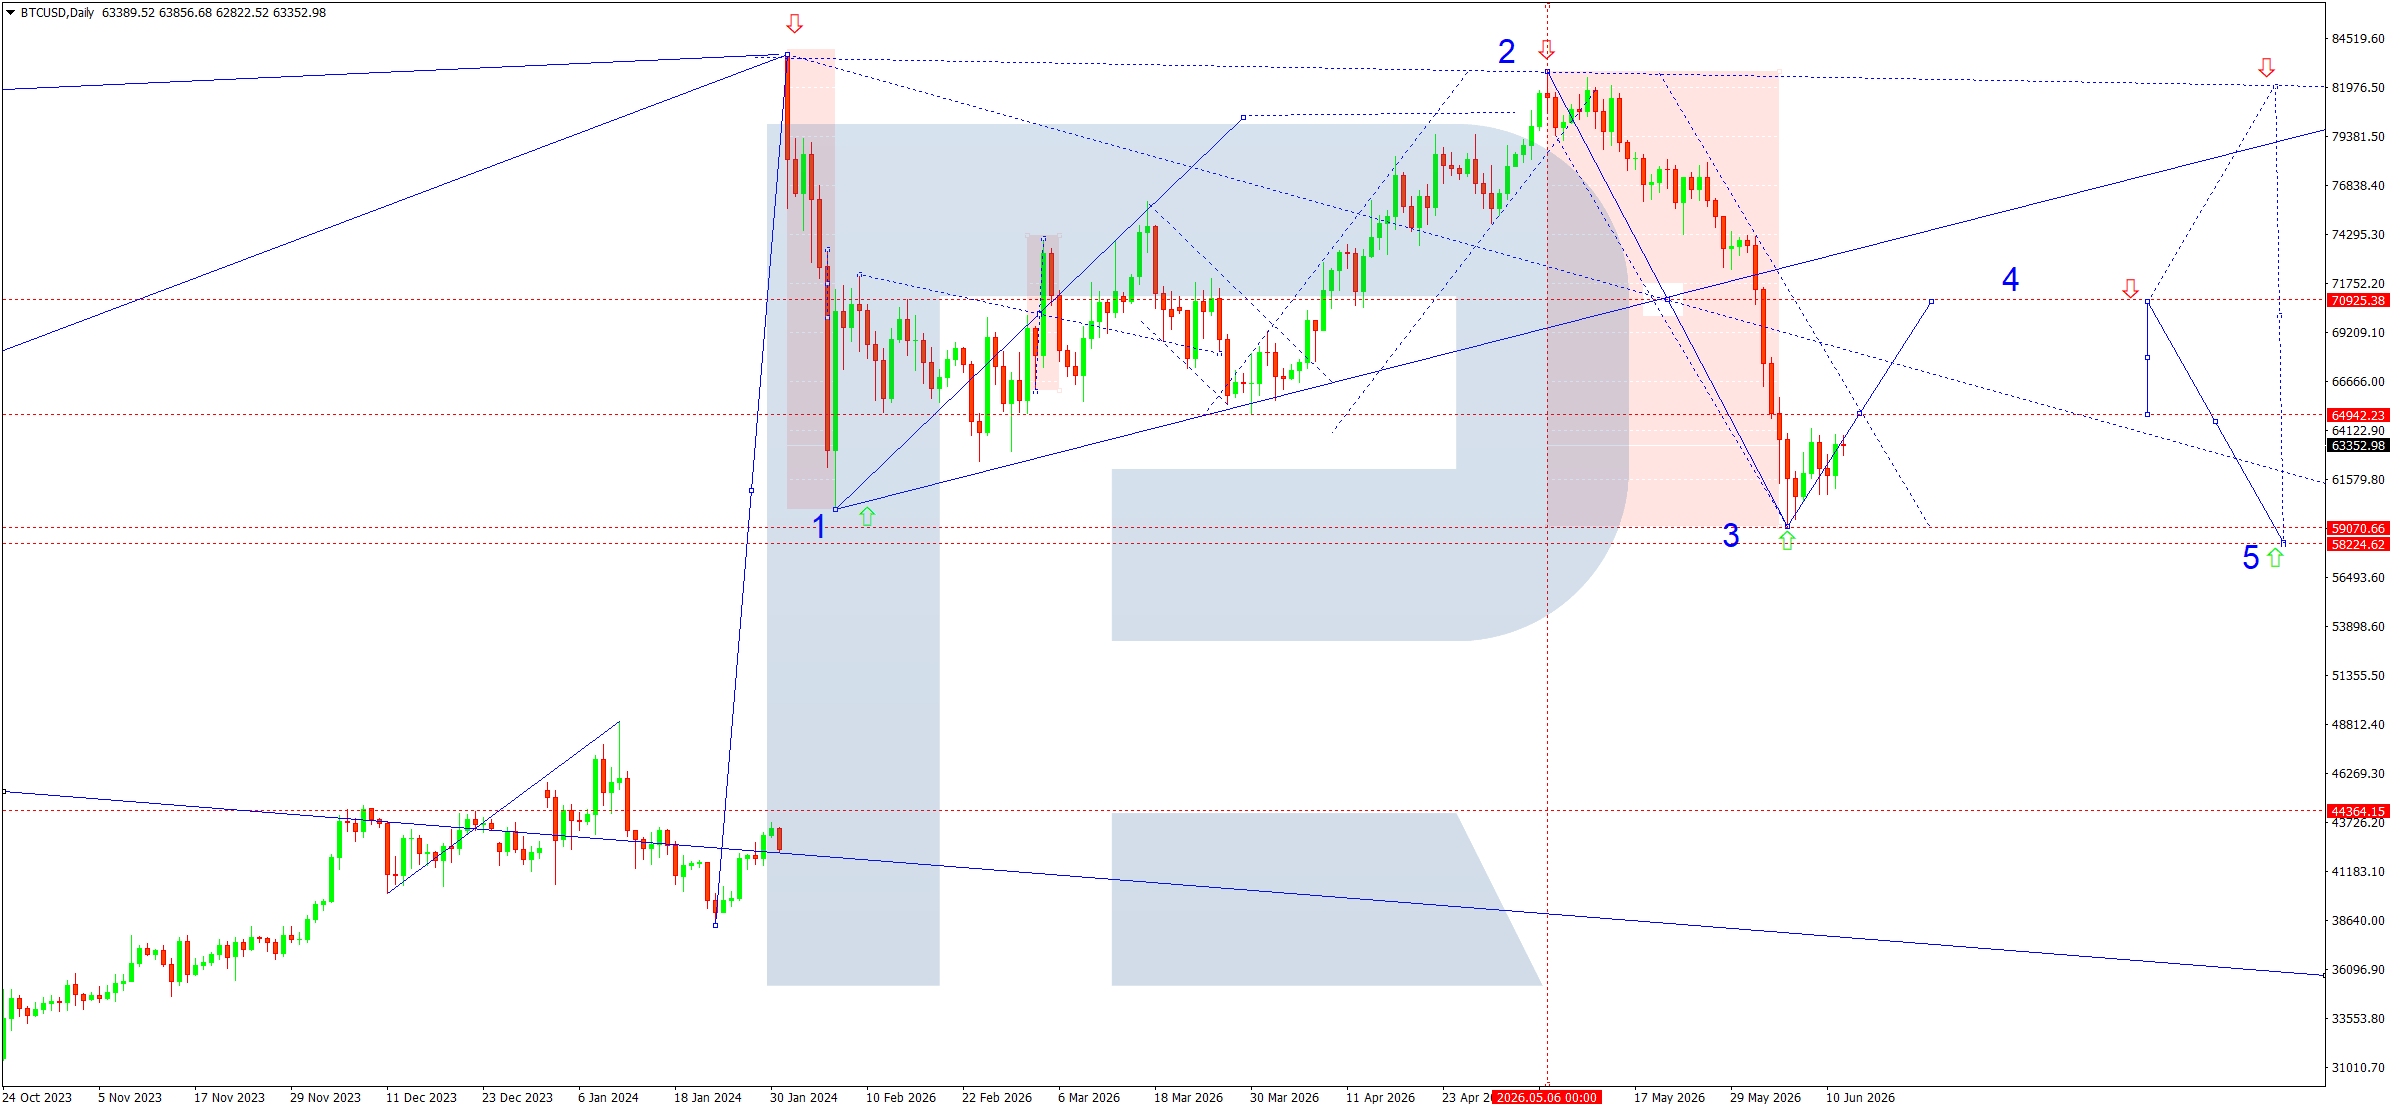
- BTCUSD: Support: 63,353, 59,070. Resistance: 70,925, 81,976
EURUSD forecast
The concluding week was shaped by decisions from major central banks and rising geopolitical tensions in the Middle East. The main event was the European Central Bank's decision to raise interest rates by 0.25% to 2.2500%. The regulator justified the move by citing accelerating inflation driven by higher energy prices and elevated risks to the eurozone economy. At the same time, the ECB downgraded its economic growth forecasts, which limited the euro’s positive reaction.
The situation in the US remains favourable for the dollar. Recent labour market data confirmed the resilience of the US economy, while market participants continue to revise expectations for Federal Reserve policy easing. Some major investment banks now expect high interest rates to remain in place until 2027. Additional support for the dollar comes from demand for safe-haven assets amid ongoing geopolitical risks.
As a result, despite the ECB’s policy tightening, the market continues to favour the US dollar. For EURUSD, the key factor next week will be the balance between the ECB’s hawkish rhetoric and expectations that US rates will remain elevated.
EURUSD technical analysis
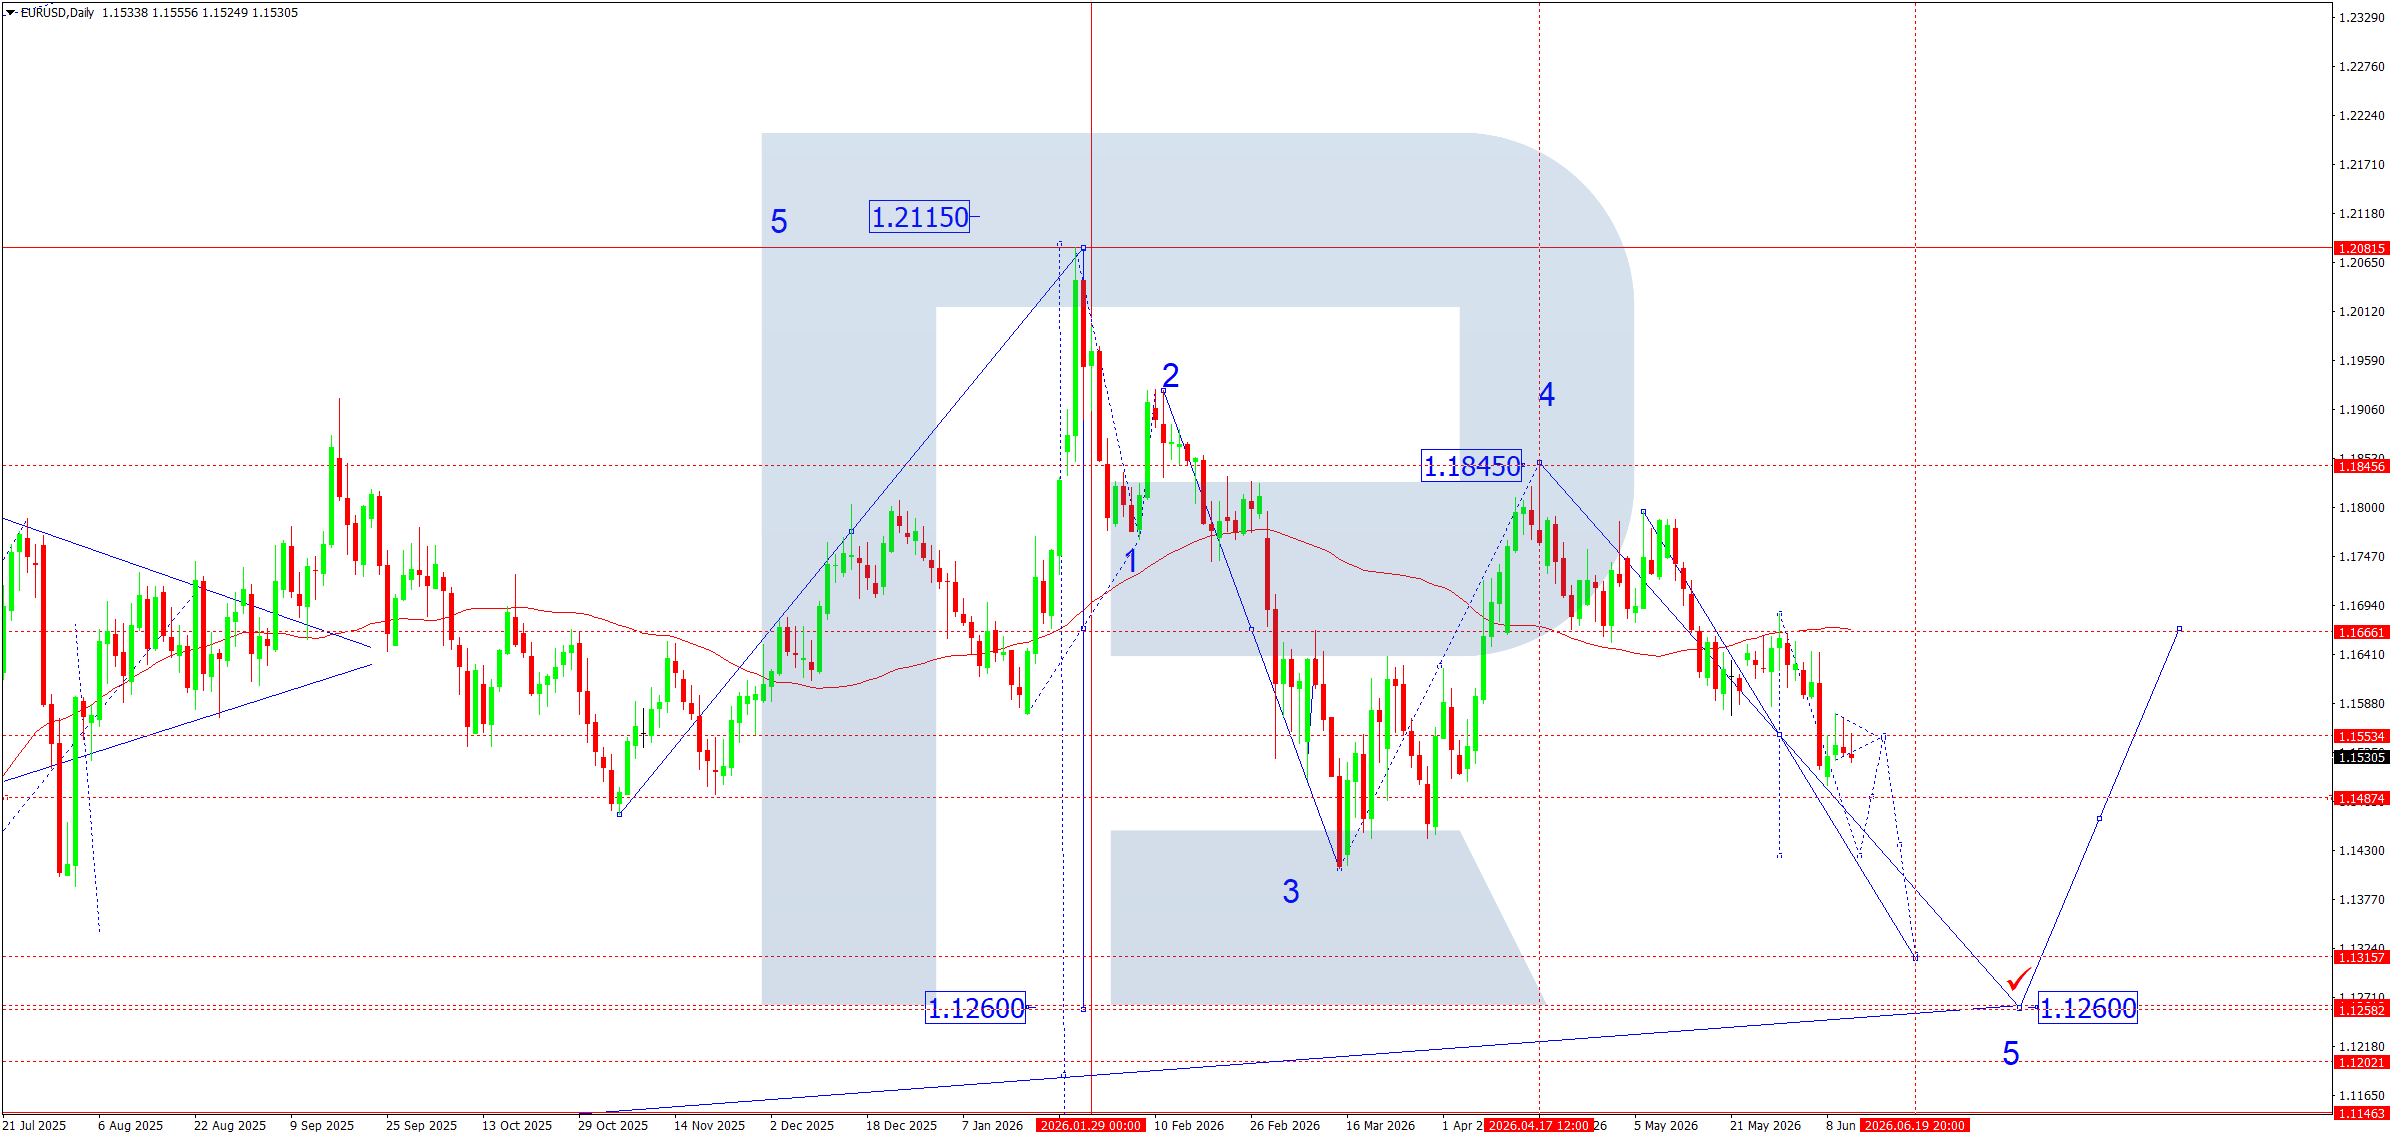
From a technical perspective, EURUSD continues to form a medium-term downward wave structure. After completing a major five-wave upward model with a peak near 1.2081, the market formed corrective wave 1, then wave 2, followed by a decline to the lows of wave 3 near 1.1377.
In April, the market formed corrective wave 4 with a local target at 1.1845, after which the downtrend resumed. The price currently remains near 1.1535 and continues to move within a descending channel.
According to the current Elliott wave count, the market is forming the final fifth downward wave. The nearest target is 1.1313, which represents an important intermediate support level and a profit-taking area for short positions. The next target is 1.1260, where the long-term support line of the uptrend is located.
It should be noted that 1.1555 remains the key pivot point for the market. As long as the price trades below this level, sellers retain the advantage. Any corrective rallies towards 1.1666 should be viewed as potential opportunities to resume selling in line with the primary trend.
The structure of recent trading sessions also suggests a local consolidation range is forming before the next downward impulse. A breakout below 1.1487 could accelerate the decline towards 1.1313 and then to 1.1260.
EURUSD forecast scenarios
Bearish scenario (base case): the market failed to gain a foothold above 1.1555. A decline is expected to continue towards 1.1487 and then 1.1313. The primary target of the fifth wave is located at 1.1260.
Bullish scenario (alternative): if buyers secure a position above 1.1555 and break through resistance at 1.1666, the probability of a corrective advance towards 1.1845 will increase.
USDJPY forecast
This week, market participants will focus on the meetings of the Federal Reserve and the Bank of Japan. Recent US labour market data came in significantly stronger than expected, increasing the likelihood that US monetary policy will remain restrictive for a longer period. Additional support for the dollar comes from persistent inflation risks and rising geopolitical tensions in the Middle East, which increase demand for safe-haven assets and the US currency.
At the same time, the Japanese yen remains under pressure despite growing expectations of a Bank of Japan rate hike. Most economists expect the key interest rate to rise to 1.00%, marking another step in the normalisation of the country's monetary policy. However, the market doubts that even a rate hike will quickly narrow the yield differential between the US and Japan. Additional uncertainty emerged after reports of the hospitalisation of Bank of Japan Governor Kazuo Ueda, although the regulator confirmed continuity in decision-making.
USDJPY technical analysis
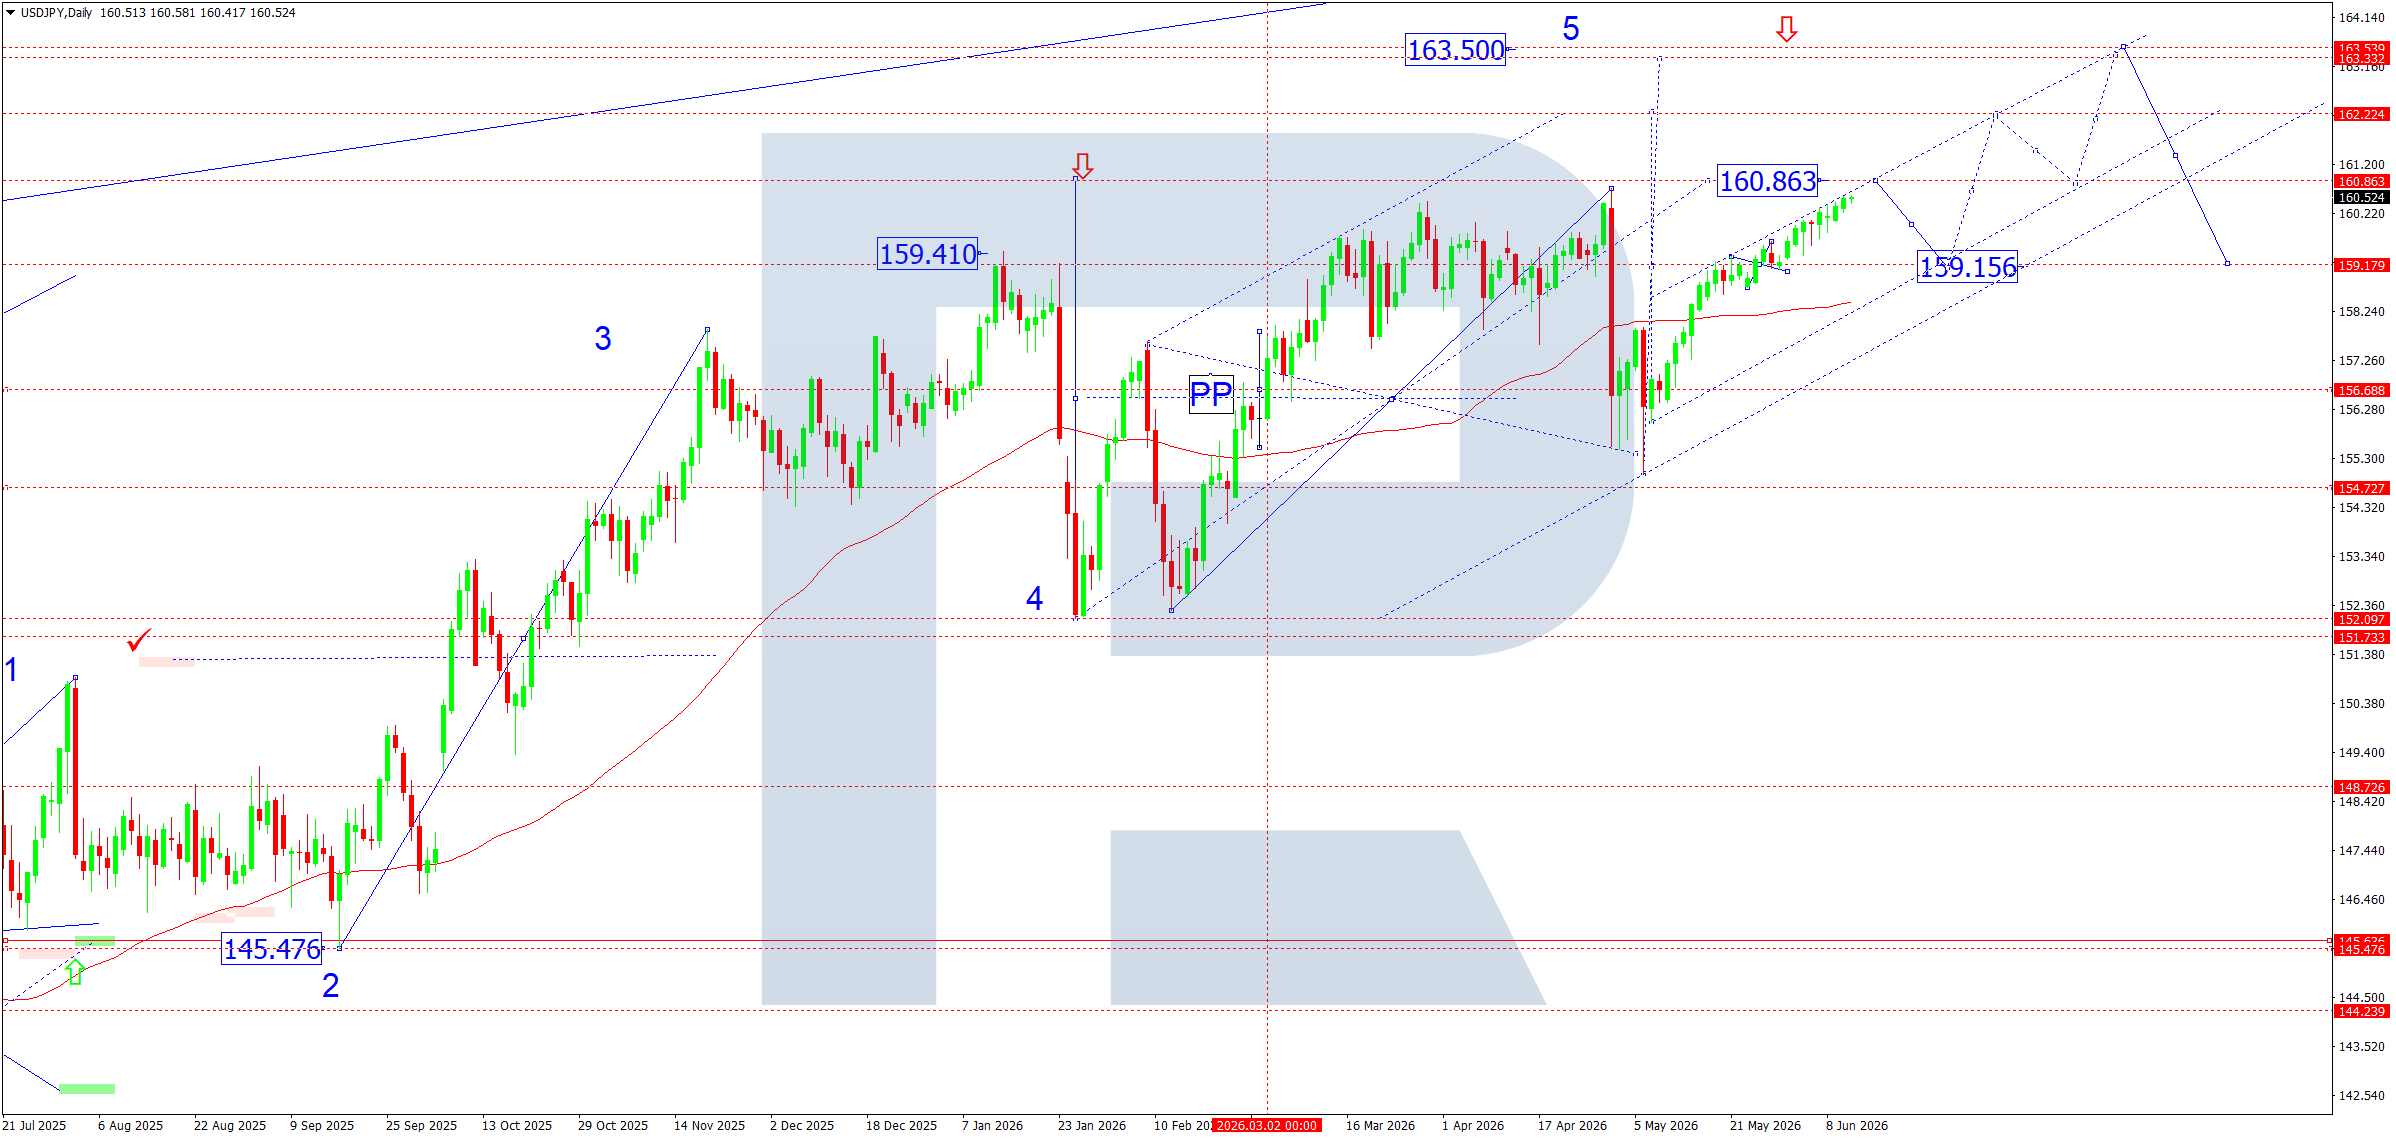
From a technical perspective, USDJPY continues to develop a higher-degree bullish structure. On the daily chart, the fifth Elliott wave remains in progress after the completion of corrective wave 4 near 152.09. The price remains firmly above the pivot point and continues to trade within an ascending channel, confirming that the medium-term bullish trend remains intact.
After forming a local base near 156.69, the market recovered and once again approached the key resistance at 160.86. This level represents the nearest target for buyers and effectively separates the current consolidation from the continuation of the main upward wave. A sustained breakout above 160.86 will open the way towards 162.22, which is the intermediate target within the final phase of wave 5.
From a broader perspective, the market still has the potential to advance towards the primary target at 163.50. This level marks the upper boundary of the current long-term growth scenario and coincides with the projected completion of the impulse structure.
Should a correction develop, 159.15 acts as the nearest support level. A breakout below it would provide the first signal of weakening bullish momentum. The next support lies at 156.69, where the ascending channel support and a key buyer zone are located.
USDJPY forecast scenarios
Bullish scenario (base case): a breakout above 160.86 will open the potential for growth towards 162.22, followed by a move towards 163.50.
Bearish scenario (alternative): if the market breaks below 159.15, the probability of a correction towards 156.69 and the lower boundary of the ascending channel will increase.
GBPUSD forecast
Next week, market participants will focus on decisions by the Federal Reserve and the Bank of England, as well as the publication of key UK macroeconomic indicators. Geopolitical tensions in the Middle East remain an additional source of uncertainty, supporting demand for safe-haven assets and maintaining inflation risks through elevated energy prices.
Recent US economic data continues to demonstrate labour market resilience and support the possibility of a more restrictive Fed policy for longer than previously expected. Meanwhile, the market expects the Bank of England to keep rates unchanged, although the regulator’s guidance could significantly affect sterling. Investors will also closely monitor UK inflation, employment, and GDP figures released shortly before the BoE meeting.
Overall, the fundamental backdrop remains moderately favourable for the US dollar and relatively constrained for the British pound.
GBPUSD technical analysis
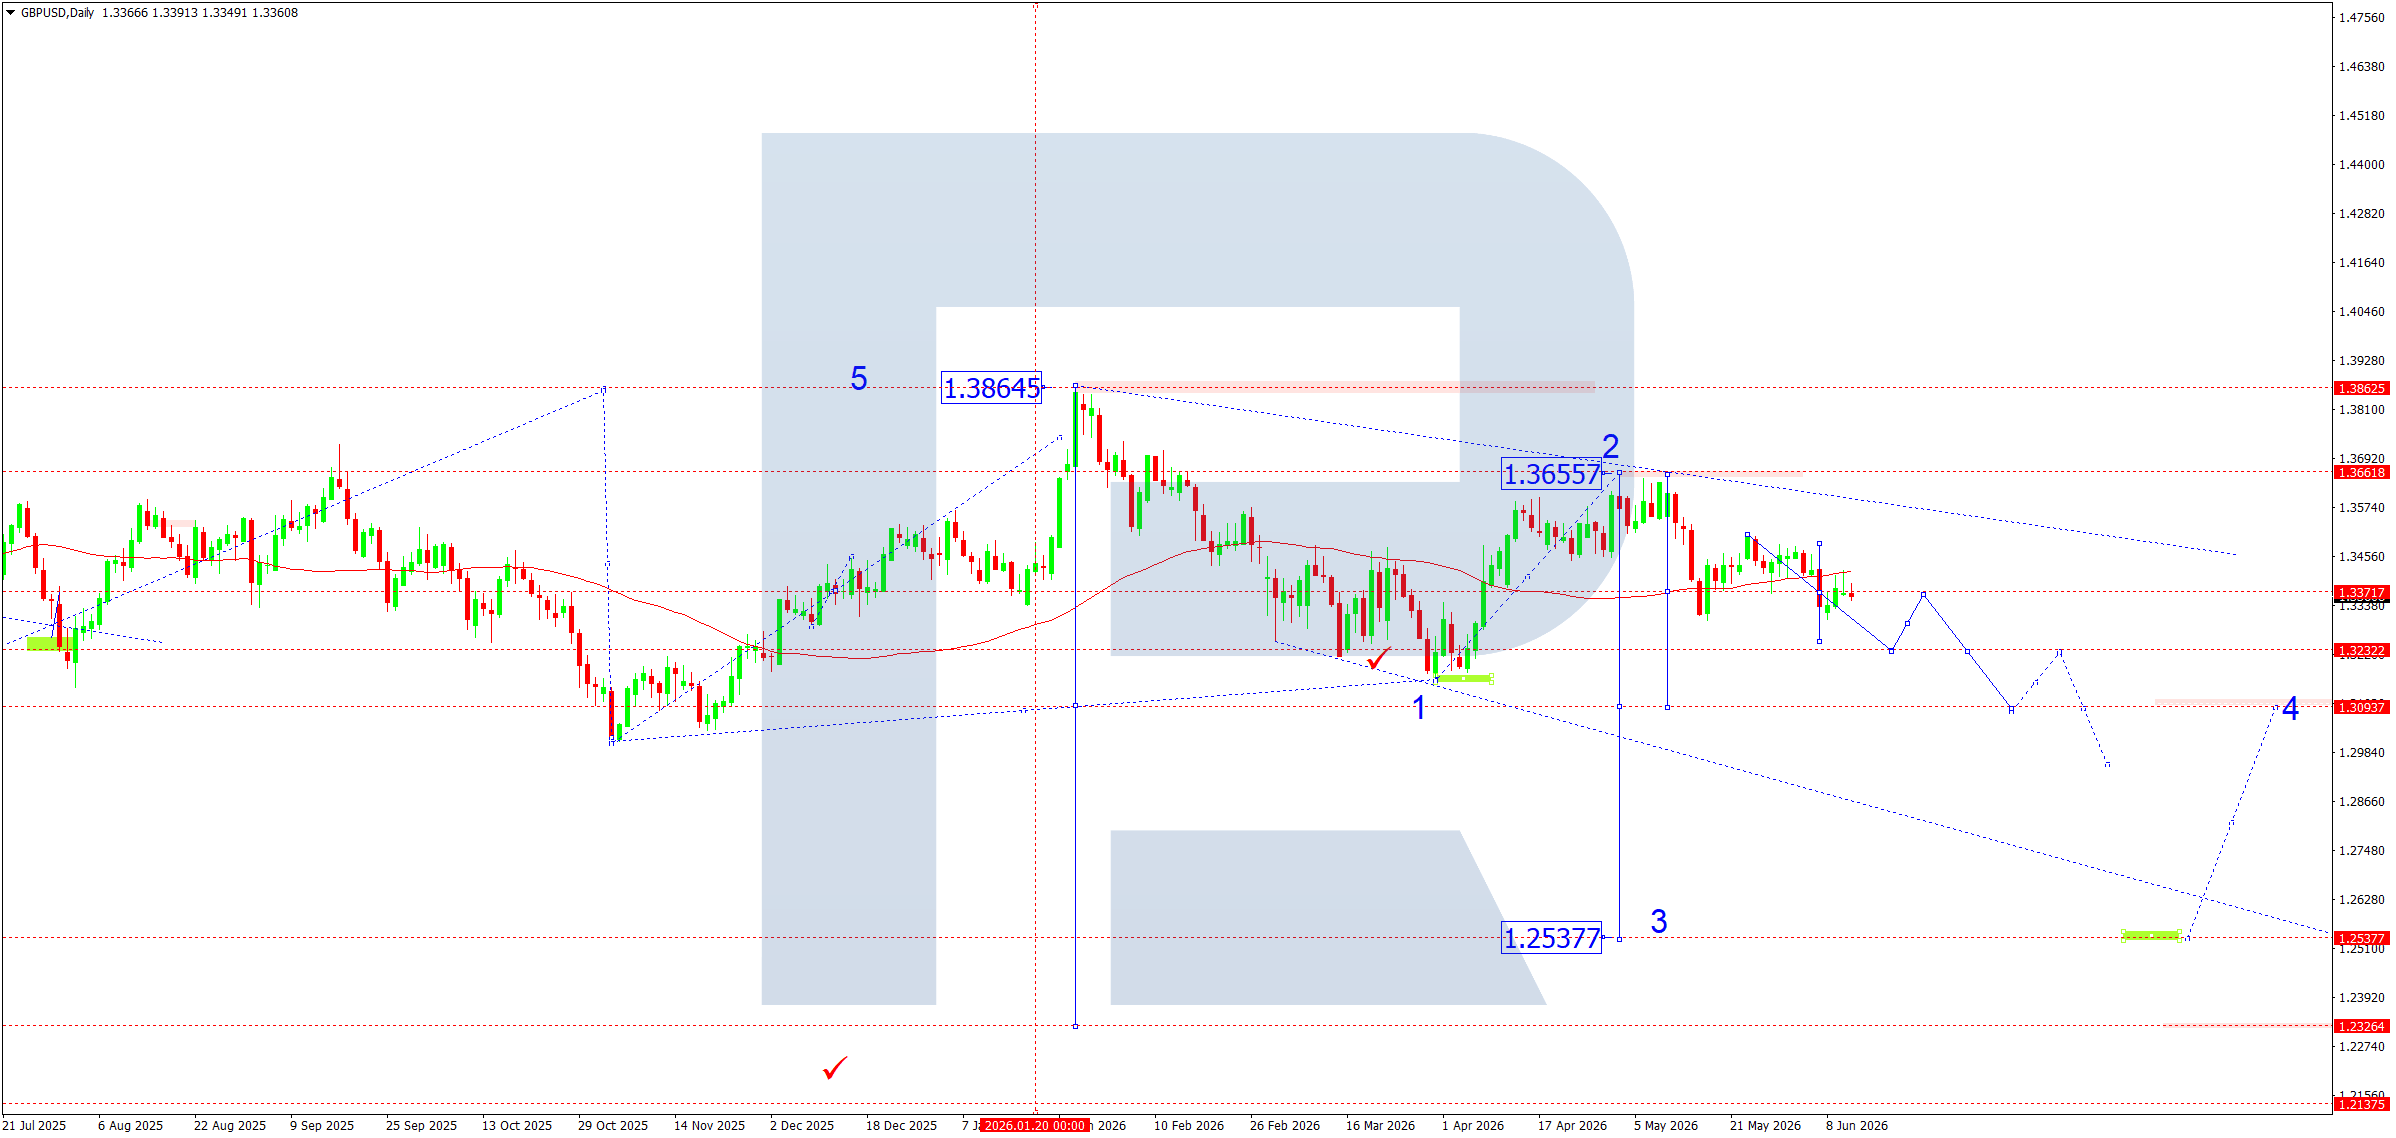
From a technical perspective, GBPUSD continues to form a long-term bearish structure following the completion of wave 5 near 1.3865. The daily chart shows a descending channel, with the upper boundary passing through the 1.3656–1.3865 area. In April, the market formed an important reversal high near 1.3656 before resuming its decline.
The pair is currently trading near the pivot point at 1.3370 and close to the 200-day moving average, indicating a lack of sustained bullish momentum. According to the wave structure, a downward wave is developing from the 1.3656 high, with intermediate targets at 1.3232 and 1.3094. A breakout below 1.3232 would confirm the continuation of the medium-term downtrend.
The chart also shows a sequence of lower highs, confirming seller dominance. Local corrective rallies continue to present opportunities to re-enter short positions in line with the prevailing trend. The primary strategic downside target remains at 1.2538, where the long-term target zone of the current wave model is located.
An additional negative factor for the pound sterling is the inability of buyers to secure a position above 1.3370. As long as the price remains below the 1.3562–1.3656 area, the medium-term structure remains bearish.
GBPUSD forecast scenarios
Bearish scenario (base case): pivot point at 1.3370. Decline from the 1.3370–1.3400 area towards 1.3094 and subsequently 1.2538.
Bullish scenario (alternative): if the market breaks above 1.3400 on rising volume, growth towards the 1.3600 resistance level becomes possible.
AUDUSD forecast
The Australian dollar ended the week under pressure after a strong recovery in the US dollar driven by persistent inflation risks in the US economy. The primary market driver remains expectations regarding future Federal Reserve actions. Recent inflation data showed that price pressures remain elevated, reducing the likelihood of near-term monetary easing and supporting demand for the US currency.
Meanwhile, participants continue to assess the impact of higher energy prices caused by geopolitical tensions in the Middle East.
In Australia, the picture remains mixed. The Reserve Bank of Australia maintains a hawkish stance in its fight against inflation, and high interest rates continue to support returns on Australian assets. However, weak labour market data and slowing economic activity limit the scope for further tightening. Investors are closely watching the upcoming RBA meeting, which may determine the future direction of AUDUSD.
AUDUSD technical analysis
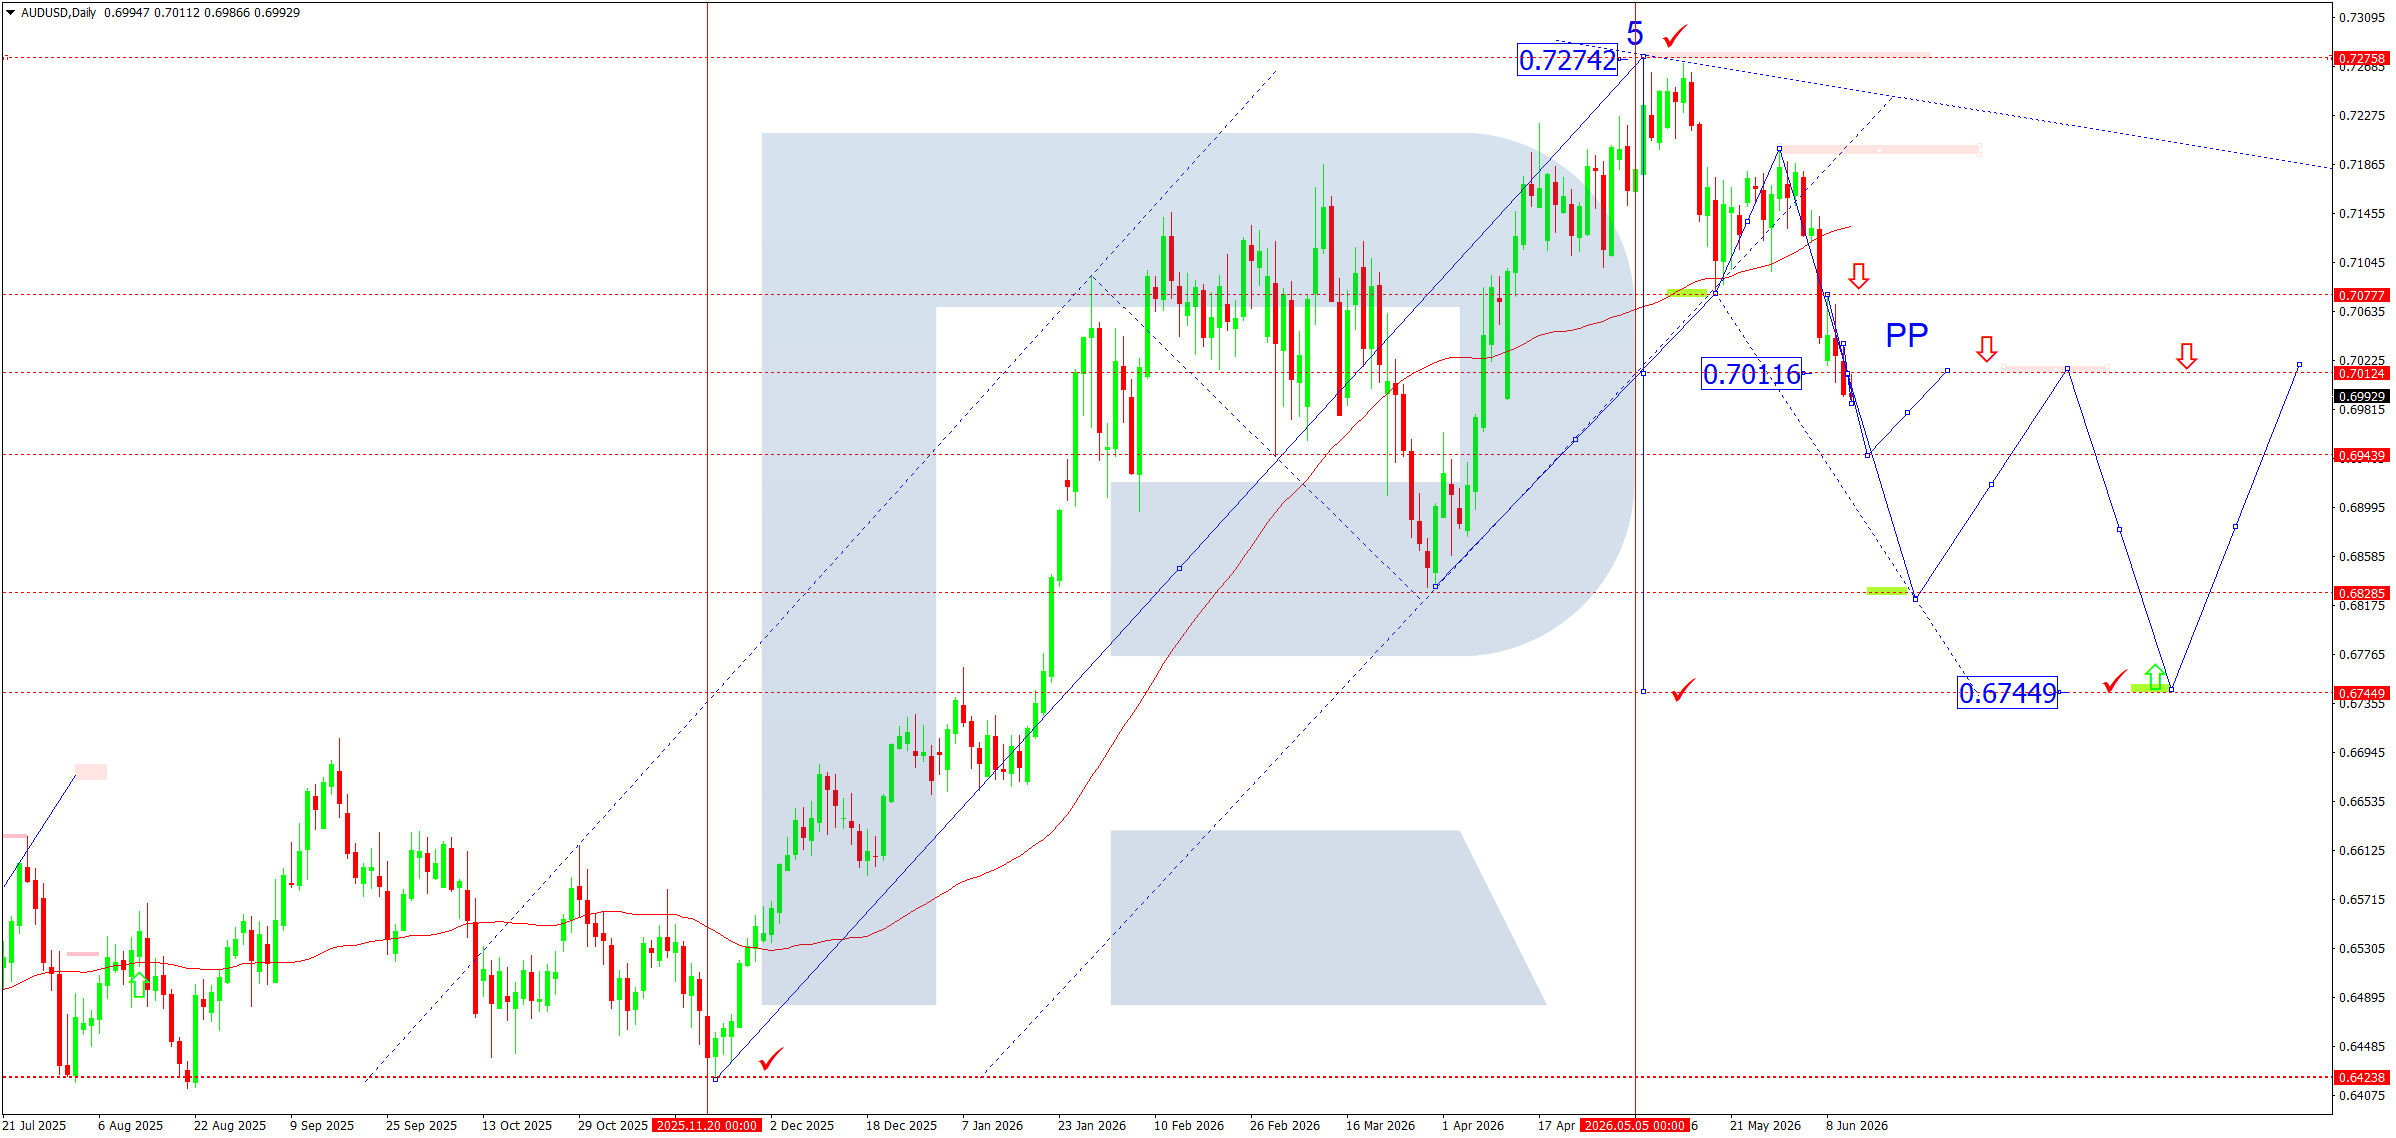
From a technical perspective, the pair continues to develop a corrective decline after completing a five-wave upward structure near 0.7274. This level remains a key medium-term resistance zone and effectively confirms the completion of the previous bullish impulse. After forming the peak, the market broke below the ascending channel and secured a position below the pivot point located near 0.7016.
The price is currently testing the important support area between 0.6990 and 0.7016. The chart structure points to the development of a downward wave towards 0.6828. This level represents the first major downside target and corresponds to intermediate support on the daily timeframe. If broken, the market could continue towards the strategic target at 0.6745, where the next demand zone and the projected completion of the current bearish wave are located.
The medium-term trend remains neutral-to-bearish as the price is trading below the pivot point and beneath the local descending resistance line. Buyers would need to recover above 0.7016 and subsequently break through 0.7186 to regain control of the market. Only then could a renewed advance towards the annual high at 0.7274 be considered.
AUDUSD forecast scenarios
Bearish scenario (base case): a pivot point has formed at 0.7016. A breakout below 0.6990 opens the way for a decline towards 0.6828 and subsequently 0.6745.
Bullish scenario (alternative): if the market gains a foothold above 0.7016 and breaks above the 0.7186 level, a recovery towards 0.7274 becomes possible.
USDCAD forecast
The USDCAD pair retains strong upside potential for the coming week due to the combination of a strong US dollar and continued caution from the Canadian regulator. The main event of the previous week was the Bank of Canada’s decision to keep interest rates unchanged at 2.2500%. The regulator noted that the economy remains under pressure from slowing business activity and the effects of trade restrictions, while inflation risks continue to stem mainly from high energy prices.
Recent US inflation data has also supported the dollar. Producer prices rose above expectations, reducing the likelihood of near-term Federal Reserve easing. Market participants continue to revise interest rate expectations towards a longer period of restrictive monetary policy.
The outlook for the Canadian dollar remains mixed. On one hand, high oil prices traditionally support Canada's economy as a major commodity exporter. On the other hand, the economy has entered a technical recession, while uncertainty surrounding trade relations with the US continues to limit demand for the Canadian currency.
USDCAD technical analysis
From a technical perspective, the daily chart confirms the formation of a bullish wave structure after the completion of a major correction near 1.3484. The market previously formed an important pivot point at 1.3961, which was confirmed by a subsequent decline and the completion of corrective wave 2 near 1.3550.
The price is currently testing the 1.3900–1.3960 area, which represents the key resistance zone. According to the current wave count, a third impulsive wave is forming with a primary target at 1.4300. This level serves as the nearest strategic objective for buyers and corresponds to the upper boundary of the medium-term bullish trend.
After reaching 1.4300, a corrective wave 4 is expected to develop with a potential retracement towards 1.3960, followed by a final wave 5 targeting 1.4384. The long-term structure remains bullish as long as the price stays above the 1.3550–1.3484 area.
An additional technical argument in favour of buyers is the firm position of the price above the daily moving average, which continues to turn upwards and supports the bullish trend.
USDCAD forecast scenarios
Bullish scenario (base case): a breakout above 1.3961 will confirm continued bullish momentum. The next target will be 1.4300. After a correction towards 1.3960, a new impulse may develop towards 1.4384.
Bearish scenario (alternative): if the market breaks below 1.3885 and secures a position beneath it, the probability of a decline towards 1.3750 and subsequently 1.3550 will increase.
XAUUSD forecast
Gold came under heavy selling pressure during the previous week. The decline was primarily driven by expectations that the Federal Reserve will maintain a restrictive monetary policy stance. The latest US inflation data once again exceeded market expectations, while producer price growth reached its highest levels in several years. Additional pressure on gold came from the strong labour market and rising US Treasury yields. Investors continue to reduce positions in safe-haven assets, as the probability of interest rates remaining elevated for an extended period remains high.
Despite ongoing geopolitical tensions in the Middle East and elevated energy prices, traditional demand for gold as a safe-haven asset has weakened noticeably. The market is increasingly focused on US monetary policy and inflation prospects. As a result, gold continues to undergo a correction following the substantial rally seen in late 2025 and early 2026. At the same time, long-term central bank interest in gold remains intact, limiting the potential for a deeper collapse in prices.
XAUUSD technical analysis
From a technical perspective, the daily chart continues to show a bearish structure. After forming a peak near 5,577, the market completed a major corrective model and continued to decline. The chart clearly shows the development of an impulsive downward wave, with waves 1, 2, 3, and 4 already completed. Prices have now almost reached the projected completion zone of wave 5 near 3,923.
The 4,341 level acted as a key support area in recent weeks. Following its breakdown, sellers gained an additional advantage, accelerating the decline towards 4,032. The 4,032 area now represents the first potential stabilisation zone for the market. If a reversal pattern forms there, a corrective recovery towards 4,341 may begin.
The medium-term structure points to a possible completion of the downward cycle in the 3,923–4,032 area. After wave 5 is completed, the market may transition into a deeper correction. The first recovery target is the pivot point near 4,761. A sustained break above this level would open the way for growth towards 5,200 and beyond.
As long as prices remain below 4,761 and below the long-term moving average, the downtrend prevails. Any upward movements should currently be regarded as corrective.
XAUUSD forecast scenarios
Bearish scenario (base case): after a possible short-term consolidation below 4,341, the market may complete its decline towards 4,032 and subsequently test the projected wave 5 target near 3,923.
Bullish scenario (alternative): a sustainable reversal from 4,032 followed by a recovery above 4,341 could lead to a corrective advance towards 4,761.
Brent forecast
The oil market ended the week amid elevated volatility while remaining highly sensitive to geopolitical developments in the Middle East. The main factor influencing Brent continues to be supply disruptions through the Strait of Hormuz, which are still affecting the global supply-demand balance. At the same time, market participants are gradually adapting to the situation, while major energy consumers actively seek alternative supply routes. According to the latest reports, the Organization of the Petroleum Exporting Countries (OPEC) once again lowered its forecast for global oil demand growth in 2026, citing slowing economic activity and the impact of high fuel prices on consumption. Meanwhile, the International Energy Agency (IEA) and the US Energy Information Administration (EIA) also maintain cautious demand outlooks.
An additional factor is OPEC+'s decision to continue gradually increasing production quotas. In theory, this should contribute to market stabilisation; however, actual production volumes remain constrained by logistical challenges and the consequences of the regional conflict. Oil prices continue to receive support from declining US commercial crude inventories, which indicates sustained refinery activity and resilient demand from the refining sector.
Brent technical analysis
From a technical perspective, Brent continues to develop a major corrective structure after reaching the strategic peak at 113.94. On the daily chart, the market remains below the pivot point at 98.60, which continues to be the key level for determining the future medium-term direction. Buyers' inability to secure a position above this threshold confirms that sellers remain in control.
The current structure points to the formation of another downward wave towards the local target at 88.05. This level represents both the nearest support and an important completion zone for the intermediate impulse. If broken, the market will gain additional downside potential towards the strategic target at 83.80, which is marked on the chart as the primary objective of the entire corrective structure.
The medium-term descending channel remains intact, while the price continues to form a sequence of lower highs. At the same time, local corrective advances towards 98.60 remain possible, as this area contains the pivot point of the current wave. Only a confident break and sustained move above this level would signal the completion of the correction and the beginning of a new upward phase towards 105.00–114.00.
Brent forecast scenarios
Bullish scenario (base case): the market is forming a downward wave towards 88.05. A corrective recovery towards 98.60, with a retest of the level from below to above, cannot be ruled out. After the correction is completed, a continuation of the decline towards 83.80 is expected, which remains the primary strategic objective of the current structure.
Bearish scenario (alternative): if buyers manage to secure a position above 98.60, the market will gain potential for growth towards 105.00 and subsequently 113.94.
BTCUSD forecast
During the upcoming week, BTCUSD will be driven by a combination of macroeconomic factors and overall investor appetite for risk assets. The primary theme remains changing expectations regarding Federal Reserve monetary policy. According to the latest market estimates, the probability of rate cuts in 2026 has declined noticeably, while some participants now consider the possibility that restrictive policy could remain in place until 2027. Additional pressure on sentiment comes from rising inflation risks associated with the ongoing conflict in the Middle East and elevated energy prices.
Despite deteriorating sentiment across the digital asset sector during May and early June, Bitcoin is showing signs of stabilisation in the USD 60,000–63,000 area. Several institutional investors continue to view current levels as a long-term accumulation zone. Capital flows into cryptocurrency ETFs remain one of the most important indicators for future market direction. A reduction in outflows and a recovery in demand could support a BTCUSD rebound during the second half of June.
BTCUSD technical analysis
From a technical perspective, the daily chart continues to display a pronounced corrective structure following the formation of a peak in the USD 83,500–84,500 area. According to the Elliott Wave count, the market formed wave 1 near 60,000, then a powerful corrective wave 2 towards 81,976, followed by impulsive wave 3 downwards to 59,070. Corrective wave 4 is currently developing.
The key level for the current structure is 70,925. This level represents the pivot point of the entire corrective model. As long as the market remains below this level, the dominant scenario remains the development of the final wave 5 downwards. Additional confirmation of the bearish structure comes from the descending channel formed after the wave 2 peak.
In the coming days, a continuation of the recovery from the USD 63,000–65,000 area remains possible, followed by a test of resistance at 70,925. This area coincides with the upper boundary of the local channel and may attract sellers. If reversal signals emerge there, the market could resume its decline towards the strategic target at 58,224. Reaching this area would signal the completion of the entire five-wave corrective structure.
A break and sustained move above 70,925 would be the first indication that the bearish scenario is weakening. In that case, the probability of a retest of the USD 81,900–82,000 area would increase, where the wave 2 peak and a key medium-term resistance zone are located.
BTCUSD forecast scenarios
Bearish scenario (base case): the market is forming a five-wave corrective structure from 83,544 to 58,224. Waves 1 = 60,000, 2 = 81,976, and 3 = 59,070 have already formed. Next, wave 4 is expected to develop towards 70,925, followed by the beginning of wave 5 towards 58,224.
Bullish scenario (alternative): if buyers manage to secure a position above 70,925 and confirm the breakout with rising volumes, growth potential towards 81,900–82,000 will emerge.
Editors’ picks
 EURUSD forecast 2026–2027: technical analysis, price levels & predictions
The ECB holds rates at 2.15% while the Fed stays at 3.75% — and that divergence is the central driver of EURUSD in 2026. The pair is range-bound between 1.1400 and 1.1915, with Deutsche Bank targeting 1.2500 and Morgan Stanley calling for 1.3000 by year-end. We analyse the technicals, break down the macro factors, and outline three trading scenarios with specific entry levels.
 Gold (XAUUSD) forecast 2026: predictions based on fundamental and technical analysis
Where is gold headed after pulling back from the all-time high of 5,597 USD? XAUUSD is consolidating near 4,518 USD between key levels 4,220 USD and 4,855 USD, with major banks targeting 5,243–6,200 USD by year-end. Read our comprehensive gold forecast: technical analysis across three timeframes, trading scenarios with specific entry levels, Fed policy and central bank demand outlook, and institutional predictions for 2026 and beyond.
Forecasts presented in this section only reflect the author’s private opinion and should not be considered as guidance for trading. RoboForex bears no responsibility for trading results based on trading recommendations described in these analytical reviews.