Weekly technical analysis and forecast (22–26 June 2026)
In this weekly technical analysis, we review key chart patterns and levels for EUSUSD, USDJPY, GBPUSD, AUDUSD, USDCAD, gold (XAUUSD), Brent oil, and bitcoin (BTCUSD) to forecast developments for the upcoming week (22–26 June 2026)
Major technical levels to watch this week
- EURUSD: Support: 1.1430, 1.1318. Resistance: 1.1549, 1.1670
- USDJPY: Support: 159.90, 158.55. Resistance: 161.30, 162.15
- GBPUSD: Support: 1.3122, 1.3000. Resistance: 1.3390, 1.3410
- AUDUSD: Support: 0.6969, 0.6900. Resistance: 0.7030, 0.7086
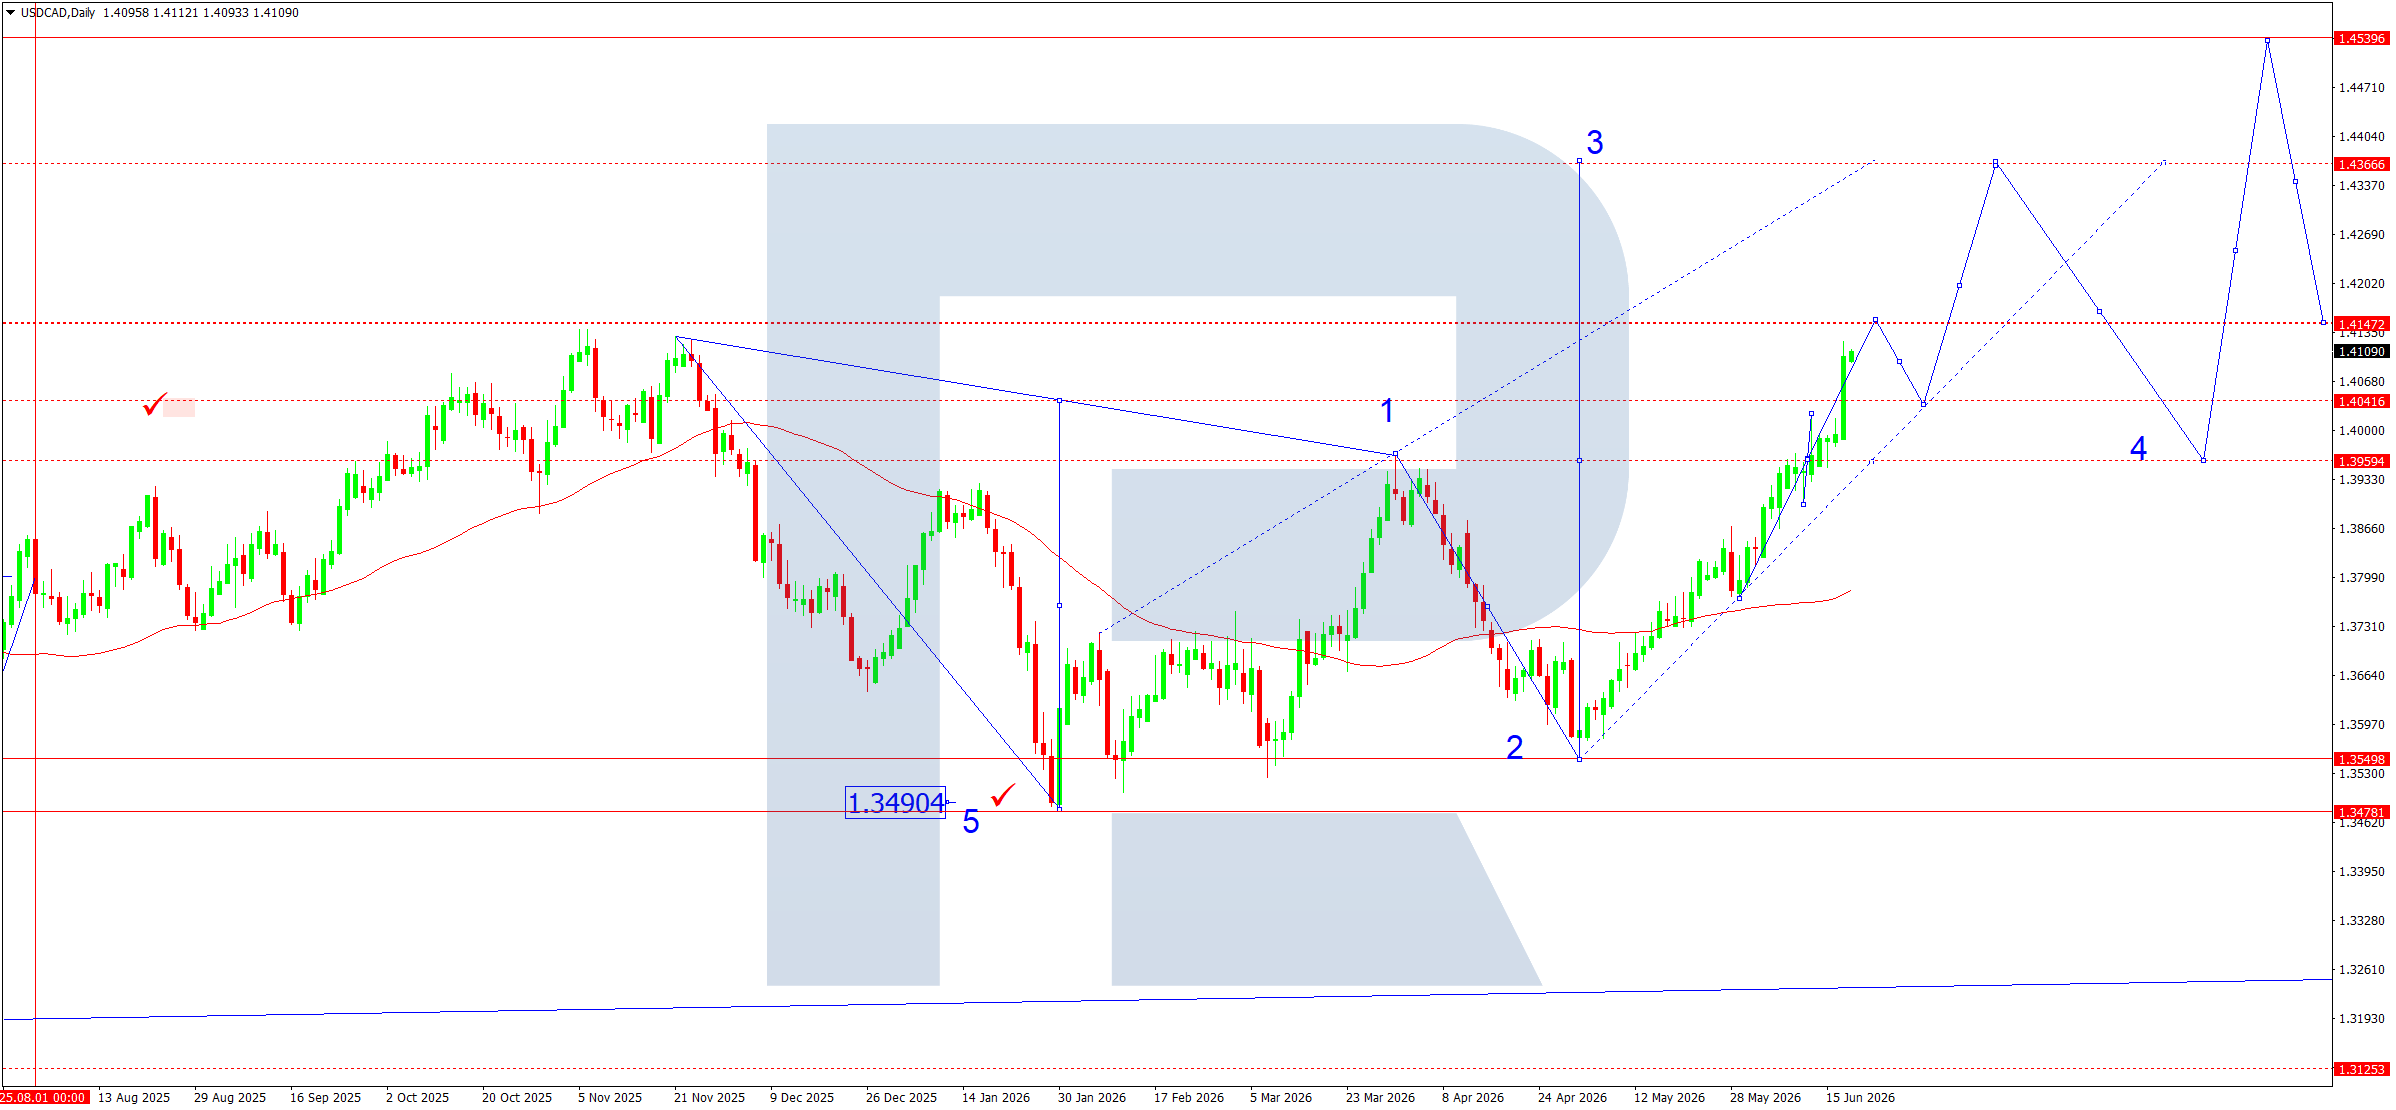
- USDCAD: Support: 1.4040, 1.3959. Resistance: 1.4147, 1.4366
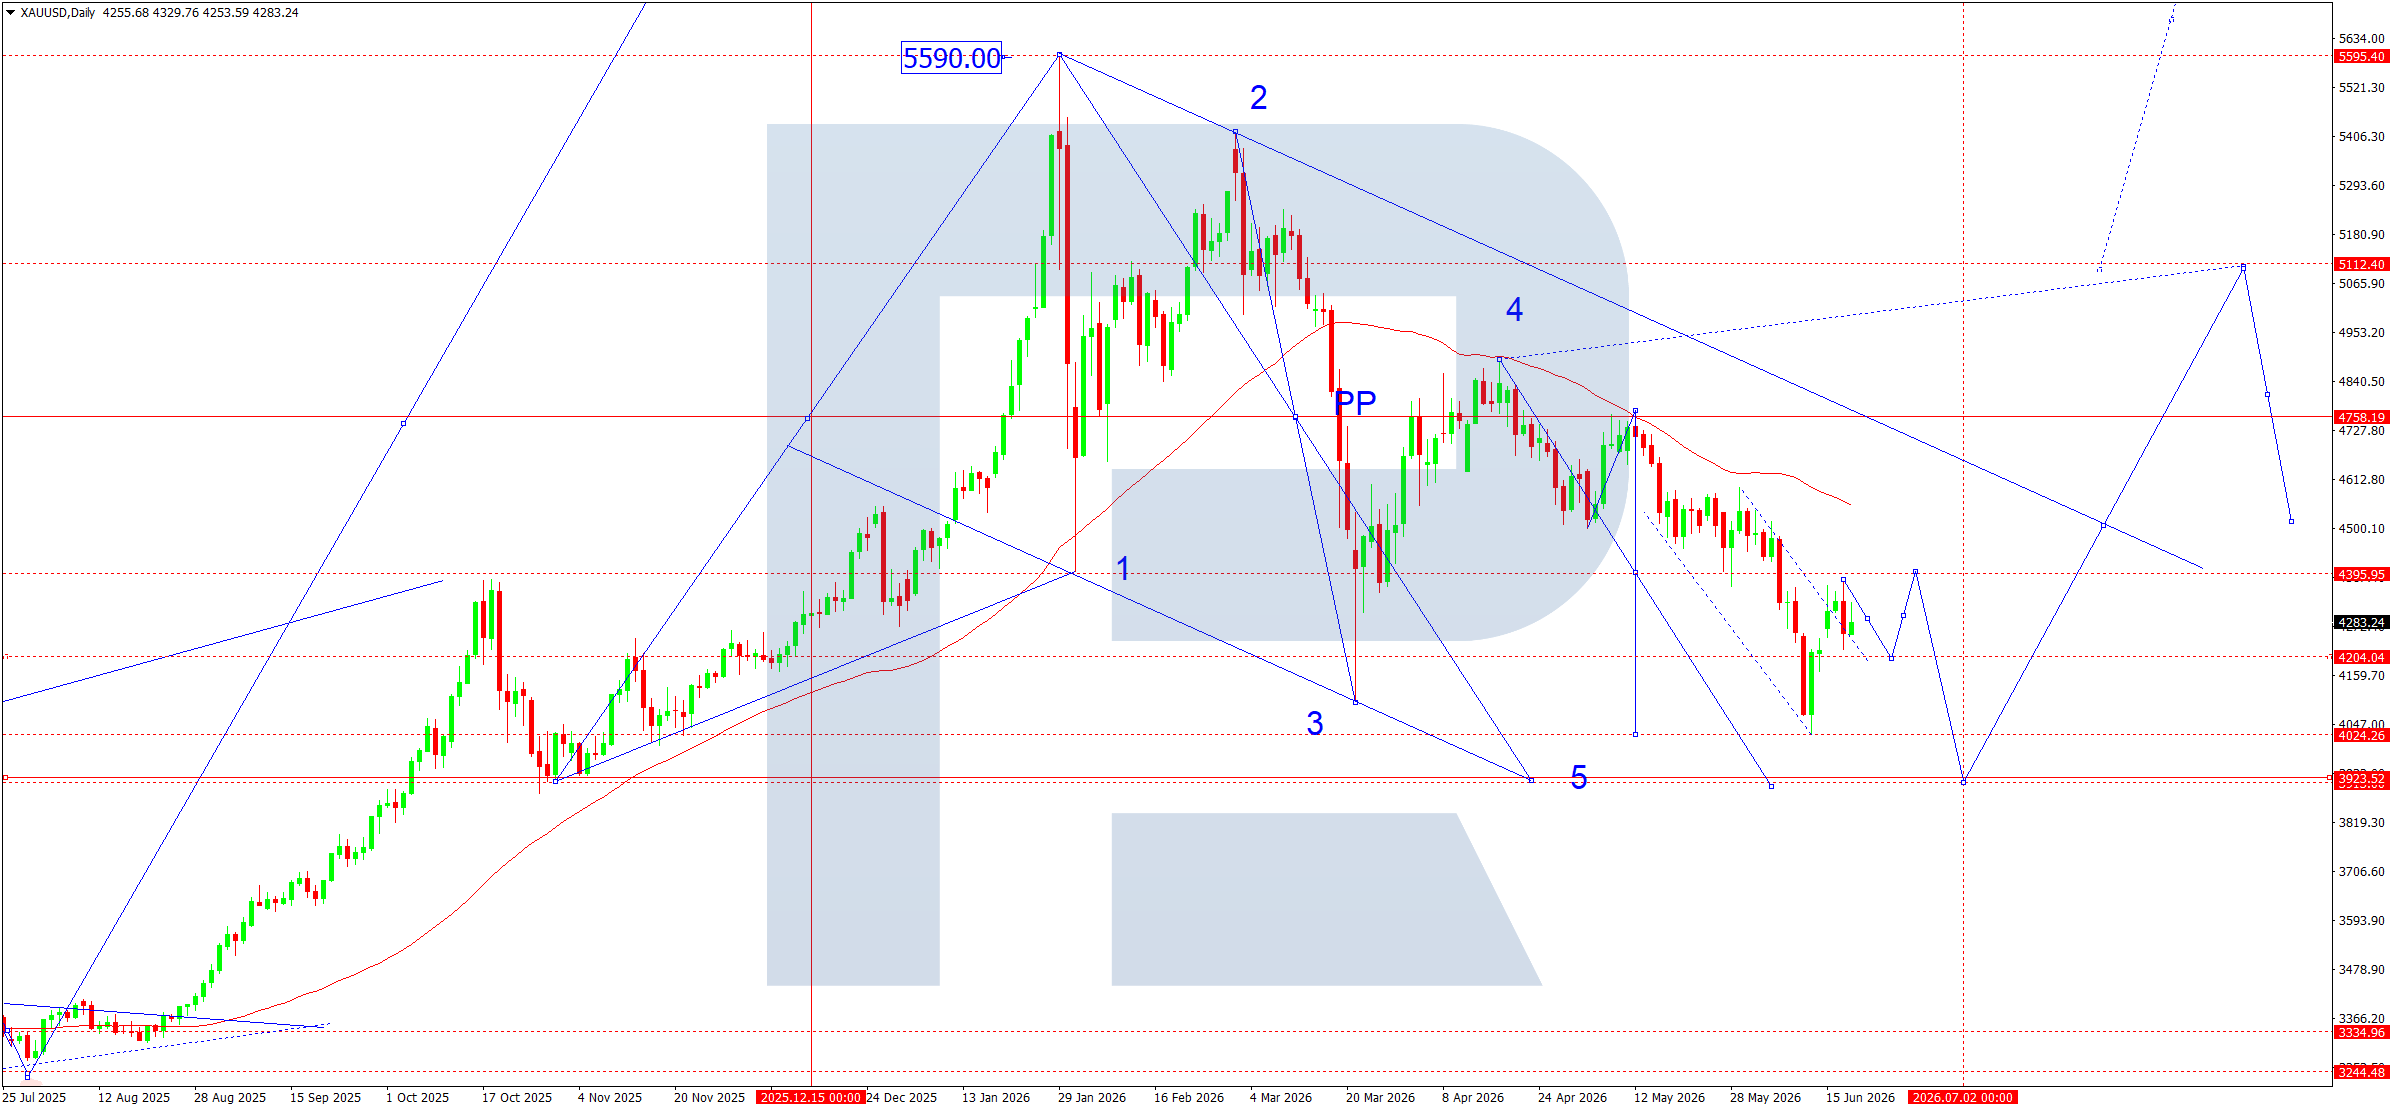
- Gold: Support: 4,204, 3,923. Resistance: 4,395, 4,758
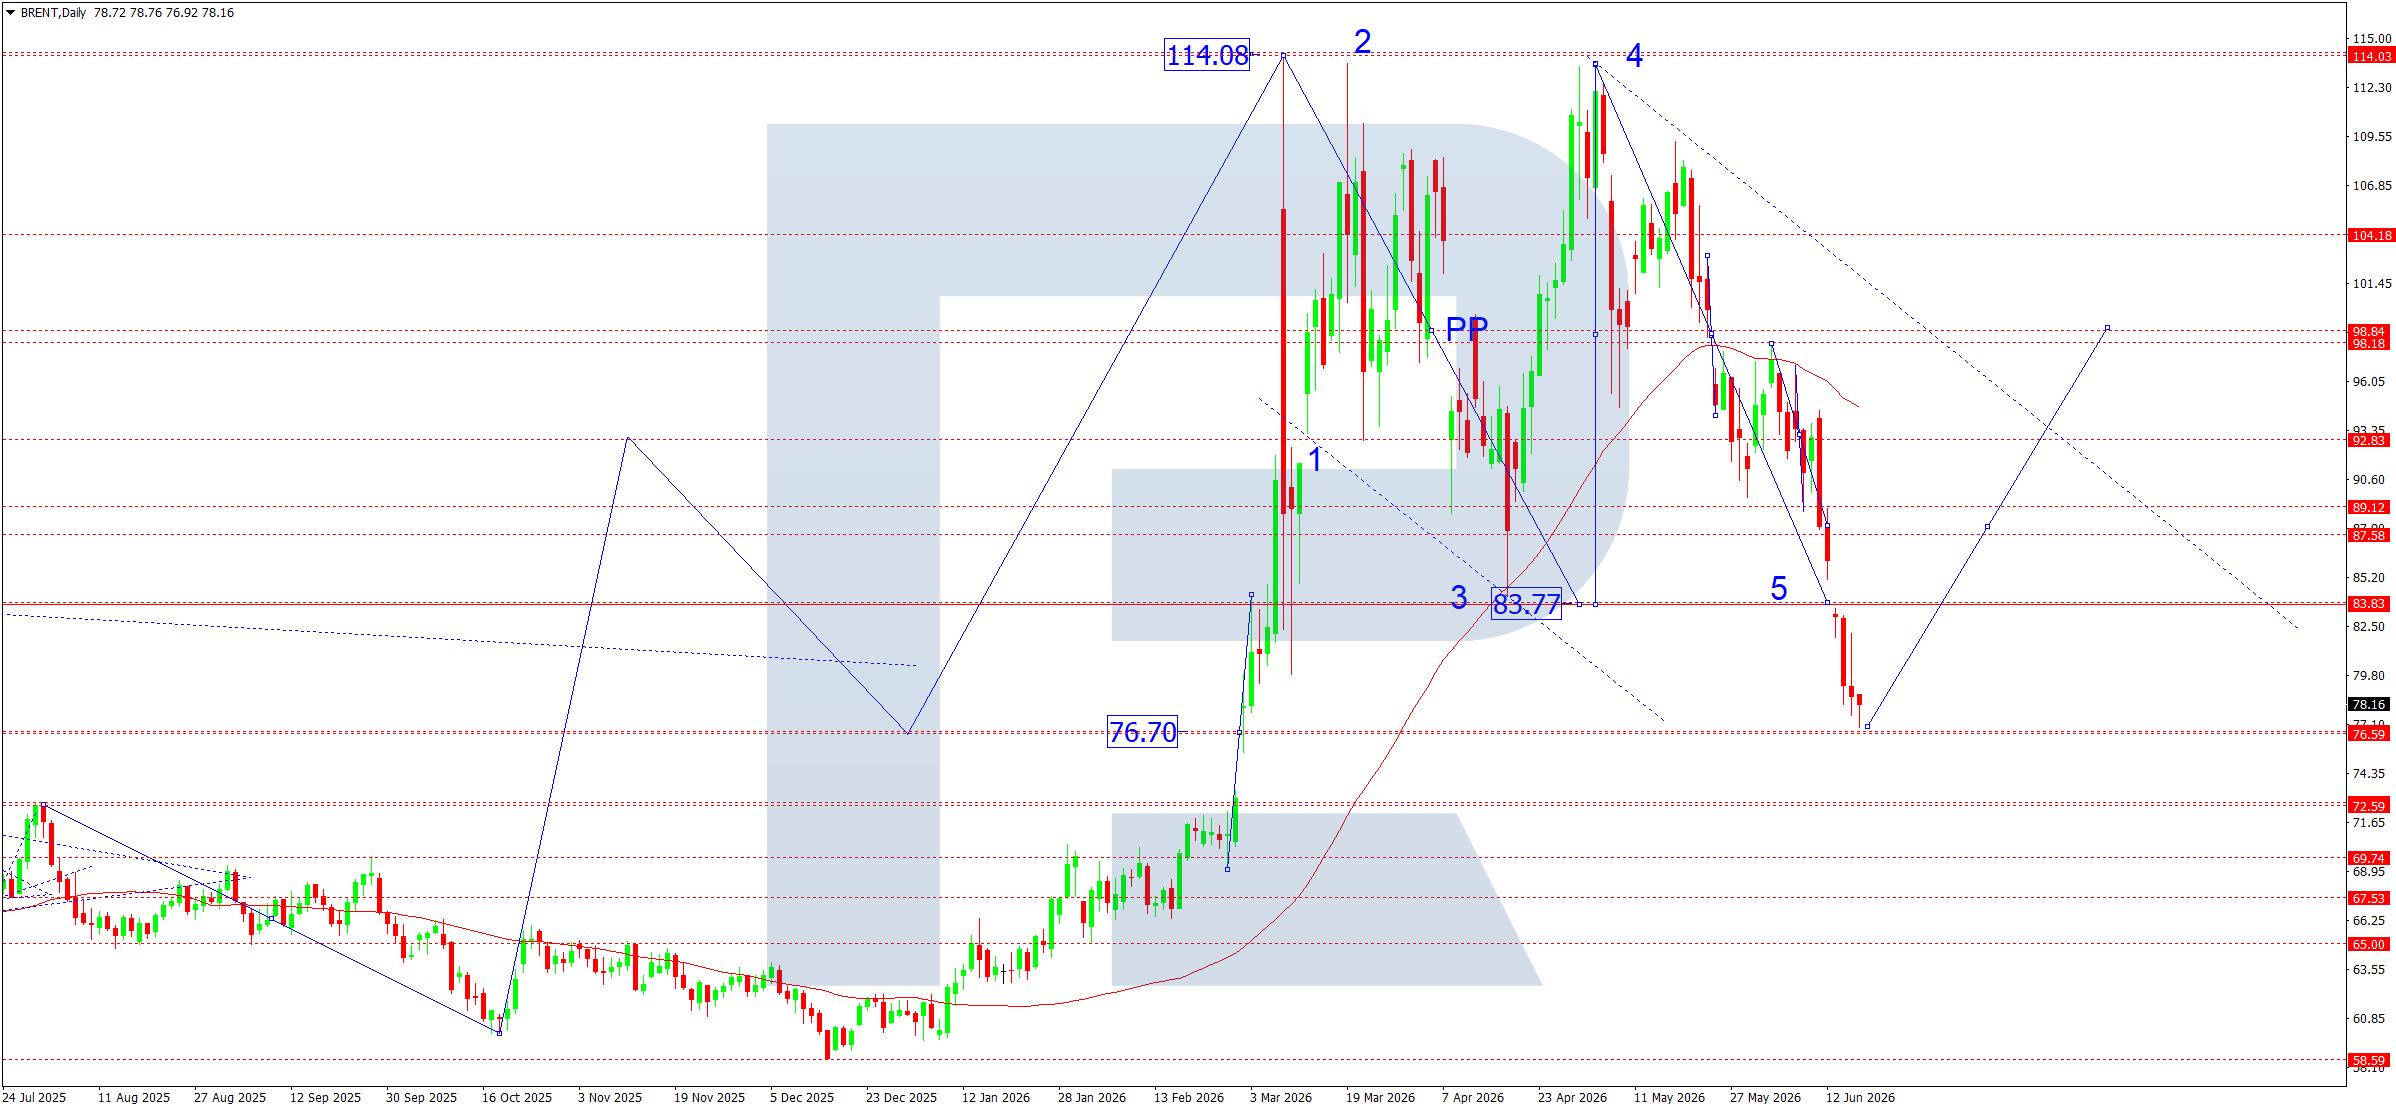
- Brent: Support: 88.05, 83.80. Resistance: 98.60, 113.94
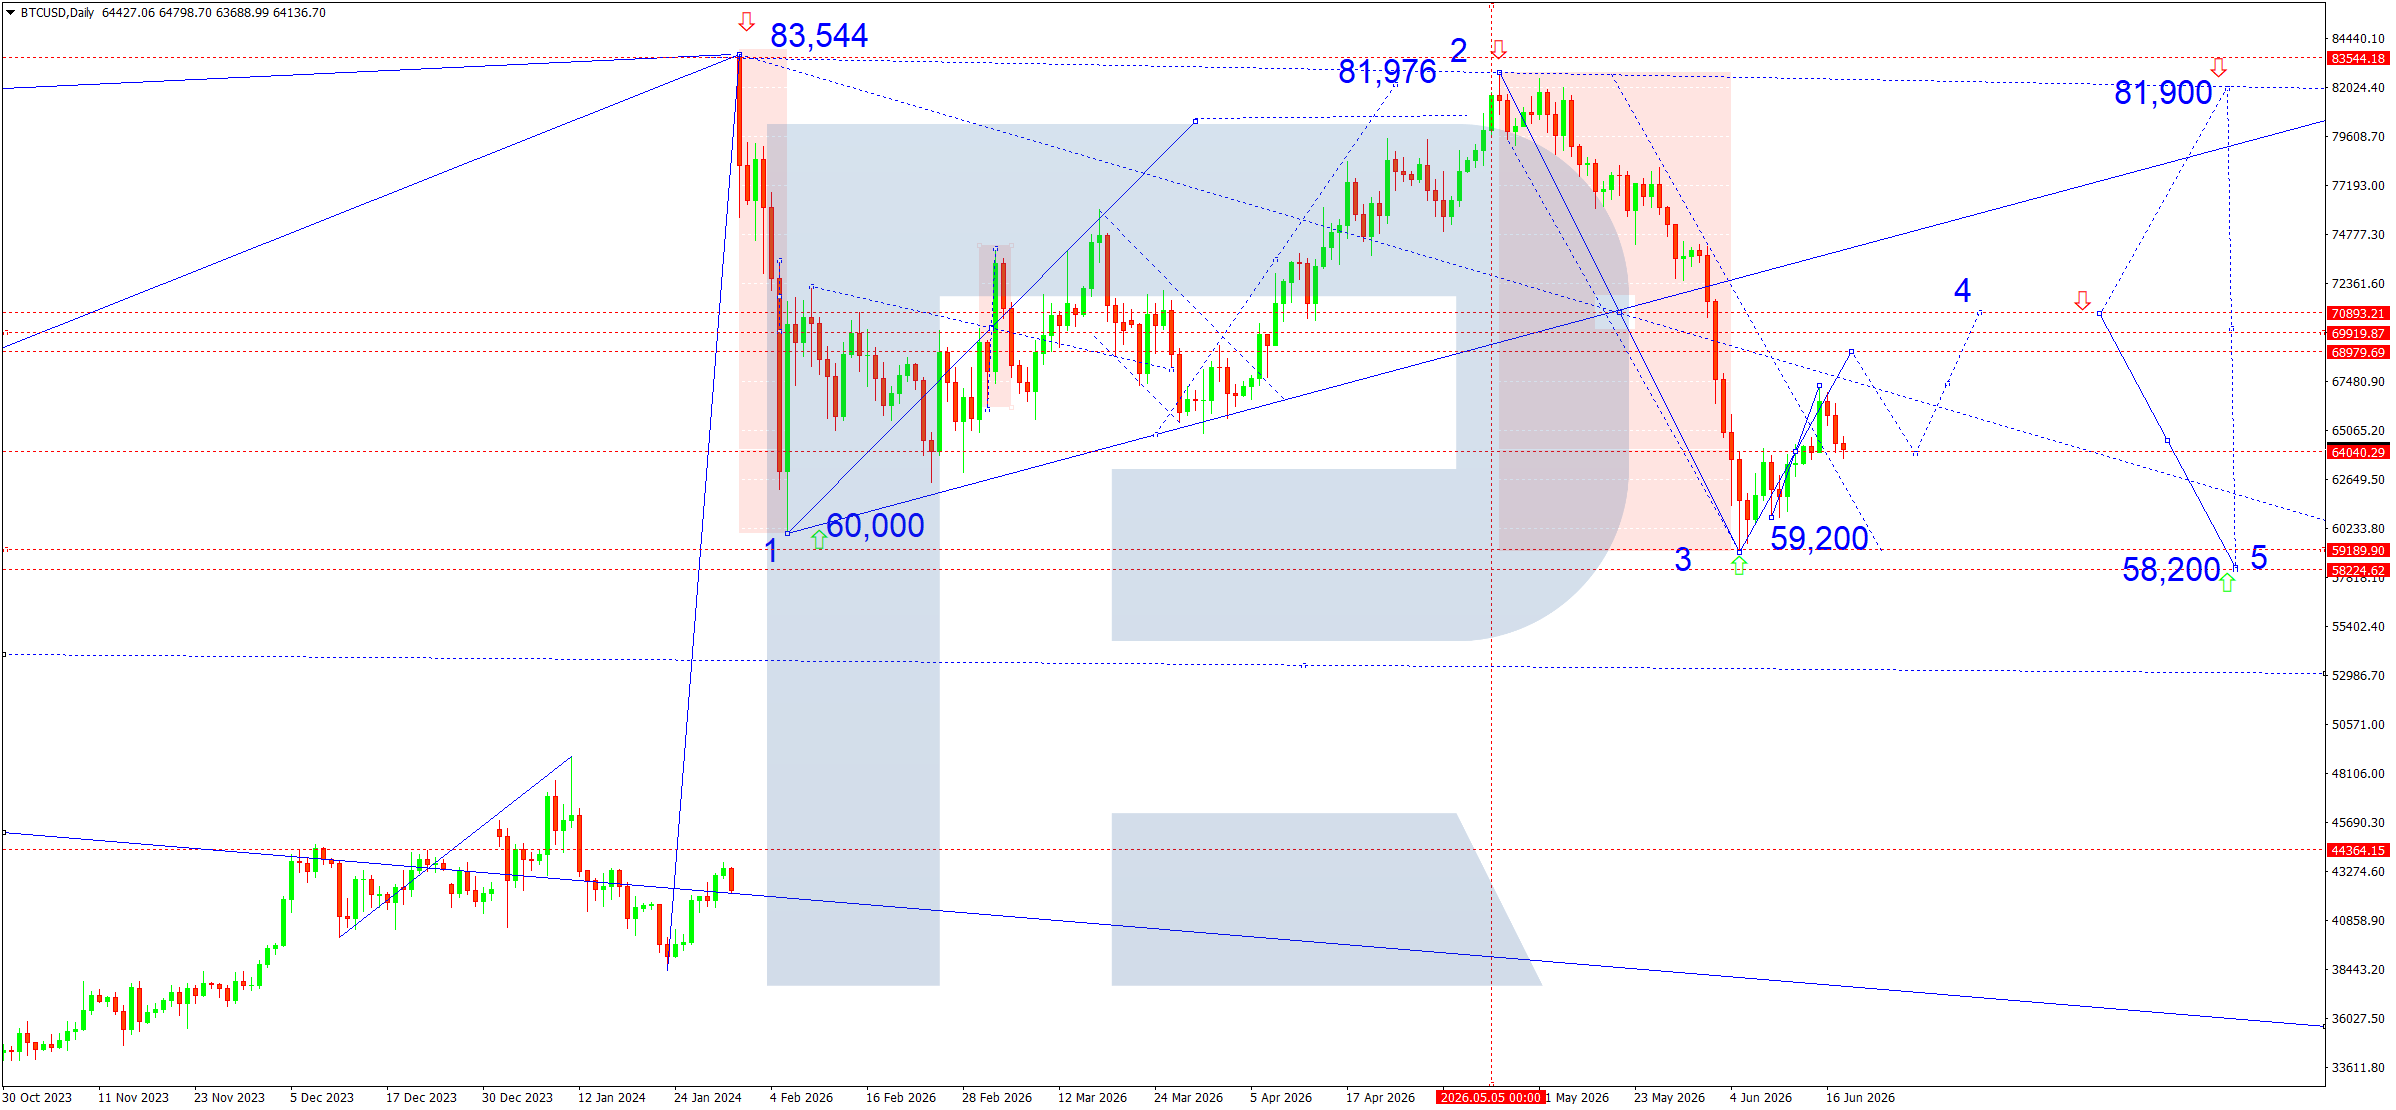
- BTCUSD: Support: 64,040; 59,200. Resistance: 69,900; 70,900
EURUSD forecast
The EURUSD pair ended the week under pressure following the meetings of the major central banks. The main market driver remains changing expectations regarding the monetary policies of the Federal Reserve (Fed) and the European Central Bank (ECB). At its June meeting, the Fed left interest rates unchanged; however, policymakers adopted a more hawkish stance regarding the ongoing fight against inflation. The market has begun pricing in the possibility of an additional rate hike before the end of the year, supporting the US dollar.
At the same time, the European Central Bank (ECB) raised its key rate by 0.25%, for the first time since 2023. The move came in response to accelerating inflation in the eurozone, which reached 3.2000% amid rising energy prices and the consequences of the Middle East conflict. Despite the rate increase, the euro failed to receive sustained support as investors questioned the ability of the European economy to withstand a prolonged tightening cycle.
An additional factor was the easing of geopolitical tensions following reports of a temporary agreement between the US and Iran, which triggered a correction in oil prices. However, inflation risks remain elevated in both the US and the eurozone. As a result, the market continues to favour the US dollar as a safe-haven asset.
EURUSD technical analysis
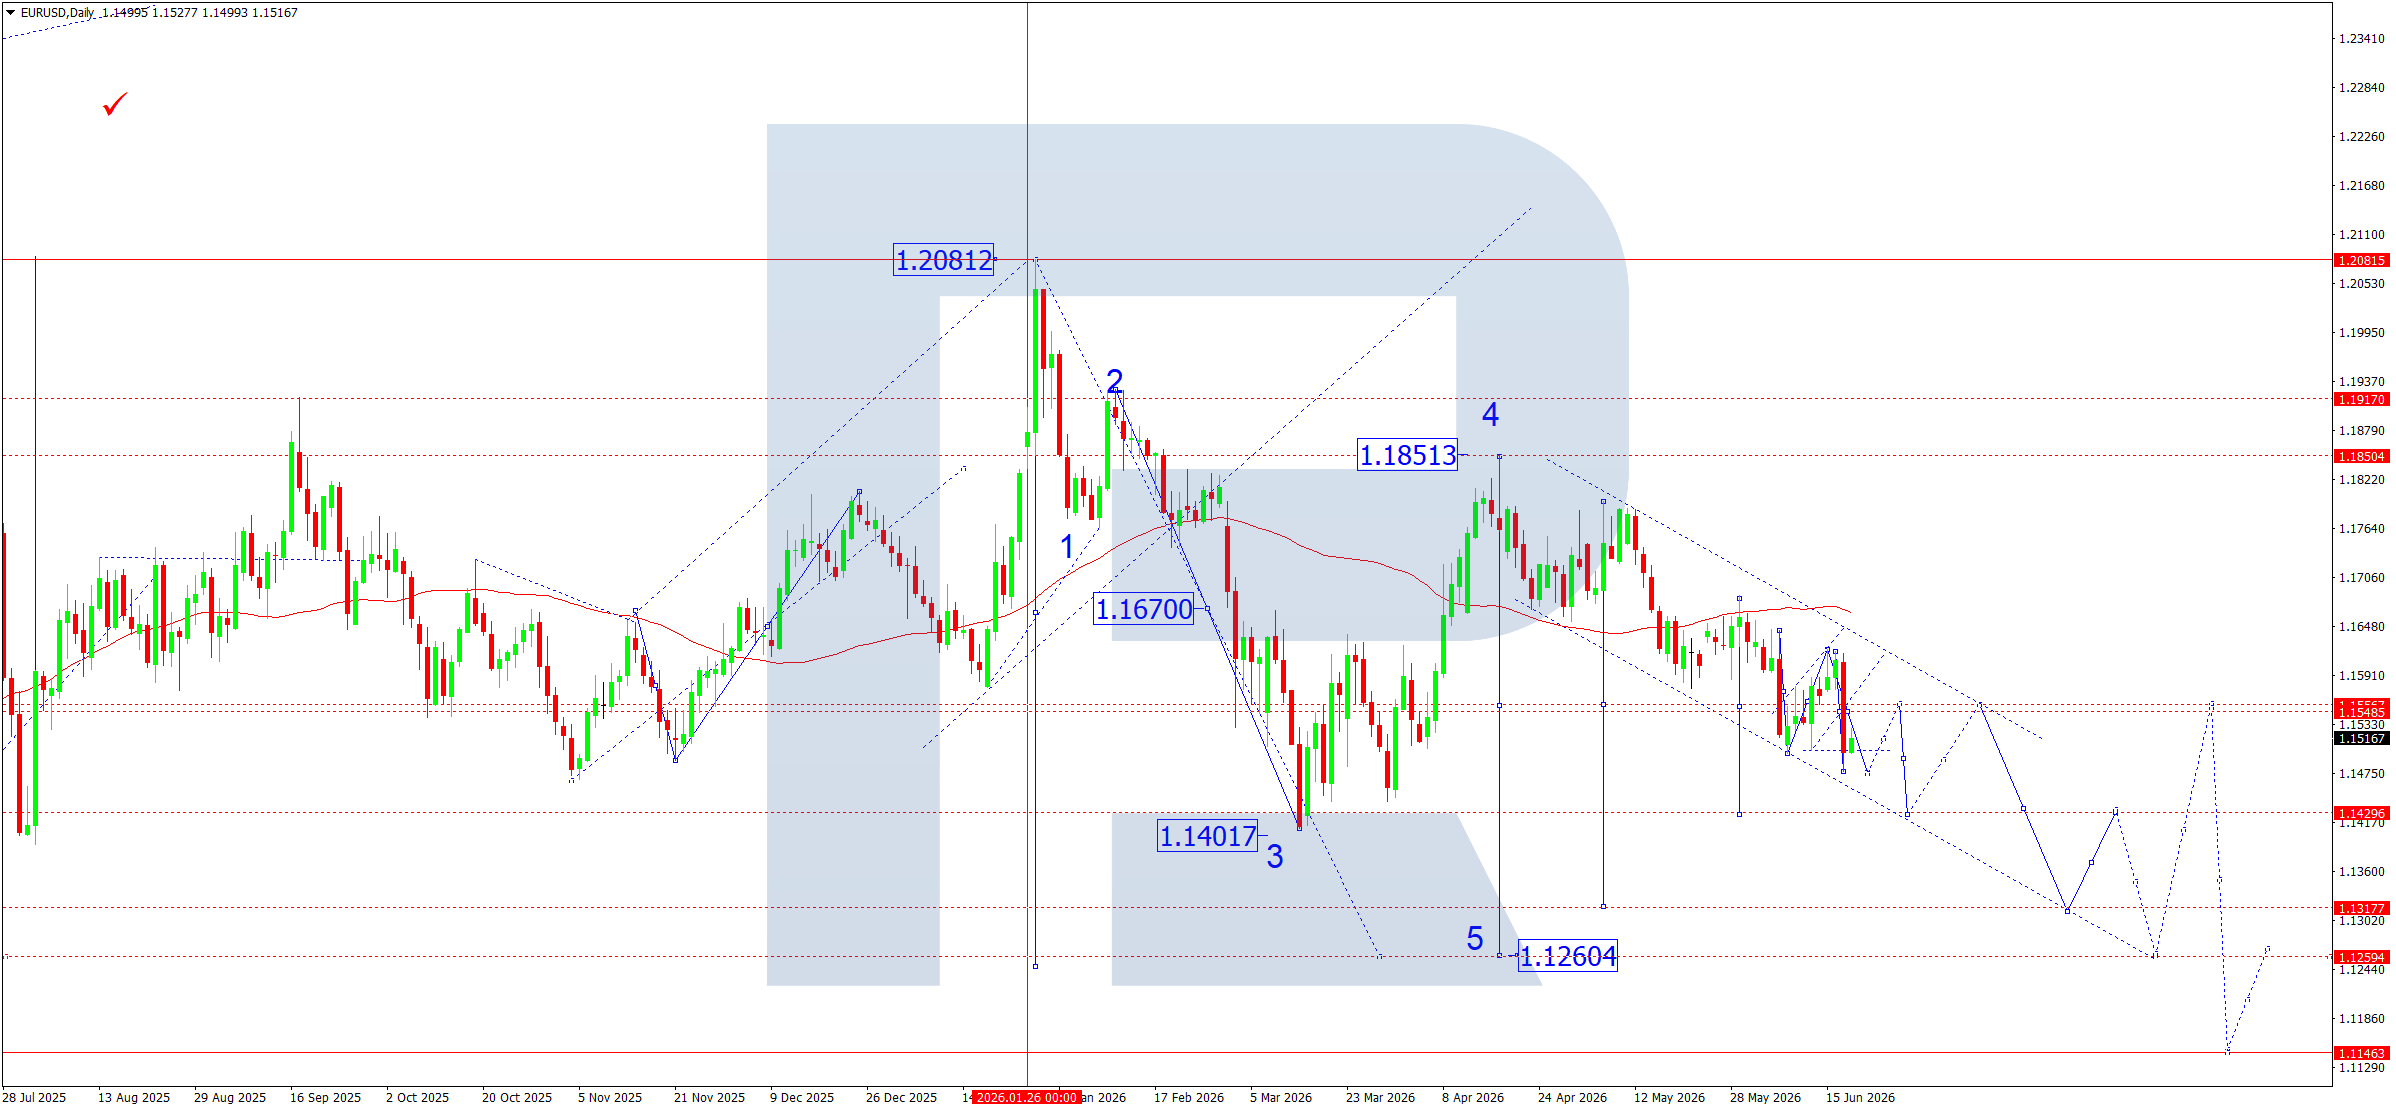
On the daily chart, EURUSD maintains a medium-term downtrend after forming a peak near 1.2081. The wave structure indicates the completion of a large corrective pattern through the highs at 1.2081 and 1.1851, followed by the development of a new downward phase.
After reaching a low of 1.1402, the market formed a corrective recovery as part of wave 4, which ended near 1.1851. The fifth downward wave then began developing, with the main target located around 1.1260. This level is marked on the chart as the key strategic target of the current bearish cycle.
At present, the price is trading below the descending channel and remains under the resistance zone at 1.1549–1.1555. The moving average is also positioned above the market, confirming seller dominance. Attempts to recover over recent weeks have remained capped by the upper boundary of the descending channel.
The nearest target for sellers is the support level at 1.1430. A break below it will open the way towards the next important target at 1.1318, after which the market may test the strategic level at 1.1260. This area represents the projected target of the fifth downward wave.
To invalidate the current bearish scenario, buyers must secure a position above 1.1549 and break out of the descending channel. In this case, the probability of a deeper correction towards 1.1670 and then 1.1851 will increase.
EURUSD forecast scenarios
Bearish scenario (base case): the market failed to establish itself above 1.1549. Further decline is expected towards 1.1430, followed by movement to 1.1318. The main target of the current wave remains at 1.1260.
Bullish scenario (alternative): if the price secures a position above 1.1549 and breaks above the upper boundary of the descending channel, growth towards 1.1670 and a deeper correction towards 1.1851 may follow.
USDJPY forecast
Next week, USDJPY remains in focus following the decisions of the Federal Reserve (Fed) and the Bank of Japan (BoJ). The US regulator left interest rates unchanged but signalled that inflation risks remain elevated and that the probability of another rate increase before year-end has increased noticeably. The US dollar also continues to benefit from resilient US macroeconomic data and rising Treasury yields.
The situation in Japan appears more complex. At its latest meeting, the Bank of Japan (BoJ) raised its policy rate to 1.0%, the highest level in decades, and indicated that further tightening may follow if inflationary pressures persist. However, this step has not fundamentally altered the balance of power in the currency market, as the yield differential between US and Japanese assets remains substantial. Additional uncertainty stems from statements by Japanese officials expressing readiness to intervene should the yen weaken excessively. As the pair approaches the 160.10–162.00 area, the market has once again begun discussing the possibility of currency intervention by Japan’s Ministry of Finance.
USDJPY technical analysis
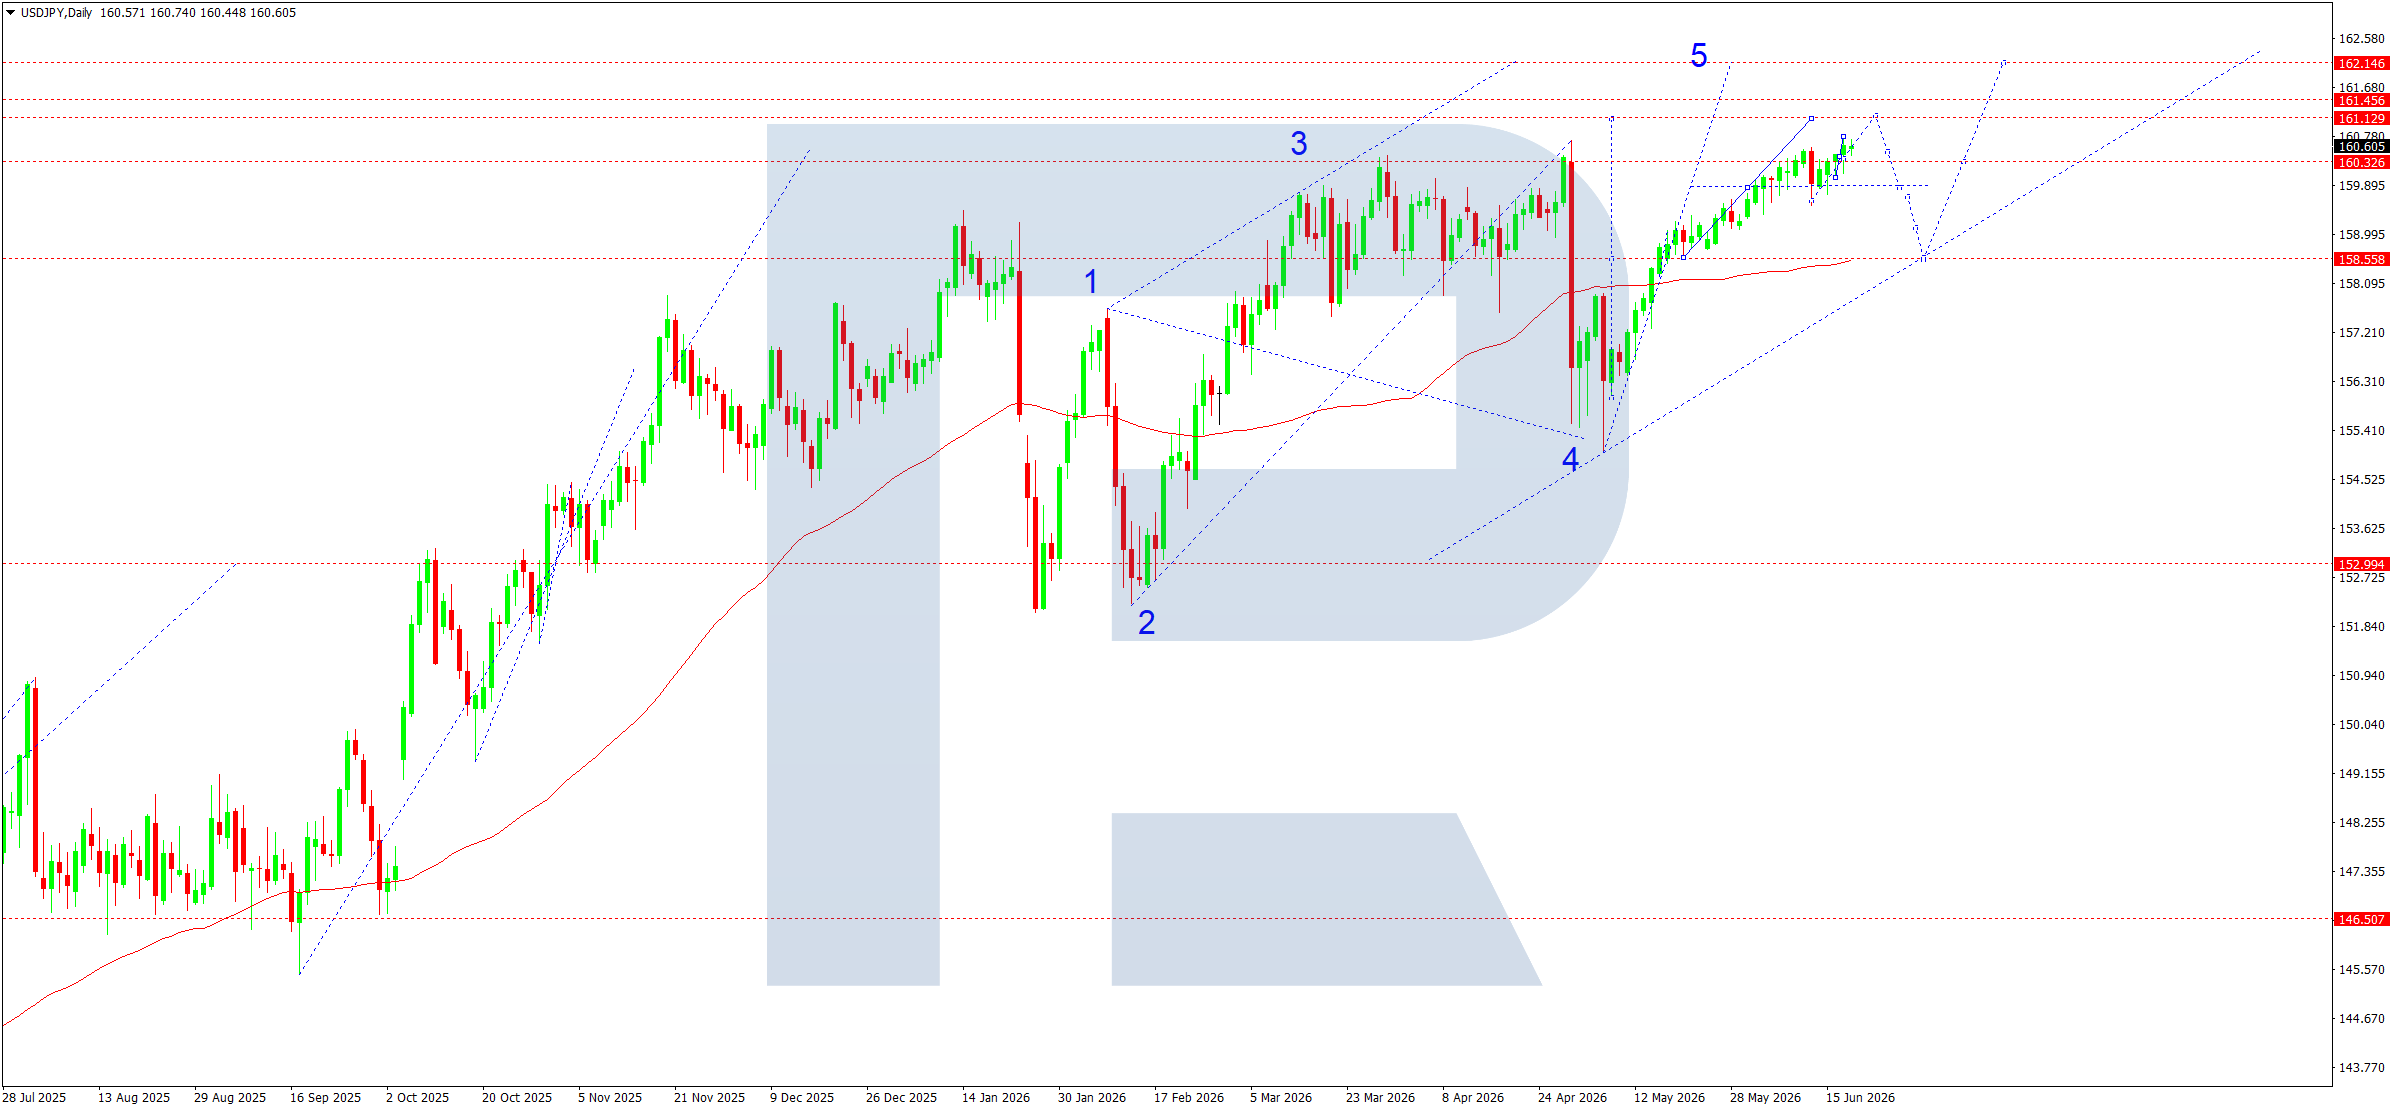
After forming wave 4 near 155.40, the market continued developing wave 5. The price remains within the ascending channel and trades above the long-term moving average, confirming buyer dominance.
One of the most important developments in recent weeks was the decisive breakout above 158.55, which had previously acted as major resistance. This level now serves as medium-term support. Within the current wave structure, a local upward impulse is developing with an intermediate target at 161.30. This level represents the nearest objective for buyers and coincides with the upper boundary of the local structure.
If the current upward movement continues, the market may test resistance at 161.45, after which the primary target of wave 5 will be the 162.15–162.20 area. This zone corresponds to the upper boundary of the long-term ascending channel and may mark the completion of the current impulsive cycle.
The alternative scenario assumes the formation of a corrective phase after testing the 160.60–161.30 zone. In this case, a retreat towards support at 159.90 and even a deeper decline to 158.55 becomes possible, where a significant buyer equilibrium level is located.
USDJPY forecast scenarios
Bullish scenario (base case): holding above 160.60 will preserve the potential for growth towards 161.30, followed by the continuation of wave 5 towards 161.45 and 162.15.
Bearish scenario (alternative): a break below 159.90 may trigger a correction towards 158.55 and temporarily weaken the upward impulse.
GBPUSD forecast
During the past week, the British pound remained under pressure against the US dollar. The main market driver was the outcome of the Federal Reserve and Bank of England meetings. The Federal Reserve (Fed) left interest rates unchanged, but its rhetoric remained hawkish. Several FOMC members continue to allow for a rate increase before the end of the year amid persistent inflation risks in the US economy. Strong consumer demand data and the resilience of the US labour market provided additional support to the US dollar.
The Bank of England (BoE) also kept rates unchanged at 3.7500%; however, the decision was accompanied by cautious comments regarding the future path of monetary policy. Seven committee members voted to keep rates unchanged, while two supported a rate increase. Despite slowing economic growth in the UK, policymakers continue to highlight the risk of inflation remaining above target. The British currency reacted negatively to the divergence in expectations between the Fed and the BoE, leading to fresh local lows in GBPUSD.
GBPUSD technical analysis
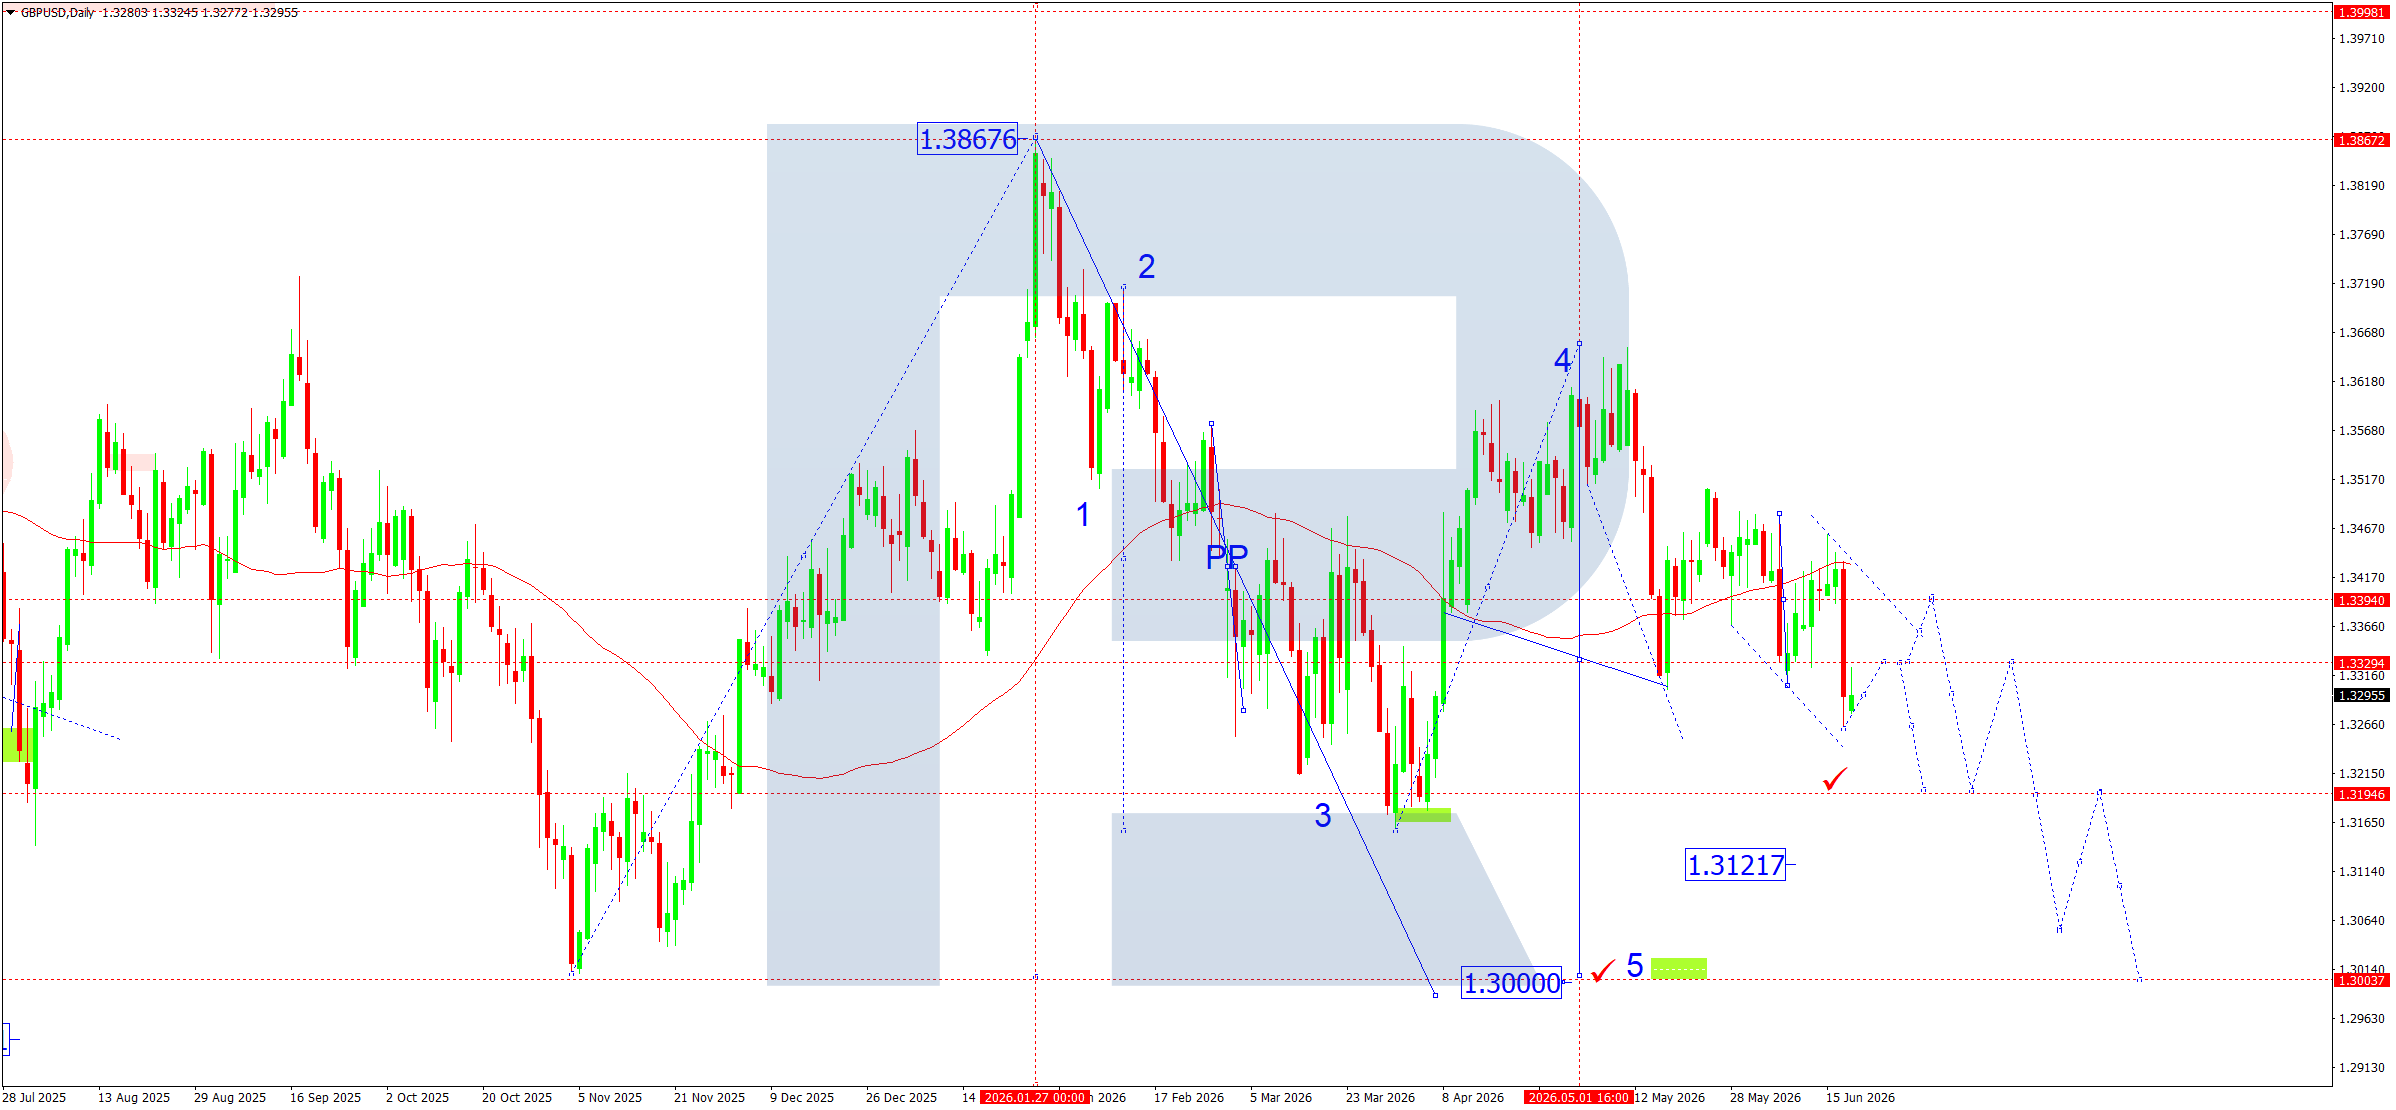
From a technical perspective, the pair continues to develop a medium-term bearish structure following the completion of a wave pattern near 1.3867. The daily chart maintains a sequence of lower highs and lower lows, confirming the dominance of the bearish trend. Near the PP pivot point, the market attempted to form a corrective recovery several times, but each rally attracted renewed selling pressure.
After completing wave 4 in the 1.3620–1.3640 area, prices resumed their decline. The current structure points to the development of the final wave 5, with the main target located near 1.3000. An additional intermediate target is support at 1.3122, highlighted on the chart as a local support zone. While the price remains below the 1.3390–1.3410 resistance area and below the long-term moving average, the risks of further downside remain intact.
Technically, the market continues to form a descending channel. Any corrective rallies towards 1.3330–1.3390 may be viewed as opportunities to resume selling in line with the primary trend. Only a confident recovery above 1.3410 and sustained trading above this area would ease pressure on the pound and open the way for a deeper correction.
GBPUSD forecast scenarios
Bearish scenario (base case): PP at 1.3330. A decline from 1.3390 is expected to continue towards 1.3122 and then to the main target at 1.3000.
Bullish scenario (alternative): if the market secures a position above 1.3410, a corrective recovery towards 1.3520 may develop.
AUDUSD forecast
During the past week, the Australian dollar remained under pressure following the release of weak Australian economic growth data and cautious comments from the Reserve Bank of Australia (RBA). The regulator kept the interest rate unchanged at 4.3500% but indicated that the fight against inflation is not yet over. Despite slower economic growth and rising unemployment, inflation risks remain elevated, preventing the market from expecting a rapid easing of monetary policy.
An additional factor affecting the AUD is expectations regarding the US Federal Reserve's (Fed) policy. The US regulator continues to maintain a hawkish stance amid a resilient labour market and persistent inflation risks. This supports the US dollar and limits the upside potential of AUDUSD. At the same time, easing tensions in the Middle East and a correction in oil prices have slightly improved global risk appetite, helping the Australian currency avoid a deeper decline.
AUDUSD technical analysis
The fundamental backdrop for the coming week suggests that market participants will closely monitor US economic data, as well as new comments from Fed and RBA officials. Data from China, Australia's largest trading partner, will also continue to influence the Australian dollar.
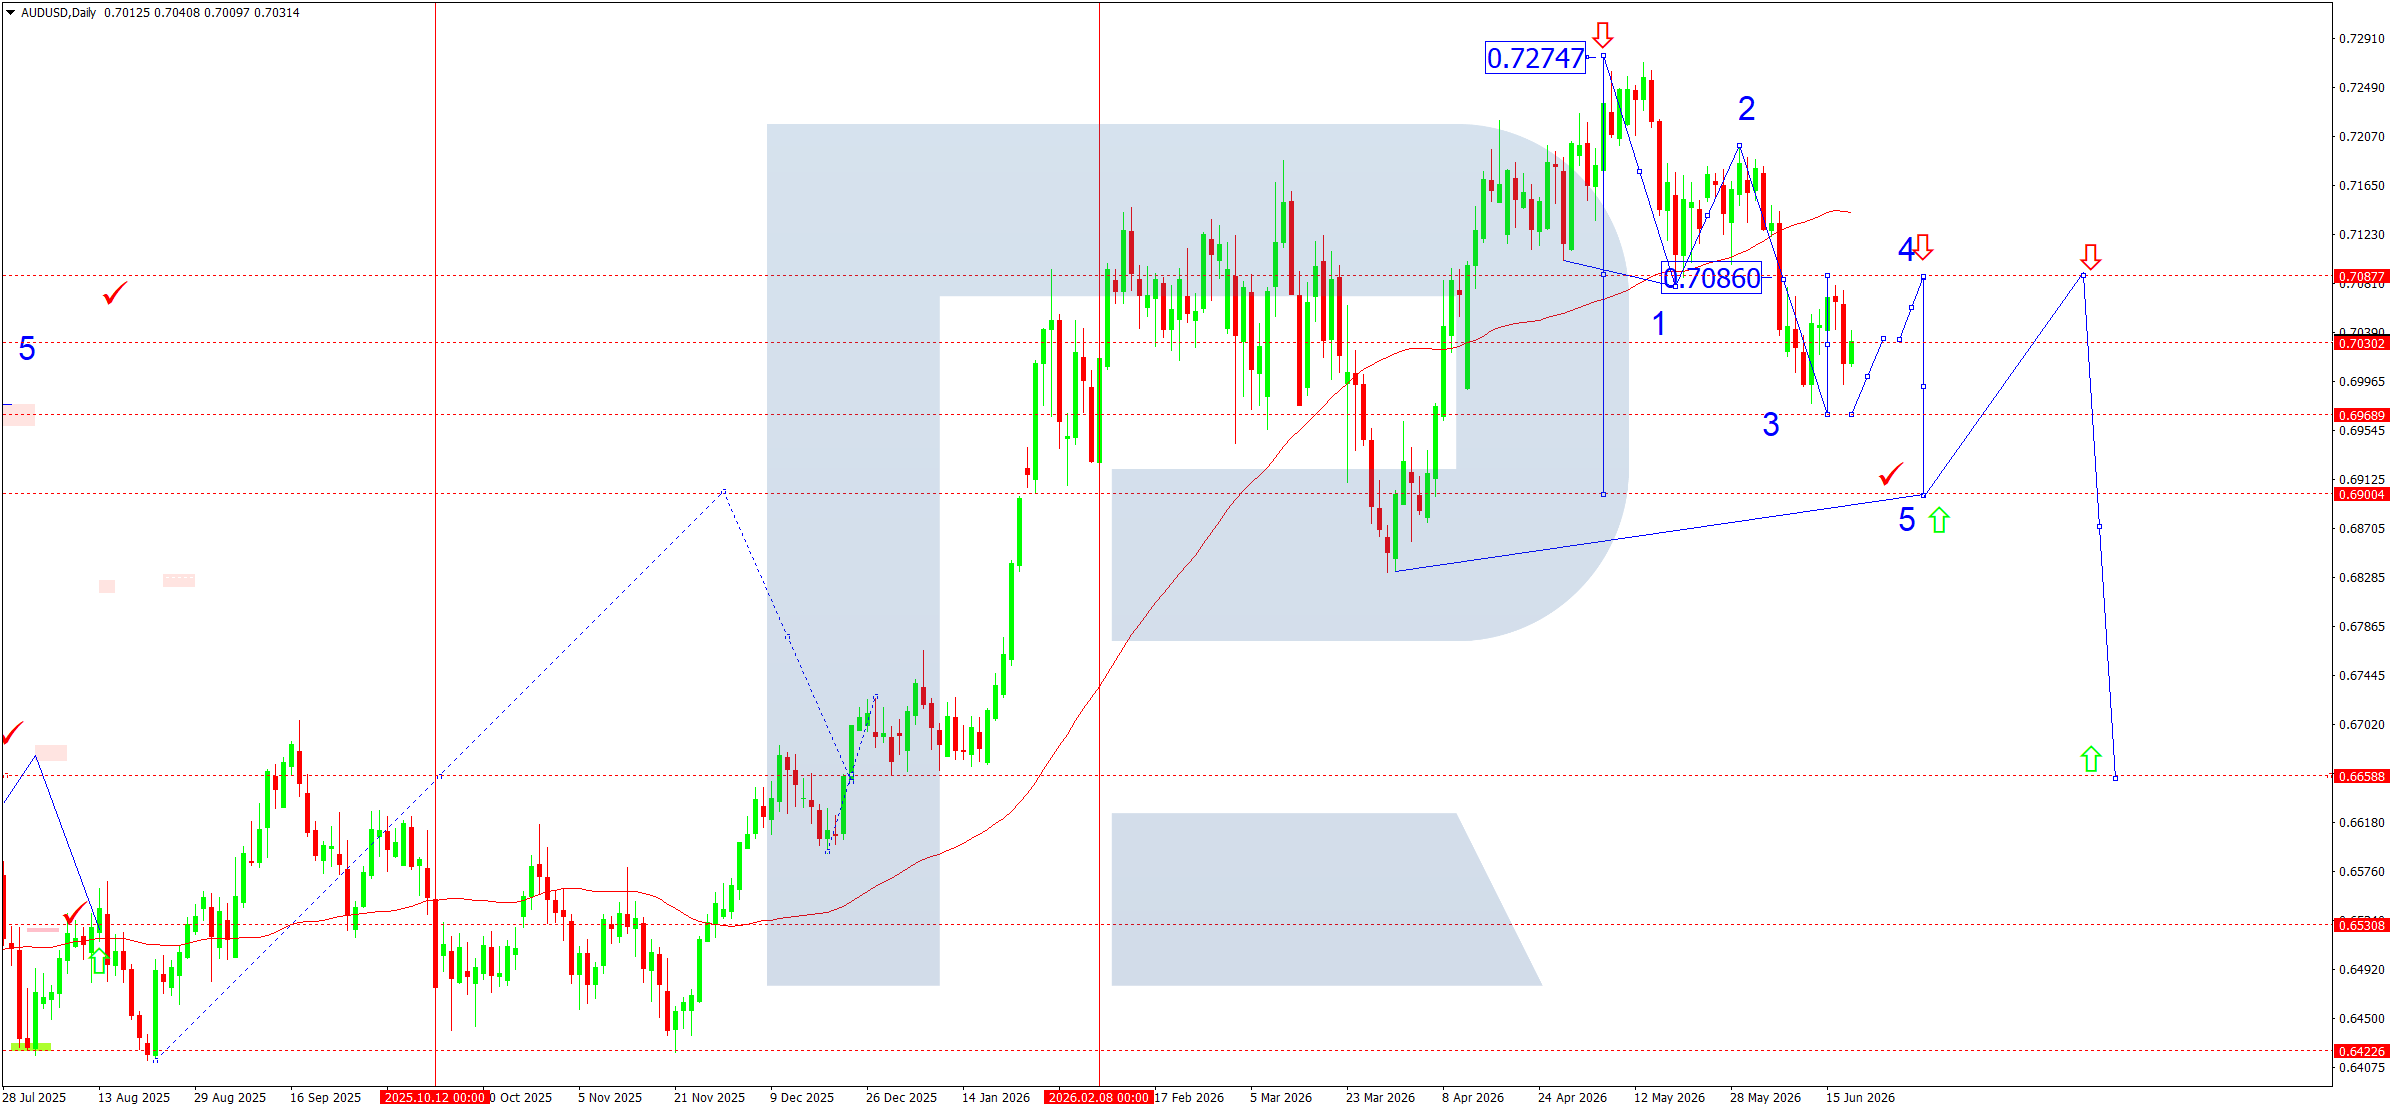
From a technical perspective, the daily chart continues to show the development of a medium-term corrective downward structure following the completion of the previous upward impulse near 0.7275. The market previously formed a peak and entered a declining phase, breaking below support in the 0.7086 area. At present, this level serves as the key pivot point for further price action.
After forming a local downward wave, the price reached the 0.6969 area, where an attempt at stabilisation and the development of a corrective rebound can be observed. According to the current wave structure, the market is forming corrective wave 4 with the potential to return to the 0.7086 zone. However, while the price remains below this resistance level, sellers continue to retain the overall advantage.
The primary downward channel remains intact. If the corrective growth phase concludes near 0.7086, a new impulsive downward wave towards 0.6900 may develop. This level coincides with support from the ascending trendline formed during April and May. A breakout below it would open the way for a deeper correction towards 0.6659.
AUDUSD forecast scenarios
Bearish scenario (base case): a reversal point has formed at 0.7086. A downward wave structure is developing in line with the trend towards 0.6969, with the prospect of continuing towards 0.6900. If 0.6900 is broken, the downward impulse may extend towards 0.6659.
Bullish scenario (alternative): if the market consolidates above 0.7086, the probability of a corrective rise towards 0.7165-0.7200 will increase, followed by a retest of the June highs.
USDCAD forecast
By the end of the week, the USDCAD pair continues to maintain a strong upward impulse, remaining under the influence of several fundamental factors. The main market driver was the US Federal Reserve's decision to keep interest rates unchanged. However, the accompanying comments were significantly more hawkish than the market had expected. Fed officials highlighted persistent inflation risks and left open the possibility of further monetary tightening before the end of the year. This led to higher US Treasury yields and a stronger US dollar.
Additional pressure on the Canadian dollar came from declining oil prices. Following the easing of geopolitical tensions in the Middle East, market participants reassessed the risks of supply disruptions, triggering a correction in oil prices. Since the Canadian economy is closely linked to energy exports, lower oil prices negatively affect the Canadian currency.
Meanwhile, the Bank of Canada (BoC) kept its key interest rate unchanged at 2.2500% at its latest meeting, confirming a cautious approach to future decisions. The regulator noted slower economic activity and signs of weakening domestic demand. The divergence in monetary policy expectations between the Fed and the BoC continues to widen in favour of the US dollar, supporting the medium-term upward trend in USDCAD.
USDCAD technical analysis
From a technical perspective, the market continues to develop a bullish structure after forming a long-term low near 1.3490. The completion of downward wave 5 created a reversal pattern, after which the price formed impulsive wave 1 and corrective wave 2. The third upward wave is currently developing, which is traditionally considered the strongest and longest wave in the Elliott Wave structure.
A key signal supporting further upward movement was the confident breakout above the 1.4040 level, which previously acted as an important pivot point. The price has also consolidated above the ascending channel and remains above the long-term moving average, confirming buyer dominance.
According to the wave count, the nearest primary target is the 1.4366 area, where the projected peak of the third wave is located. After reaching this target, the market may enter corrective wave 4 with a pullback towards 1.3959. The completion of this correction could open the way for the development of the final fifth wave, with a potential target at 1.4540.
USDCAD forecast scenarios
Bullish (base case): holding above 1.4040 will confirm the continuation of the upward trend, with subsequent growth towards 1.4366 and then 1.4540 after a correction.
Bearish (alternative): a break below 1.3959 will signal a deeper correction and create risks of a decline towards 1.3730.
XAUUSD forecast
On the precious metals market, the past week unfolded under the influence of the US Federal Reserve’s (Fed) policy decisions and changing expectations regarding future monetary policy. The Fed left interest rates unchanged; however, its rhetoric proved significantly more hawkish than the market had anticipated. Some Fed officials signalled the possibility of an additional rate hike before year-end, which strengthened the US dollar and pushed US Treasury yields higher. Against this backdrop, gold came under pressure, as higher interest rates reduce the appeal of non-yielding assets.
An additional source of pressure came from easing geopolitical tensions in the Middle East and a correction in oil prices following the stabilisation of the energy supply situation. As a result, some investors reduced their safe-haven positions in gold. At the same time, persistent US inflation and ongoing gold purchases by central banks around the world continue to limit the scale of the decline and support long-term demand for the precious metal. During the coming week, market participants will closely monitor US macroeconomic data releases and comments from Fed officials regarding the future path of interest rates.
XAUUSD technical analysis
From a technical perspective, XAUUSD maintains a medium-term bearish structure after forming an all-time high near 5,590. On the daily chart, the development of a five-wave Elliott corrective pattern continues. The market is currently completing the formation of the fifth downward wave within the main descending channel.
The Pivot Point level around 4,758 remains the key reference point for the market. After an unsuccessful attempt to establish itself above this area, sellers retained full control of the price movement. The price remains below the long-term moving average, confirming the dominance of bearish sentiment.
Over recent weeks, quotations have consistently formed lower highs and lower lows. The current decline is developing towards the projected completion zone of the fifth wave, located near 3,923. This area serves as the primary target of the current bearish impulse. After reaching it, the market may form a deeper correction towards 4,395 and above.
From a wave structure perspective, the current consolidation near 4,200 appears to be an intermediate pause before the completion of the downward cycle. As long as the price remains below the 4,395 resistance level, the scenario of further decline retains priority.
XAUUSD forecast scenarios
Bearish (base case): consolidation forms near the 4,204 level, followed by the development of the final downward wave towards 4,024 and then the main target at 3,923.
Bullish (alternative): if the price secures a confident breakout above 4,395, a corrective rise towards 4,758 may develop, followed by a test of the upper boundary of the descending channel.
Brent forecast
During the past week, the Brent oil market remained heavily influenced by geopolitical factors. The key event was the signing of an interim agreement between the US and Iran, which significantly reduced the risks of further escalation in the Middle East and led to a sharp decline in the geopolitical premium embedded in oil prices. Market participants began pricing in the gradual restoration of supplies through the Strait of Hormuz, which accounts for around one-fifth of global seaborne oil exports. At the same time, investors are assessing the potential return of additional volumes of Iranian oil to the market, which is adding pressure to prices.
Expectations of rising global supply are also acting as a source of pressure. International energy organisations and major investment banks note that, as oil transportation through the Strait of Hormuz normalises, the market will gradually move from a deficit towards a more balanced state. At the same time, the Organization of the Petroleum Exporting Countries (OPEC) maintains an optimistic outlook for global oil demand and expects further long-term growth.
Brent technical analysis
From a technical perspective, Brent has completed the formation of a major corrective structure after reaching a high near 114.08. On the daily chart, a completed five-wave decline from the peak of wave 4 to the fifth-wave low around 76.70 is clearly visible. This level serves both as the key local target of the bearish impulse and as an important support zone.
After reaching 76.70, the market began forming a corrective rebound. Within the wave structure, the first recovery target is located near 83.83, where an important resistance level and a previously established support zone are situated. If the market manages to secure itself above this level, prices may continue developing the corrective movement towards the PP Pivot Point area at 98.18–98.84.
The medium-term picture remains neutral-to-bearish for now. The price remains below the descending trendline drawn through the peak of wave 4, as well as below the key resistance range of 98.18–98.84. As long as this range holds back buyers, the probability of preserving the bearish structure remains high. However, the completion of the fifth wave at 76.70 increases the likelihood of a deeper correction towards the PP zone.
Brent forecast scenarios
Bullish scenario (main): after a corrective rise, the market may form a new bearish impulse. If the price fails to establish itself above 83.83, a return towards 76.70 is expected, with the risk of setting new local lows.
Bearish scenario (alternative): if Brent secures a confident breakout above 83.83, growth potential may emerge towards 92.83 and then into the Pivot Point area of 98.18–98.84.
BTCUSD forecast
Over the past week, Bitcoin was influenced by several fundamental factors at once. The main focus of the market was the US Federal Reserve (Fed) meeting, after which interest rates remained unchanged. However, the regulator’s rhetoric proved significantly more hawkish than market participants had expected. Fed officials indicated the possibility of further monetary tightening before the end of the year, which supported the US dollar and put pressure on the entire risk-asset sector, including cryptocurrencies.
Another factor remains the instability of capital flows into spot Bitcoin ETFs. Following substantial outflows at the end of May and the beginning of June, the market has gradually stabilised, although a sustained return of institutional demand has yet to emerge. At the same time, easing geopolitical tensions in the Middle East slightly improved overall risk appetite and allowed Bitcoin to hold above key support levels. As a result, the market entered a consolidation phase following the strong bearish impulse seen at the beginning of June.
BTCUSD technical analysis
From a technical perspective, BTCUSD continues to develop a corrective structure after completing its upward cycle near 83,544. The chart shows the formation of a five-wave decline pattern. The first wave established a low near 60,000, followed by corrective wave 2, which peaked at 81,976. The market then completed the strongest downward impulse within wave 3, reaching the target of 59,200.
At present, corrective wave 4 is developing. After rebounding from 59,200, buyers managed to push prices back above 64,000. However, the advance remains corrective in nature and is unfolding within a broader bearish structure. The key resistance zone remains the 69,900-70,900 area, which contains the pivot point of the current correction and several important levels associated with previous breakouts. As long as the price remains below this zone, the bearish scenario retains priority.
According to the wave structure, the completion of wave 4 may lead to the formation of the final wave 5. Its strategic target is located near 58,200. This level serves as the ultimate objective of the entire corrective pattern that began from the 83,544 peak. An additional argument in favour of this scenario is the continuation of the descending channel and the absence of a sustained breakout above the 70,000 area.
BTCUSD forecast scenarios
Bearish (base case): the market is forming a five-wave corrective structure from 83,544 to 58,200. At present, wave 1 = 60,000, wave 2 = 81,976, and wave 3 = 59,200. Further development of wave 4 towards 70,900 remains possible, followed by a decline within wave 5 towards the strategic target of 58,200.
Bullish (alternative): if buyers manage to establish a foothold above 71,000 and confirm the breakout with rising trading volumes, the market may gain potential for a move towards 81,900 and a retest of the upper boundary of the long-term range.
Editors’ picks
 EURUSD forecast 2026–2027: technical analysis, price levels & predictions
The ECB holds rates at 2.15% while the Fed stays at 3.75% — and that divergence is the central driver of EURUSD in 2026. The pair is range-bound between 1.1400 and 1.1915, with Deutsche Bank targeting 1.2500 and Morgan Stanley calling for 1.3000 by year-end. We analyse the technicals, break down the macro factors, and outline three trading scenarios with specific entry levels.
 Gold (XAUUSD) forecast 2026: predictions based on fundamental and technical analysis
Where is gold headed after pulling back from the all-time high of 5,597 USD? XAUUSD is consolidating near 4,518 USD between key levels 4,220 USD and 4,855 USD, with major banks targeting 5,243–6,200 USD by year-end. Read our comprehensive gold forecast: technical analysis across three timeframes, trading scenarios with specific entry levels, Fed policy and central bank demand outlook, and institutional predictions for 2026 and beyond.
Forecasts presented in this section only reflect the author’s private opinion and should not be considered as guidance for trading. RoboForex bears no responsibility for trading results based on trading recommendations described in these analytical reviews.