
Weekly technical analysis and forecast (6–10 July 2026)
In this weekly technical analysis, we examine the key chart patterns and price levels for EURUSD, USDJPY, GBPUSD, AUDUSD, USDCAD, Gold (XAUUSD), Brent crude oil, and Bitcoin (BTCUSD) to forecast market developments for the week ahead (6–10 July 2026).
Major technical levels to watch this week
- EURUSD: Support: 1.1259, 1.0956. Resistance: 1.1470, 1.1554
- USDJPY: Support: 160.98, 159.56. Resistance: 162.81, 164.25
- GBPUSD: Support: 1.3192, 1.3004. Resistance:1.3380, 1.3500
- AUDUSD: Support: 0.6780, 0.6569. Resistance: 0.6970, 0.7030.
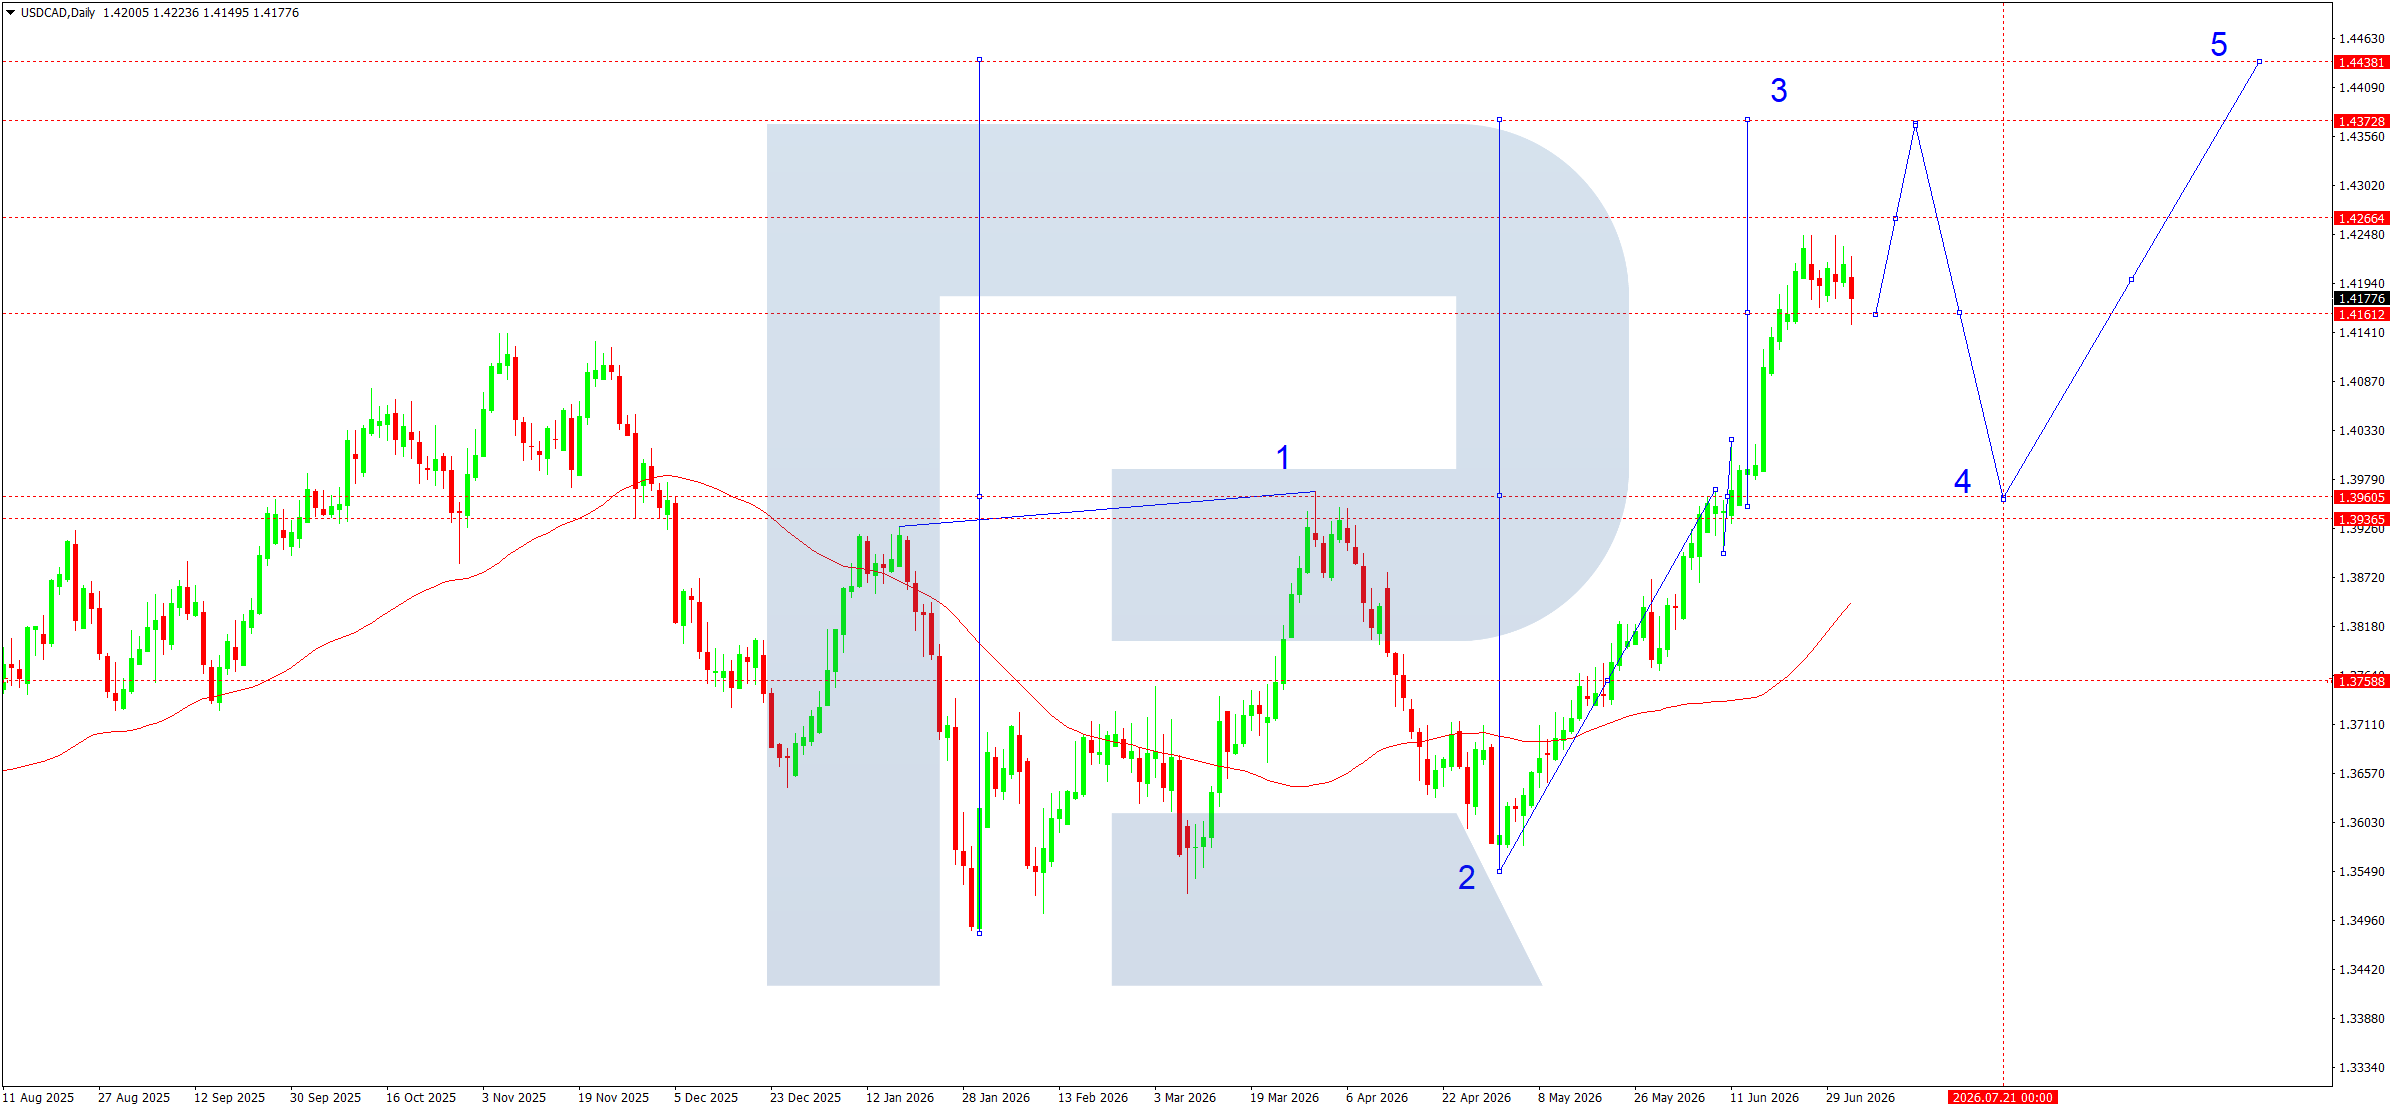
- USDCAD: Support: 1.3965, 1.3936. Resistance: 1.4373, 1.4438
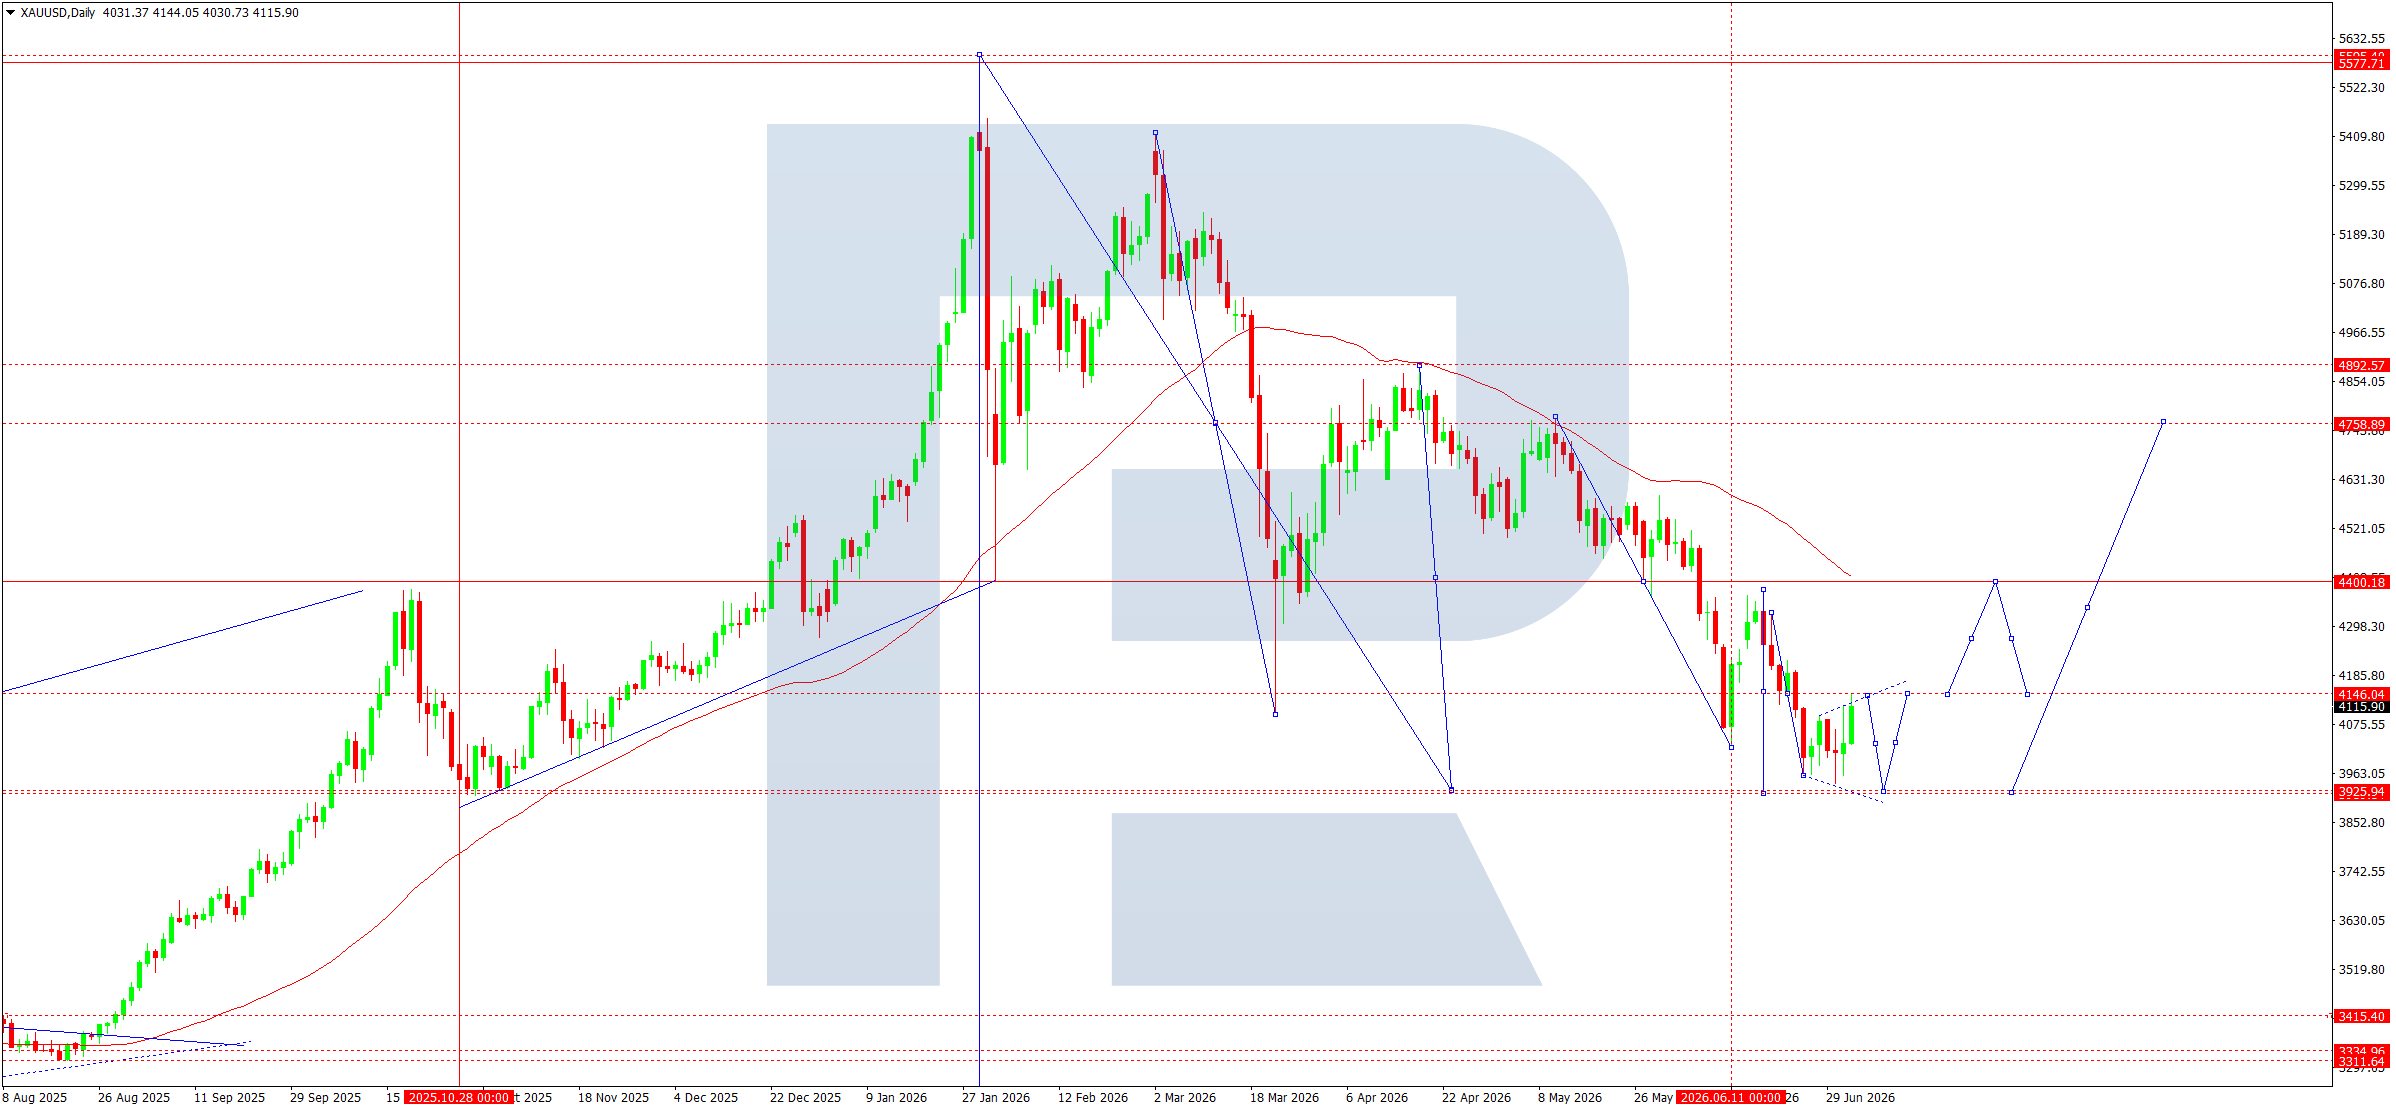
- Gold: Support: 3,925, 3,825. Resistance: 4,146, 4,400
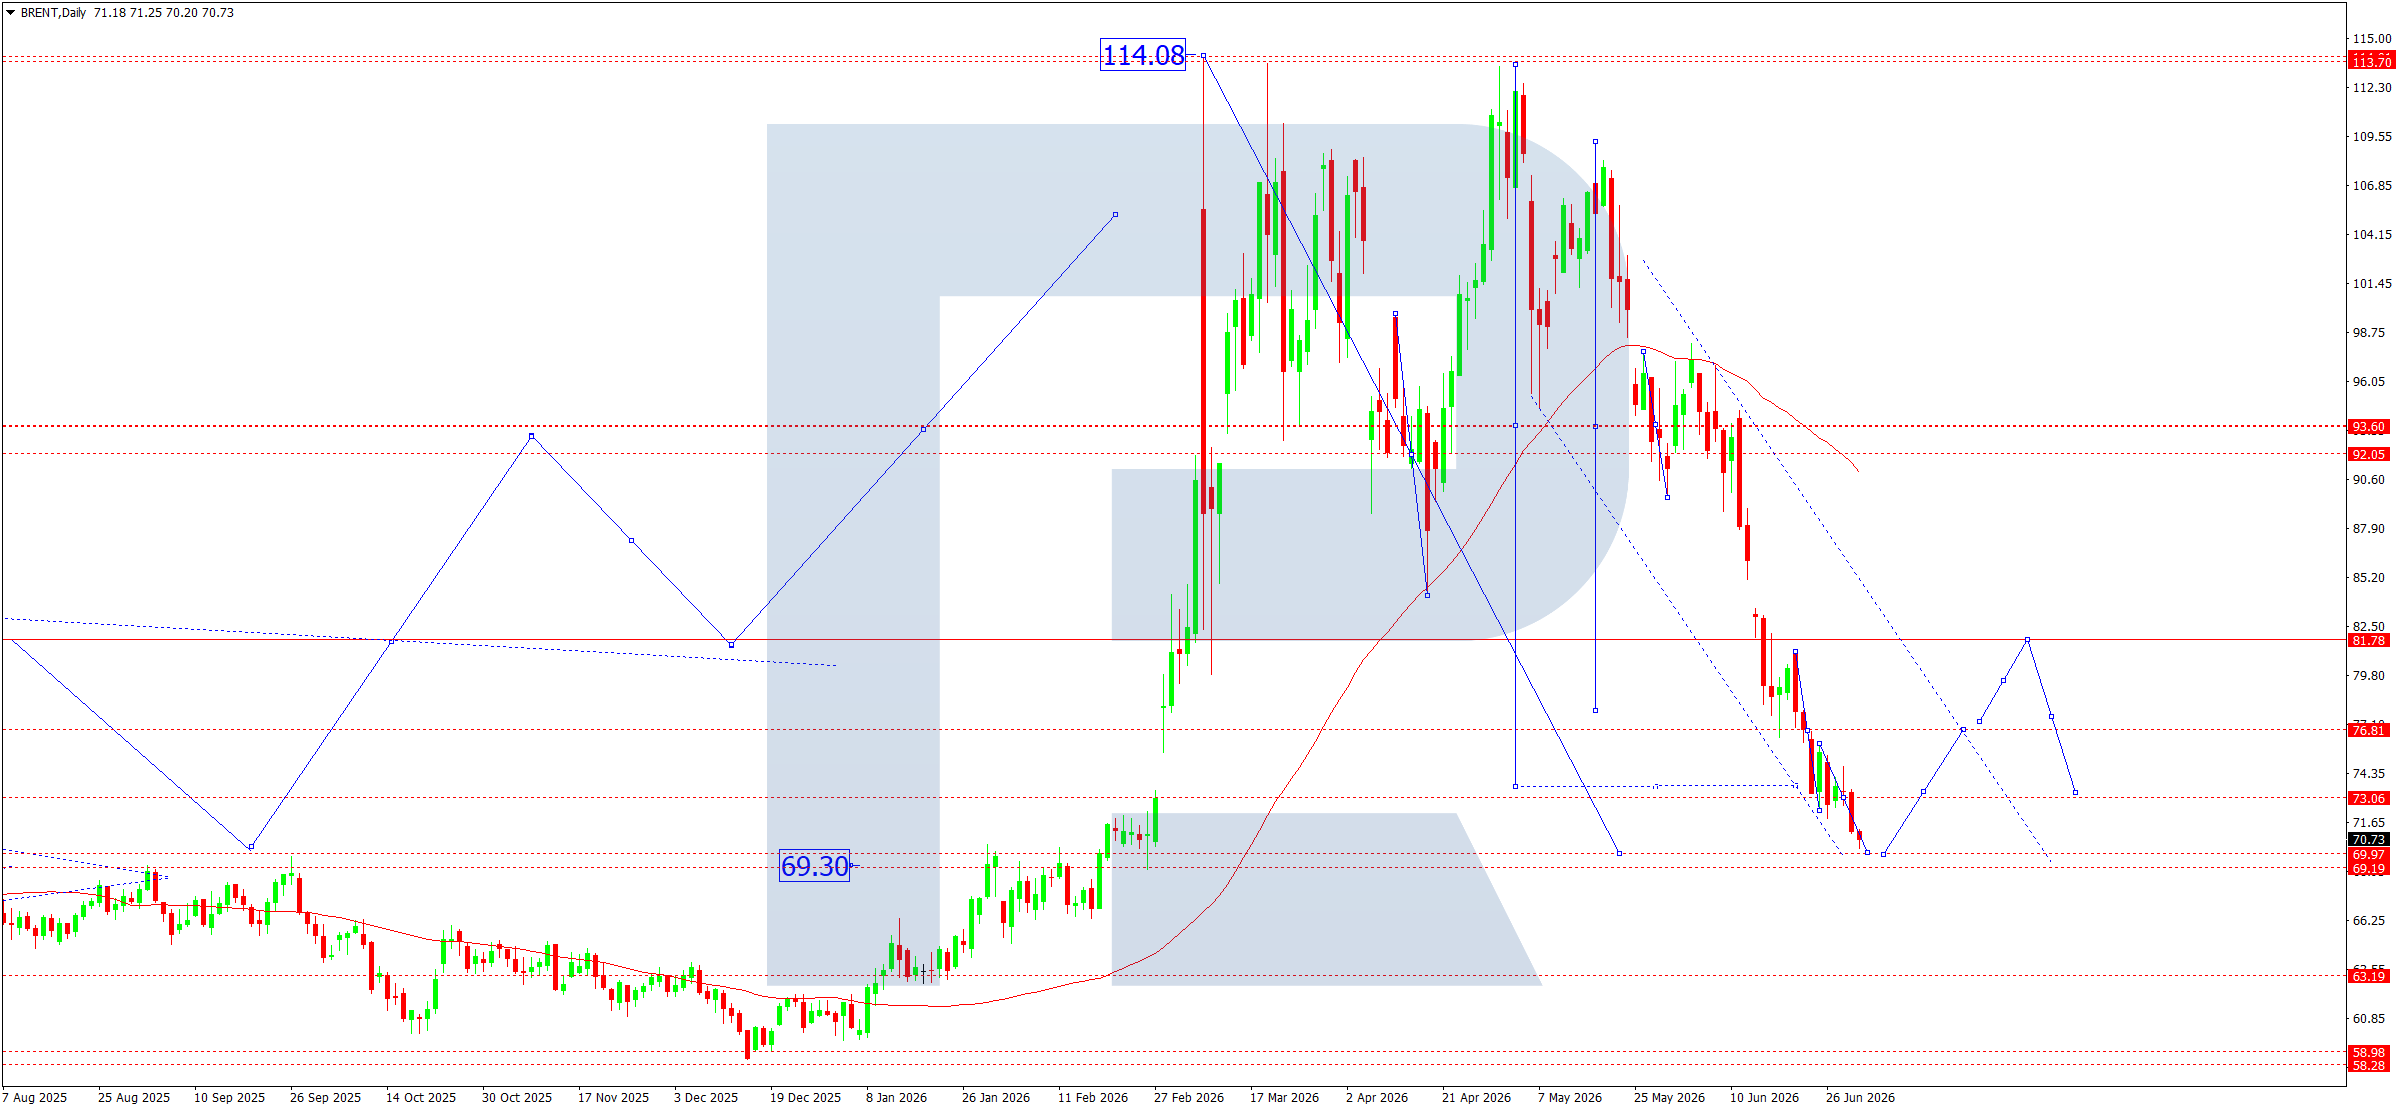
- Brent: Support: 69.96, 69.19. Resistance: 73.06, 76.81
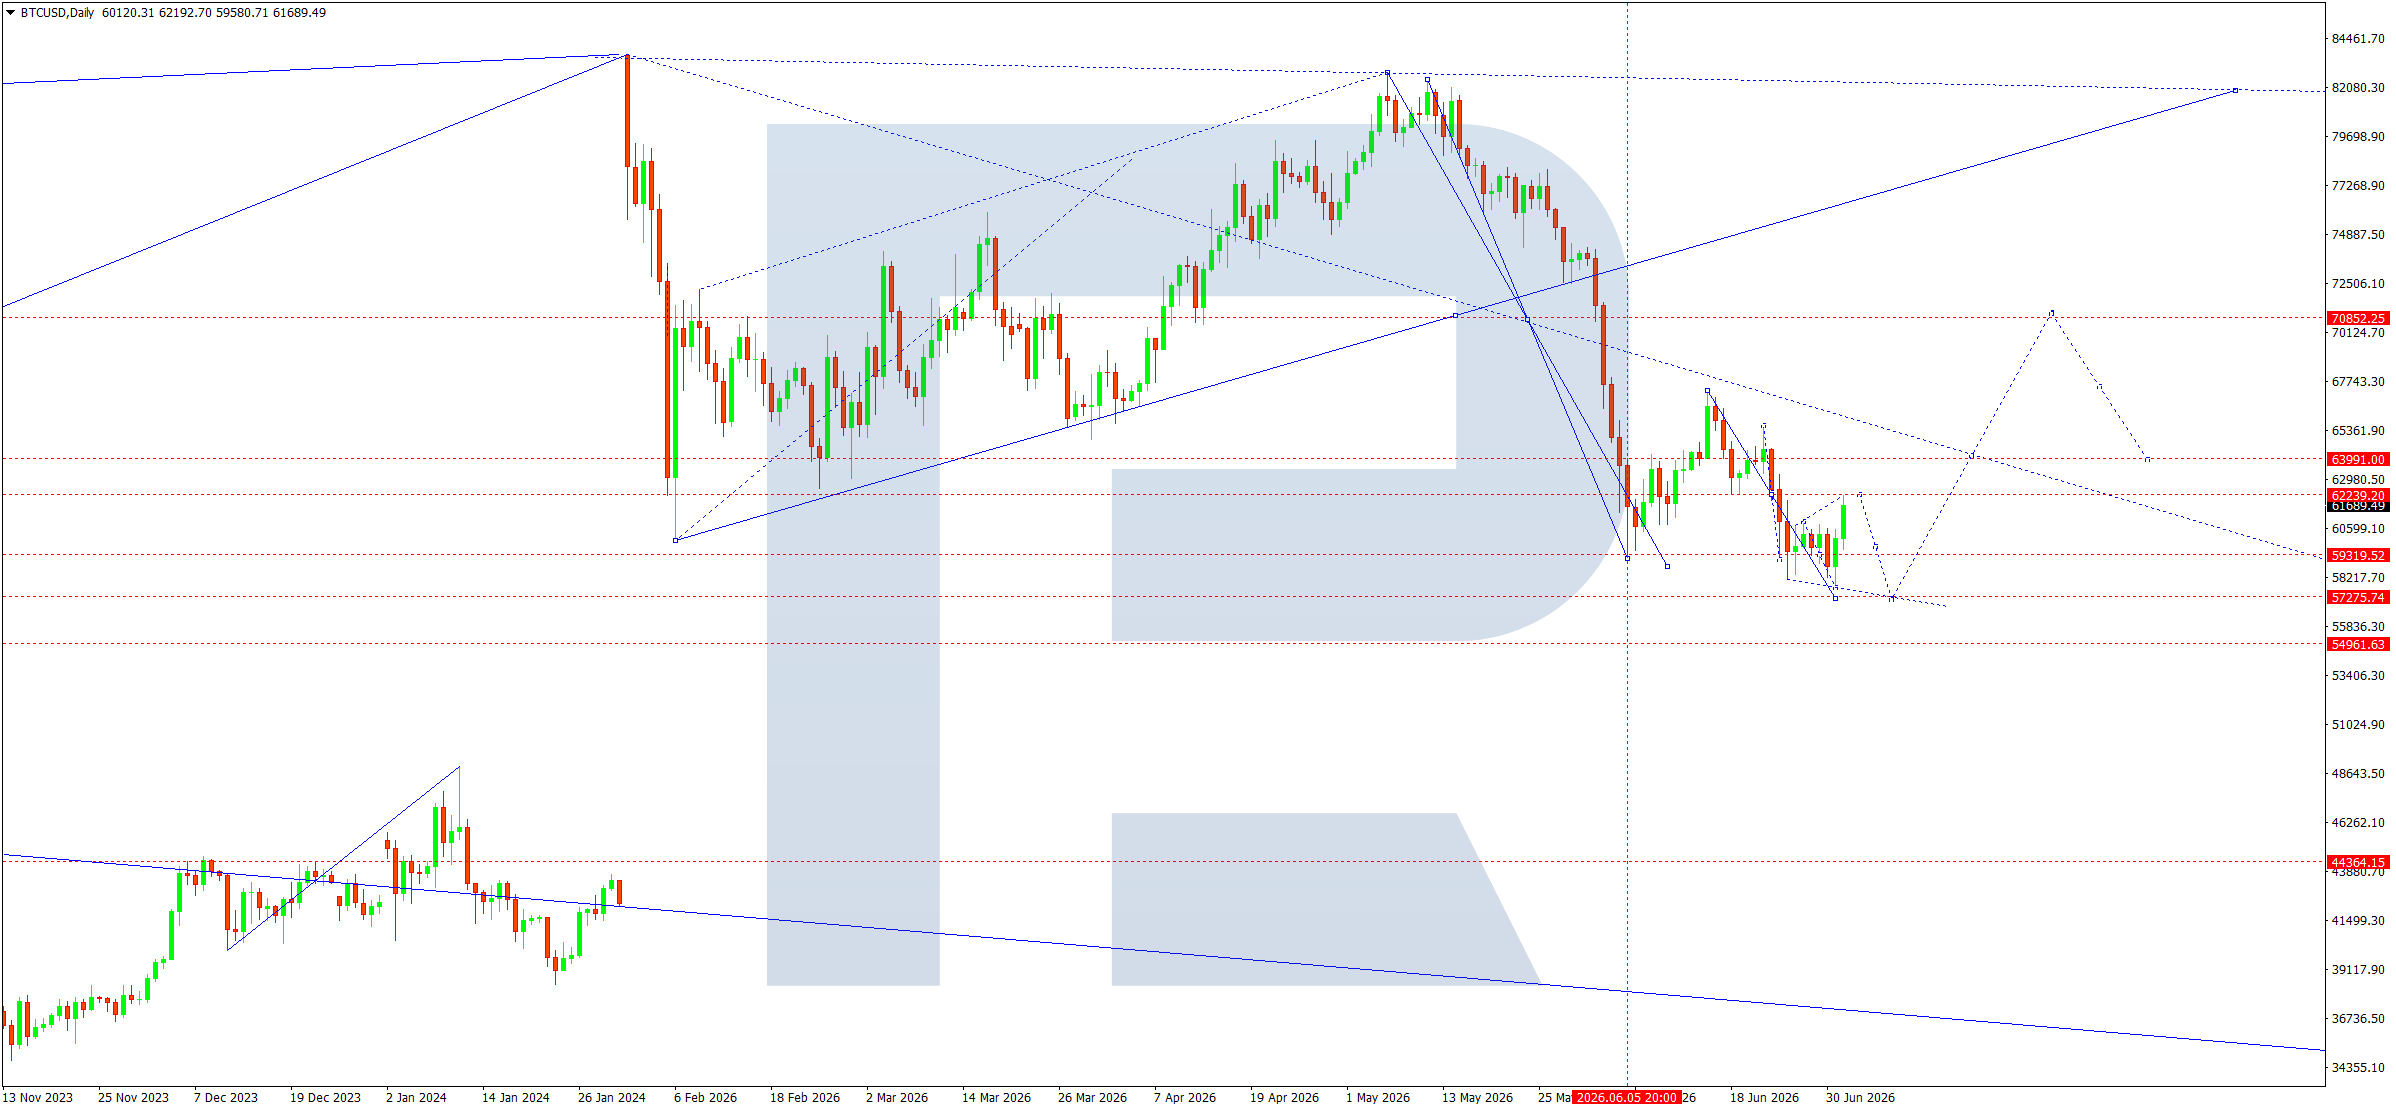
- BTCUSD: Support: 59,320; 57,275. Resistance: 62,240; 63,990
EURUSD forecast
The upcoming week for EURUSD will unfold under the influence of assessments of monetary policy prospects on both sides of the Atlantic. Investors will focus mainly on US labour market statistics, comments from central bank officials, and new macroeconomic data, which will shape expectations regarding regulators’ further actions. The latest data showed a notable slowdown in US employment growth, which somewhat weakened the dollar and reduced expectations of imminent policy tightening by the Fed. At the same time, the market continues to closely monitor inflation dynamics and the state of the US economy.
For the eurozone, European Central Bank policy remains the key factor. After the June interest rate increase, the regulator remains dependent on incoming economic data. Lower oil prices reduced inflationary pressure, so market participants expect a more cautious ECB approach at the upcoming meetings. Inflation releases and statements by the heads of the world’s largest central banks following the Sintra forum exert additional influence.
Thus, the fundamental backdrop remains mixed. On the one hand, weaker US statistics limit the dollar’s strengthening potential. On the other hand, the eurozone economy also shows signs of slowing, which still prevents the euro from shifting into a sustained advance.
EURUSD technical analysis
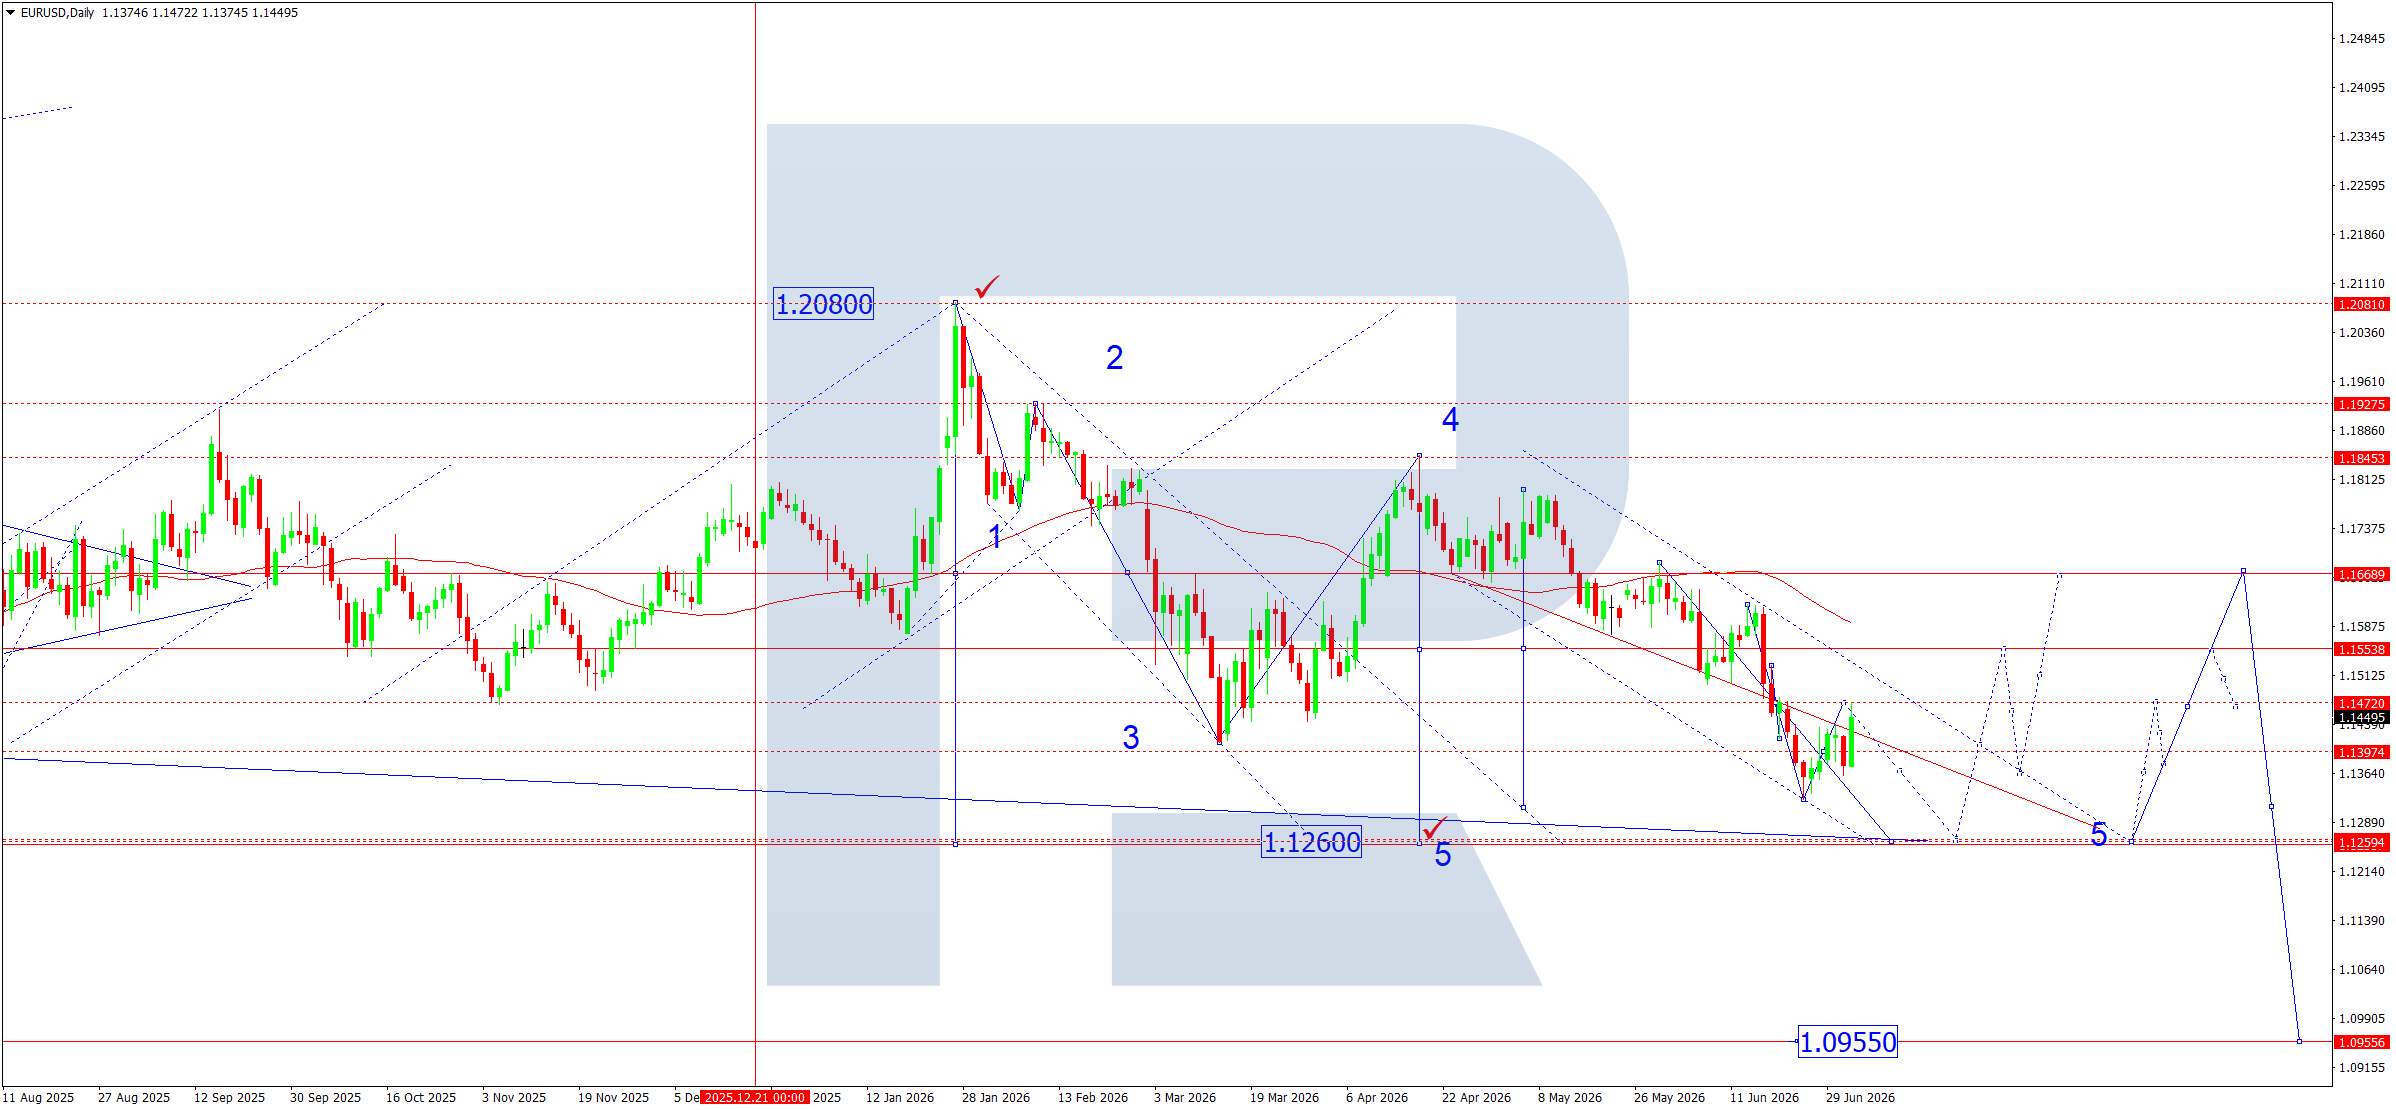
On the daily EURUSD chart, a stable downtrend remains in place, developing within a descending channel. The price continues to form a sequence of lower highs and lower lows, confirming sellers’ dominance.
According to the Elliott Wave structure, the market is in the final stage of forming the fifth downward wave. After the fourth corrective wave ended near the 1.1810 area, quotes resumed their decline. At present, the price is approaching the important 1.1259 support zone, which also coincides with the lower boundary of the long-term channel and the main target of the current impulse.
The medium-term SMA50 remains above the current price and continues to act as dynamic resistance. All attempts by buyers to consolidate above the average end with renewed selling, confirming that bears retain control of the market.
The nearest correction upwards may test the pivot area near 1.1470, but technical signs of a change in the global direction of movement remain absent. The chart shows that previous corrective waves remain limited by the upper boundary of the descending channel.
The sellers’ main technical target remains 1.1259. A confident breakout of this level will significantly strengthen the downward impulse and open the way towards the strategic target at 1.0956, marked on the long-term wave count. This level completes the current downward model and corresponds to the end of the higher-order fifth wave.
As long as the price remains below the 1.1470 area and below the SMA50, sellers retain full advantage, and any upward movements should be viewed as corrections within the continuing downtrend.
EURUSD forecast scenarios
Bearish (base case): after a possible correction towards the 1.1397–1.1470 area, the decline is expected to resume towards 1.1259. If this support is broken, the main target will be 1.0956.
Bullish (alternative): if buyers manage to consolidate above 1.1470 on rising volumes, a deeper correction may develop towards 1.1554 and then 1.1669.
USDJPY forecast
USDJPY is ending the week amid a notable increase in volatility. The key event for the currency market was the release of weaker-than-expected US labour market data. The number of new jobs came in significantly below forecasts, leading to a decline in US Treasury yields and a temporary weakening of the dollar. Market participants adjusted expectations regarding the Federal Reserve’s further actions, reducing the probability of another interest rate increase in the coming months.
Stronger demand for the Japanese yen after new signals of a potentially more active currency policy from the Japanese authorities became an additional factor. Representatives of Japan’s Ministry of Finance continue to signal readiness to intervene if the national currency weakens excessively. The market remains highly sensitive to any official comments, as the exchange rate has again approached levels that previously coincided with currency interventions.
In the upcoming week, investors will focus on the publication of the minutes from the latest Fed meeting, as well as new macroeconomic data from the US and Japan. If US statistics continue to point to an economic slowdown, pressure on the dollar may increase. At the same time, any hints from the Bank of Japan about further monetary policy normalisation could support yen strength.
USDJPY technical analysis
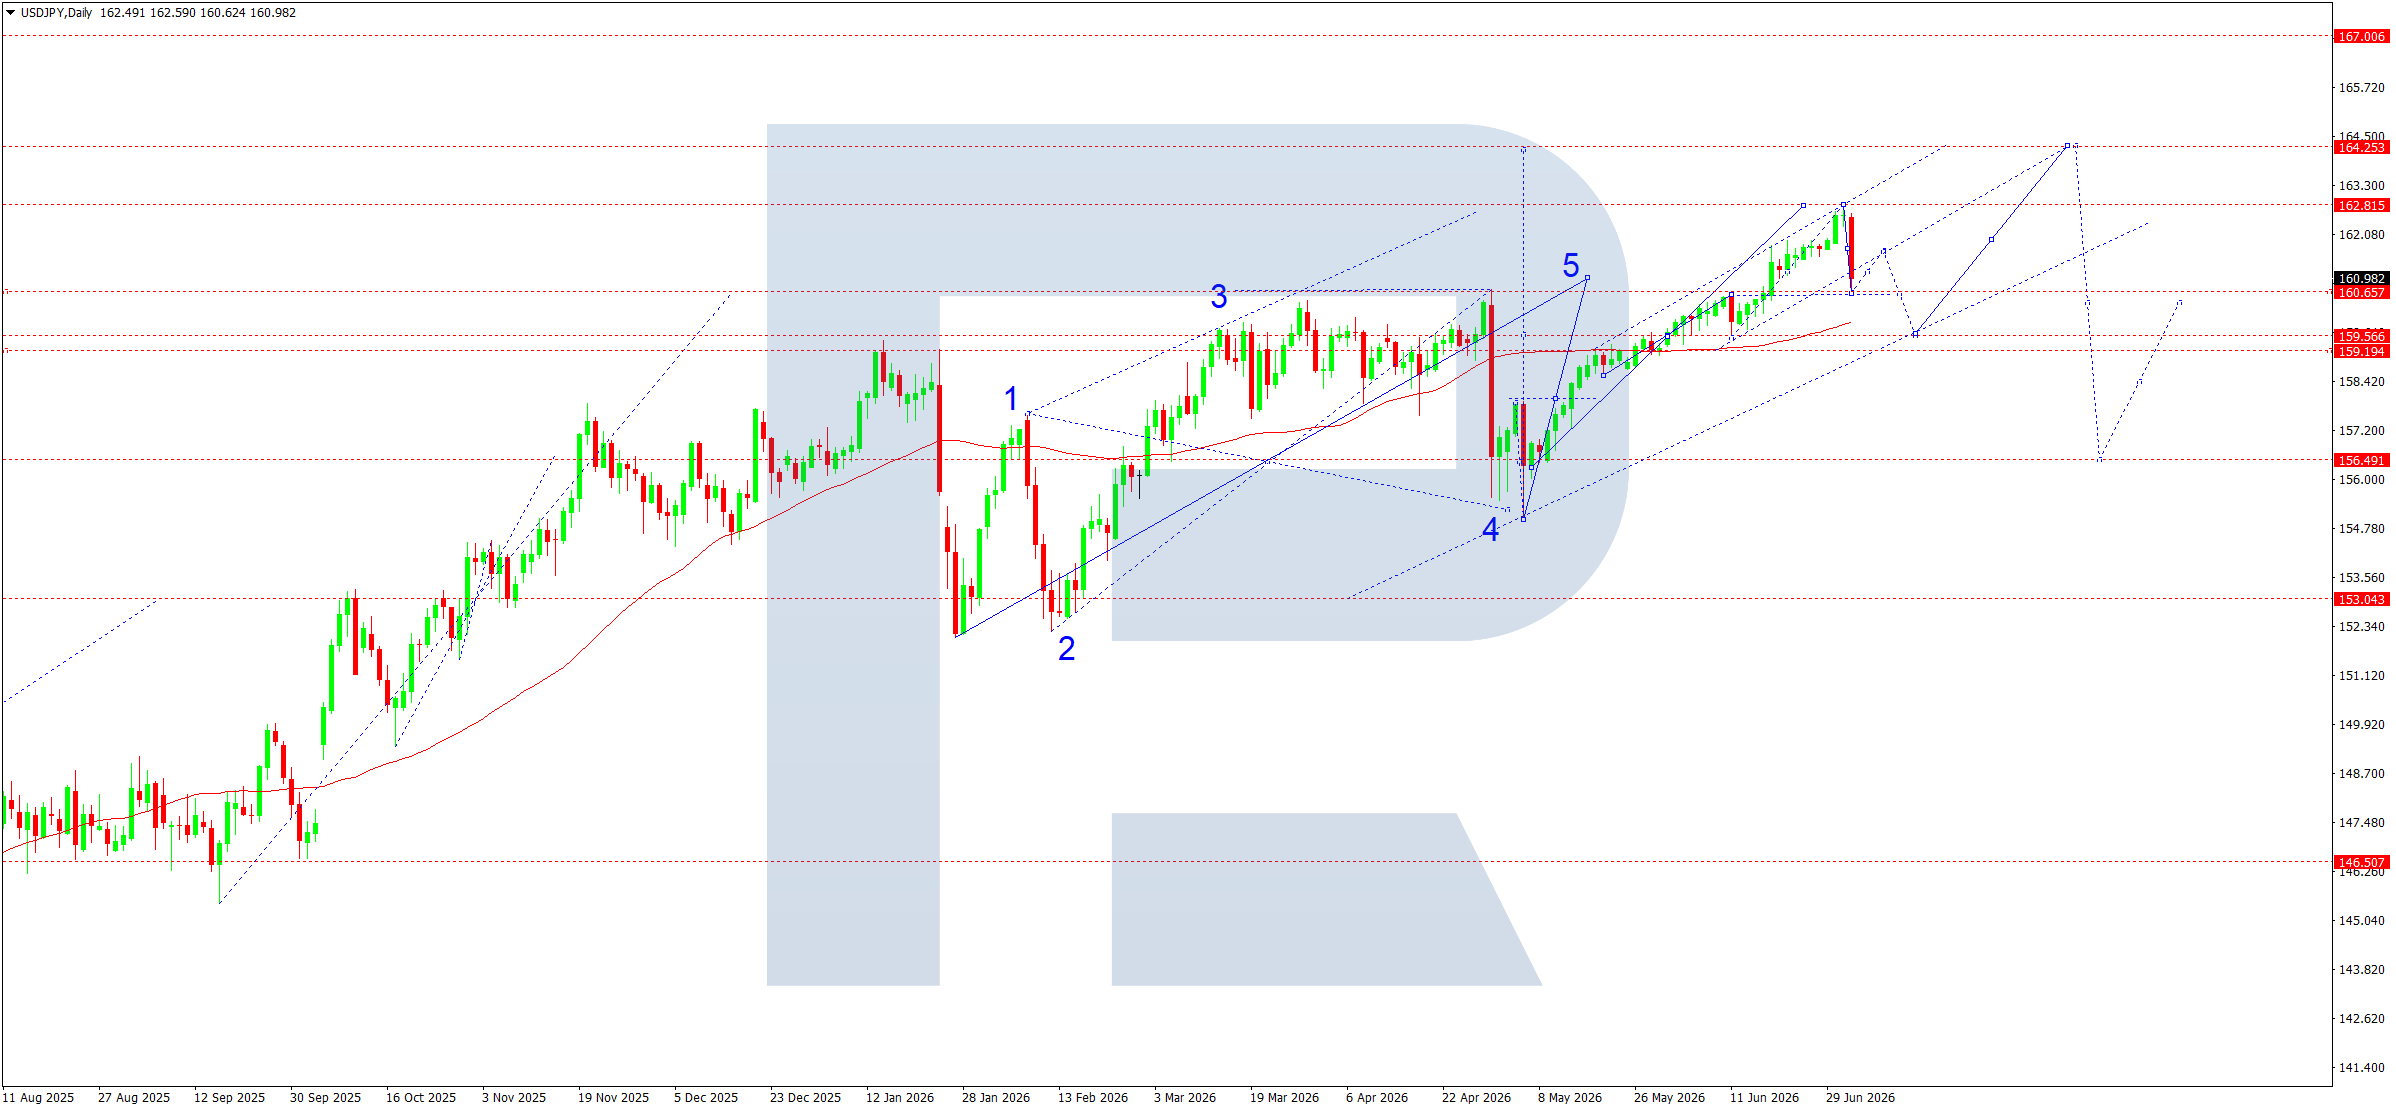
The daily chart preserves its long-term upward structure. After completing the fifth upward wave, the market reached a local resistance area at 162.80–163.30, where the expected correction began. According to the Elliott Wave structure, the current decline still looks like a corrective wave within the main uptrend.
The price pulled back to the first support zone around 160.98, which coincides with the upper boundary of the previous ascending channel and the nearest pivot point. This range will become key for determining the further direction of movement.
The SMA50 continues to rise confidently and passes well below current prices near the 159.60 area, confirming that the medium-term uptrend remains intact. As long as quotes hold above this average, buyers retain the advantage.
The upper boundary of the ascending channel lies near 164.25. This level remains the buyers’ main target if growth resumes. If the market consolidates above 162.80, it will be able to retest the 164.25 high.
At the same time, a deeper correction cannot be ruled out. A breakout of support at 160.98 will open the way towards the next strong area at 159.56–159.20, where the dynamic support of the ascending channel also sits. New demand from medium-term market participants will likely emerge there.
Overall, the chart structure still shows no signs of a reversal in the long-term trend. The current correction looks technically justified after a prolonged advance and may prepare the market for a new upward wave if the price remains above the main support levels.
USDJPY forecast scenarios
Bullish (base case): after the correction ends in the 160.98–159.60 area, buyers may regain the initiative. Consolidation above 162.80 will open the way towards 164.25.
Bearish (alternative): if the price consolidates confidently below 160.98, the probability of a decline towards 159.56 will increase, with a possible correction towards 159.20.
GBPUSD forecast
The upcoming week for GBPUSD will unfold under the influence of expectations regarding the further monetary policy of two major central banks at once. After the release of weak US employment data, investors began revising expectations for the Federal Reserve’s further actions. Slower growth in the number of new jobs increased pressure on the US dollar, although persistent inflation readings still limit the probability of rapid Fed policy easing.
From the UK, the market’s attention remains focused on statements from the Bank of England leadership. The Bank of England governor made it clear that the regulator is not yet considering an interest rate cut and intends to maintain a cautious approach while assessing the impact of inflation and energy market dynamics on the country’s economy. This offers some support to the pound, although political uncertainty in the UK continues to limit its strengthening potential.
Lower global oil prices after reduced geopolitical tensions in the Middle East remain an additional factor. This reduces inflation risks and, at the same time, lowers demand for safe-haven assets. As a result, the market enters the new week awaiting fresh macroeconomic releases from the US and the UK, which could significantly shift the balance of power between the dollar and the pound.
GBPUSD technical analysis
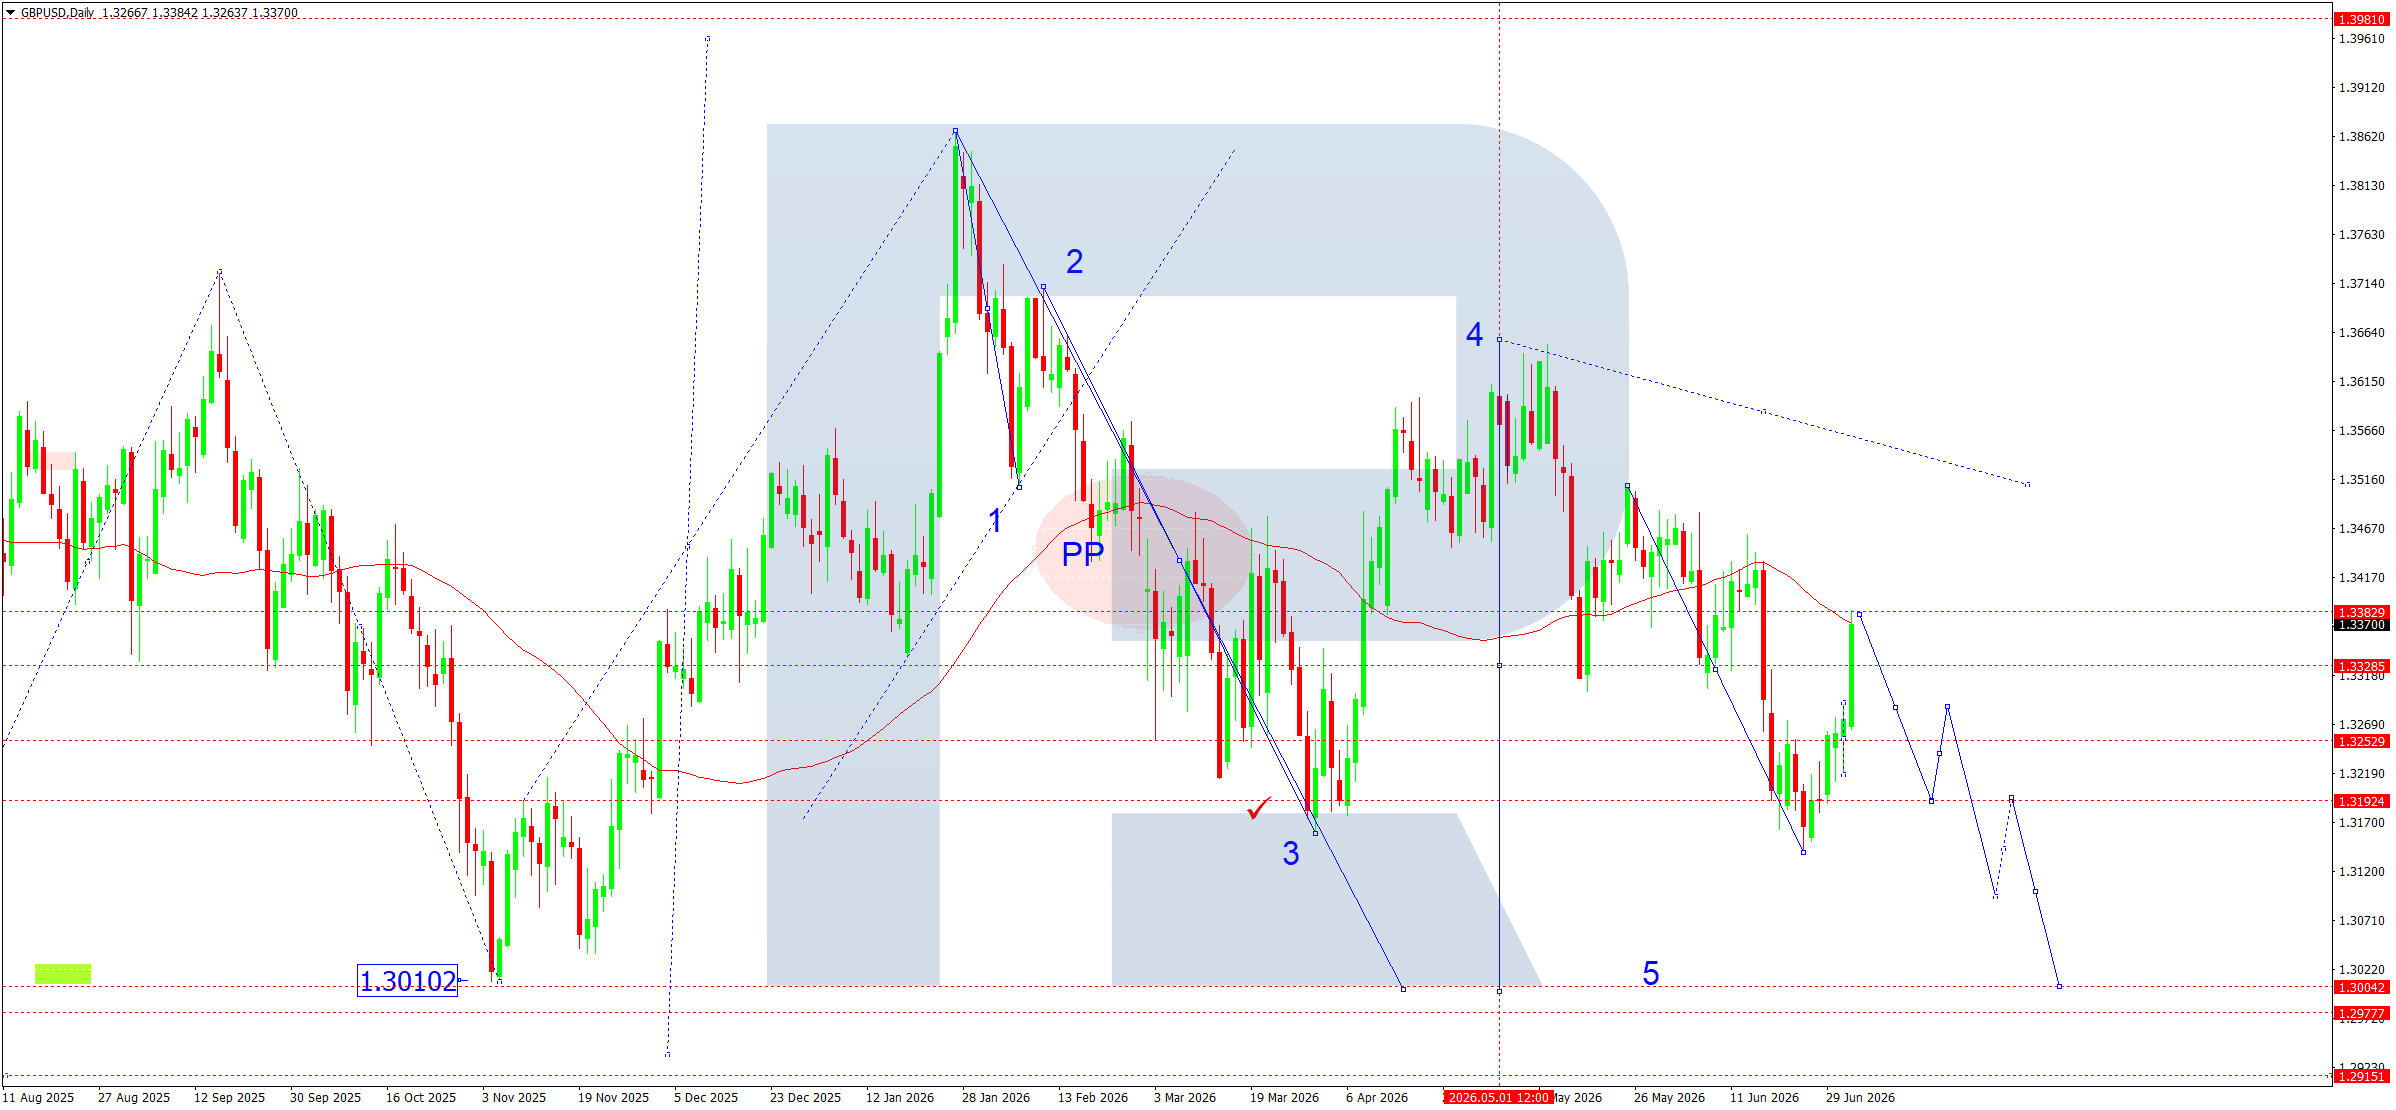
On the daily GBPUSD chart, the medium-term downward impulse continues to develop. After forming a top near 1.3650, the market completed corrective wave 4 and continues to build the final wave 5 according to the Elliott Wave structure.
The price remains below the SMA50, which continues to act as dynamic resistance in the 1.3380 area. Any recovery attempts are still viewed exclusively as corrective movements within the current downtrend.
According to the presented wave structure, the market completed a local correction after declining to 1.3150 and is now forming a pullback towards resistance at 1.3280–1.3330. This area coincides with the nearest resistance levels and may again attract sellers.
The pivot point marked on the chart previously acted as the zone where the medium-term direction changed. After the price moved significantly below this level, sellers continue to control the initiative.
The main descending channel also remains relevant. The upper boundary of the channel passes well above current prices, confirming that the dominant bearish trend remains in place. The wave 5 projection points to the probability of a gradual decline towards the 1.3000 area. If seller pressure intensifies, a test of 1.2977 cannot be ruled out; this level is the main medium-term target of the entire wave structure.
The 1.3192 area remains intermediate support. A breakout of this level will confirm the resumption of the downward impulse, with subsequent movement towards 1.3004 and then 1.2977.
Only a confident consolidation above 1.3380 could call the current fifth-wave scenario into question and provide the first signal of a deeper correction.
GBPUSD forecast scenarios
Bearish scenario (main): corrective growth is expected to end in the 1.3280–1.3330 range, followed by a renewed decline below 1.3192. The first target is 1.3004, followed by 1.2977.
Bullish scenario (alternative): if buyers manage to consolidate above 1.3380, the probability of continued correction towards 1.3500 will increase.
AUDUSD forecast
AUDUSD ended the week under pressure, as the balance of fundamental factors shifted back in favour of the US dollar. The divergence in expectations regarding further central bank policy remains the key market theme. After the release of the Reserve Bank of Australia meeting minutes, investors maintained the view that the regulator continues to adhere to hawkish rhetoric due to persistent inflation risks, although the probability of another rate increase in the near term has fallen noticeably. At the same time, market participants continue to assess the resilience of the US economy after the release of key macroeconomic statistics, which will determine further expectations for Fed policy.
Weak Australian foreign trade figures and mixed economic data from China remain additional sources of pressure on the Australian currency. Despite some improvement in manufacturing activity, the pace of China’s economic recovery remains insufficiently convincing, limiting demand for commodity currencies. In the upcoming week, market participants will focus on the publication of the FOMC minutes, China inflation statistics, and the US ISM business activity index. These events could significantly influence AUDUSD dynamics.
AUDUSD technical analysis
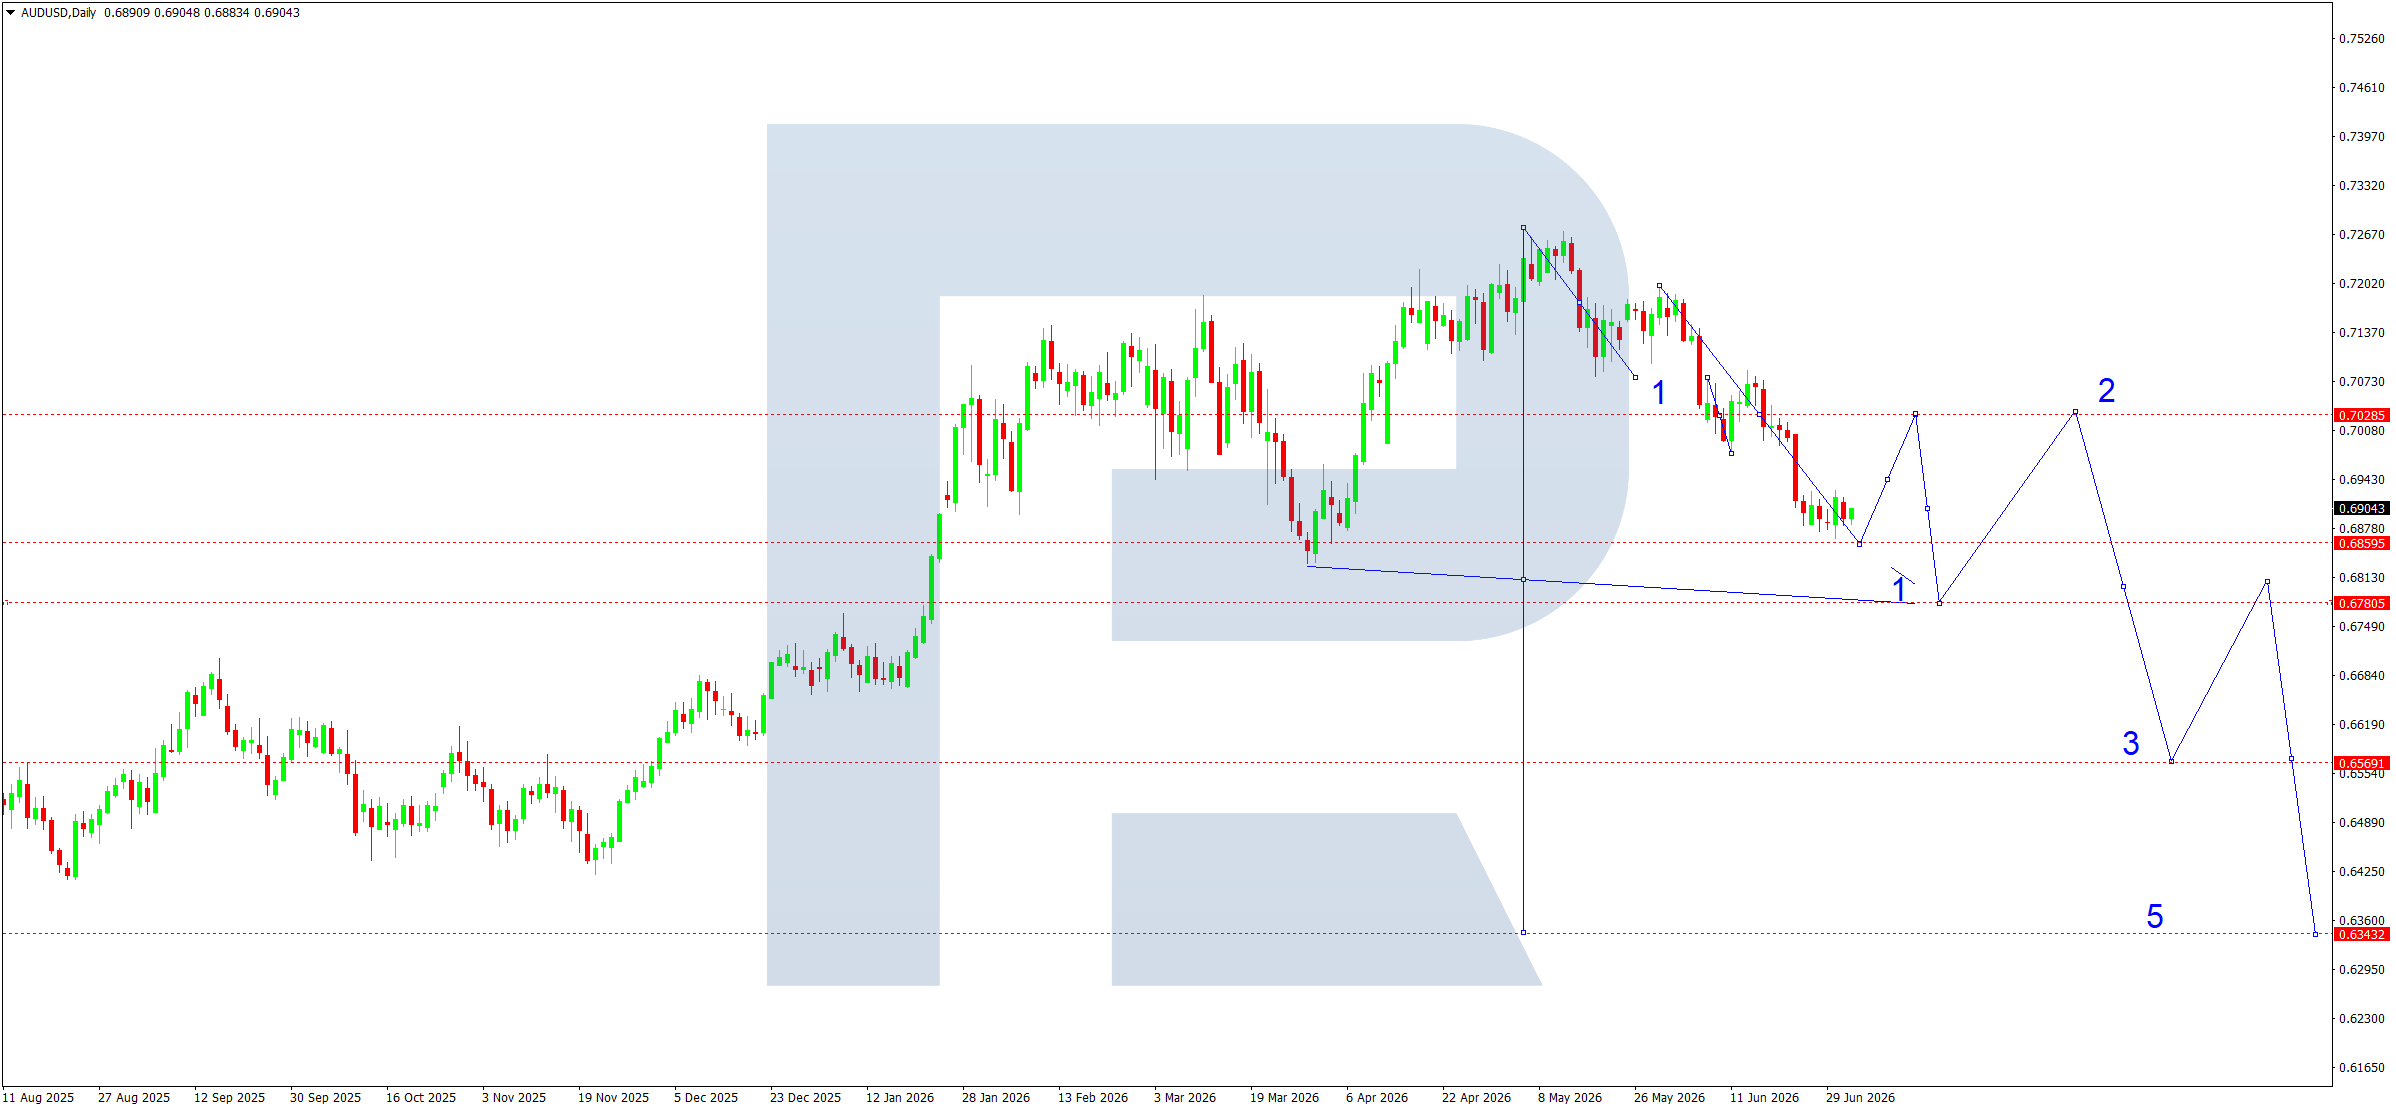
The daily chart maintains a stable downtrend. After forming a top near 0.7267, the market has consistently developed an impulsive downward structure. At present, the price has reached the first local target of the third wave near 0.6860 and continues to trade very close to the support zone.
According to the presented wave structure, sellers’ nearest task is to keep the price below resistance at 0.6970. As long as this level remains unbroken, the overall technical picture remains bearish. The market will most likely form a consolidation phase between 0.6860 and 0.6970 at the beginning of the week, after which a corrective rise may follow.
From a technical perspective, the correction may develop towards the 0.6970 area, where the nearest resistance zone lies. This is where a new decision point is expected to form. If seller pressure persists, the end of the corrective wave will open the way for a continued decline first towards 0.6780, which corresponds to the next local target, and then towards support at 0.6569.
If sellers manage to consolidate confidently below 0.6780, the downward structure will develop further, shifting towards the main medium-term target near 0.6343. On the current chart, this level corresponds to the completion of the assumed fifth wave of the downward impulse.
The indicator picture also remains predominantly bearish. The sequence of lower highs and lower lows confirms that the downtrend remains intact. Any upward movements still look exclusively like corrections within the main downward structure.
AUDUSD forecast scenarios
Bearish scenario (base case): the local downside target near 0.6860 has been met. Consolidation above 0.6780 is expected to develop, followed by a correction towards 0.6970. After the correction ends, the decline will most likely resume first towards 0.6780 and then towards 0.6569.
Bullish scenario (alternative): if the price consolidates confidently above 0.6970 amid rising volumes, continued recovery towards 0.7030–0.7100 may be considered.
USDCAD forecast
USDCAD is ending the first week of July near yearly highs, remaining under the influence of several fundamental factors at once. The difference in monetary policy expectations between the Federal Reserve and the Bank of Canada remains the main driver. Despite weak US labour market data, which strengthened expectations that the Fed will keep the rate unchanged at its next meeting, the US currency remains resilient due to high Treasury yields and the regulator’s cautious stance on inflation risks.
For the Canadian dollar, the situation remains less favourable. The BoC continues to adhere to a cautious policy, as the country’s economy shows signs of slowing, while lower oil prices limit capital inflows into the commodity sector. Uncertainty around the outlook for North American trade and expectations of new macroeconomic releases, including the Bank of Canada Business Outlook Survey, Canada’s trade balance, the FOMC minutes, and Friday’s Canadian labour market data, exert additional pressure on CAD. These events may determine the direction of the pair in the second half of the week.
USDCAD technical analysis
The daily chart maintains a pronounced uptrend. After the second wave formed near 1.3549, the market confidently developed an upward impulse, which currently corresponds to the development of the third wave according to the Elliott Wave structure. The price consolidated well above the SMA50, which continues to rise confidently and confirms buyers’ dominance.
According to the presented wave count, the third wave has almost reached its calculated completion zone in the 1.4373–1.4438 range. After such a strong impulse, the probability of a corrective fourth wave is rising noticeably. On the chart, the assumed correction target lies near 1.3965, where an important support and former resistance zone is located. A new pivot point is expected to form there, potentially becoming the starting point for a resumption of the long-term upward movement.
If the correction is indeed limited to the 1.3965 area and buyers regain the initiative, the market will receive technical prerequisites for forming the fifth upward wave. In this case, the nearest strategic target will again be 1.4438, with the possibility of renewing the yearly high.
It should be noted that the current structure remains fully bullish. The sequence of higher highs and higher lows remains intact, while the SMA50 continues to act as dynamic support. As long as the price holds above 1.3965, buyers retain the medium-term advantage. Only a confident breakout of this area could significantly weaken the upward structure and lead to a deeper correction.
USDCAD forecast scenarios
Bullish (base case): after the correction towards 1.3965 ends, growth is expected to resume above 1.4177, followed by movement towards 1.4373 and then 1.4438.
Bearish (alternative): if the market consolidates confidently below 1.3965, the probability of a continued decline towards 1.3936 will increase.
XAUUSD forecast
Gold is ending the first week of July with a notable improvement in sentiment after a strong recovery from the June lows. Weak US labour market data became the main growth driver, significantly reducing expectations of imminent monetary policy tightening. The number of new jobs came in well below forecasts, leading to a decline in US bond yields and a weaker US dollar. Against this backdrop, demand for safe-haven assets strengthened again, while XAUUSD managed to recover part of its previously lost ground.
Persistent geopolitical risks continue to provide additional support to the market. Negotiations on the Middle East agenda have so far produced no notable progress, while high uncertainty in the global economy supports investor interest in defensive instruments. At the same time, global central banks continue to increase gold reserves, creating steady long-term demand for the precious metal.
In the upcoming week, market participants will closely assess new US macroeconomic indicators and comments from Federal Reserve (Fed) officials. Any signals that the next interest rate increase may be postponed could support a further gold recovery, while more hawkish Fed rhetoric could limit the upward correction.
XAUUSD technical analysis
On the daily chart, the downward structure formed after the January all-time high remains intact. Prices are still hovering below the 50-day moving average, which passes near 4,400 and remains the main dynamic resistance. Despite the strong rebound of recent days, the overall medium-term trend remains bearish.
According to the Elliott Wave count, the decline has almost completed the main impulsive wave towards the 3,925 support area. This level has repeatedly held sellers back and acts as the key point for forming a medium-term market base. After reaching this area, the first signs of weakening downward momentum and the formation of a corrective structure appeared.
In the coming days, the most likely scenario remains a corrective wave upwards. The buyers’ first target is 4,146, where the nearest horizontal resistance lies. A confident breakout of this level will open the way towards the next target at 4,400, which coincides with an important zone of previous lows and the SMA50 location. Seller activity is expected to intensify there.
If buyers fail to consolidate above 4,146, the market may shift into a sideways consolidation phase between 3,925 and 4,146. Such a pause would correspond to the formation of a corrective wave before the next directional movement.
As long as prices remain below 4,400, sellers retain the medium-term initiative. However, a stable hold above 3,925 significantly increases the probability of a deeper upward correction. The chart also shows a potential wave structure that suggests a gradual rise first towards 4,146, then towards 4,400 and, if a strong impulse develops, towards the 4,759 area, where the next significant resistance is located.
XAUUSD forecast scenarios
Bearish (base case): after forming a consolidation range near 4,146, the market may resume its decline towards 3,925. If support holds, the downward wave is expected to end, followed by a transition to recovery towards 4,400.
Bullish (alternative): a confident breakout of 4,146 with rising volumes will confirm a corrective movement towards 4,400. Consolidation above this resistance level will open the potential for further growth towards 4,759.
Brent forecast
The upcoming week for Brent oil will unfold under the influence of several fundamental factors at once. The gradual reduction of the geopolitical premium after the situation around oil supplies through the Strait of Hormuz improved remains the main theme. Negotiations between the US and Iran reduced concerns about disruptions to crude exports, allowing market participants to refocus on the fundamental balance of supply and demand.
Expectations of another production increase by OPEC+ countries, which may be approved at the alliance’s next meeting, exert additional pressure. The market is pricing in further supply growth, while the recovery in global demand remains fairly moderate. Weak fuel consumption dynamics in China and Europe continue to act as a particularly restraining factor.
At the same time, US labour market data, business activity figures, and statistics on US commercial crude oil inventories may support prices. If demand from refineries remains high, a decline in inventories may temporarily limit seller pressure. However, the overall fundamental backdrop at the start of the new week remains rather negative, as the market gradually shifts from assessing geopolitical risks to analysing the prospects of excess supply.
Brent technical analysis
On the daily chart, Brent maintains a stable downtrend. After completing a major top near 114.08, the market formed a full-fledged impulsive downward wave. All attempts by buyers to organise a recovery still end with the formation of lower highs, confirming that sellers retain control.
Prices consolidated confidently below the 50-day moving average, which continues to turn downwards and acts as dynamic resistance. At the same time, quotes continue to move within a descending channel, limited by its upper and lower boundaries.
At present, Brent is testing the 73.06 support area. This level represents an intermediate target of the current downward wave. If pressure persists, the next target will be the 69.96–69.19 area, which coincides on the chart with the main completion zone of the fifth downward wave according to the Elliott Wave structure. This is where the probability of forming a medium-term reversal base and beginning a corrective recovery increases.
An attempt to rise is still viewed exclusively as a correction within the downtrend. To change the technical picture, buyers need to return the price above 76.81, after which the potential for movement towards the 81.78 zone will emerge, where the next strong resistance area is located. Until this happens, any recovery remains a technical rebound.
The wave structure also confirms bears’ advantage: the market continues to form a sequence of lower highs and lower lows, while the main downside target remains in the 69.19–69.96 range. Only the formation of a stable base in this area will allow the market to count on a more prolonged growth phase.
Brent forecast scenarios
Bearish (base case): the market holds below 73.06 and continues to develop a downward wave with a target of 69.96–69.19. After the fifth wave ends, a corrective rise towards 73.00–76.80 may form.
Bullish (alternative): if Brent consolidates above 73.06 and breaks resistance at 76.81, the probability of a recovery towards 81.78 will increase, followed by the development of a deeper correction.
BTCUSD forecast
The upcoming week for BTCUSD starts under continuing pressure on the entire digital asset market. The combination of tight monetary policy from the US Federal Reserve (Fed), high US bond yields, and weak demand from institutional investors remains the main factor. After an extremely weak June, which became Bitcoin’s worst month in the last several years, market participants continue to closely monitor capital flows into spot Bitcoin ETFs, as these remain the main sentiment indicator for major investors. The continuing net outflow from ETFs exerts additional pressure on quotes.
Investor caution ahead of new US macroeconomic data releases remains an additional negative factor. Any strong labour market or inflation readings could strengthen expectations that high interest rates will remain in place, traditionally reducing the appeal of high-risk assets, including cryptocurrencies. At the same time, individual corporate Bitcoin purchases by major companies show that long-term institutional interest has not disappeared completely, although it cannot yet reverse the prevailing downtrend.
BTCUSD technical analysis
From a technical perspective, BTCUSD continues to form a downward structure after completing a large corrective wave from the spring high. The presented chart clearly shows a sequence of lower highs and lower lows, confirming that the medium-term bearish trend remains intact.
After a rapid decline, the market tested the 57,300–58,200 support area, where the first signs of local stabilisation appeared. This zone now acts as the main pivot point. Despite buyers’ attempt to form a recovery, the price still remains significantly below the previously broken ascending trendline, which now acts as serious resistance.
The nearest resistance is the 62,240–63,990 area. This is where the first zone of seller profit-taking and a possible resumption of the downward movement lies. Only a confident consolidation above this area will allow the market to speak of a deeper correction, with subsequent movement towards 70,850, where the next strong supply zone is located.
If seller pressure persists, the market may retest the 57,300 area. The Elliott Wave structure presented on the chart also allows the current downward wave to end precisely near the specified support, followed by the formation of a corrective recovery. However, until confirming signals appear, sellers still retain priority.
The medium-term structure does not yet show signs of a full upward reversal. Any attempts to rise still look like corrective movements within the continuing descending channel. Only a return above 64,000 will materially improve the technical picture and allow expectations of a recovery towards 70,850.
BTCUSD forecast scenarios
Bearish (base case): the market maintains consolidation below 62,240 with a retest of support at 57,300. If pressure intensifies, a short-term extension of the decline towards the 55,800–57,000 zone cannot be ruled out.
Bullish (alternative): consolidation above 62,240 and an increase in trading volumes will open growth potential first towards 64,000 and then towards 70,850.
Editors’ picks
 EURUSD forecast 2026–2027: technical analysis, price levels & predictions
The ECB holds rates at 2.15% while the Fed stays at 3.75% — and that divergence is the central driver of EURUSD in 2026. The pair is range-bound between 1.1400 and 1.1915, with Deutsche Bank targeting 1.2500 and Morgan Stanley calling for 1.3000 by year-end. We analyse the technicals, break down the macro factors, and outline three trading scenarios with specific entry levels.
 Gold (XAUUSD) forecast 2026: predictions based on fundamental and technical analysis
Where is gold headed after pulling back from the all-time high of 5,597 USD? XAUUSD is consolidating near 4,518 USD between key levels 4,220 USD and 4,855 USD, with major banks targeting 5,243–6,200 USD by year-end. Read our comprehensive gold forecast: technical analysis across three timeframes, trading scenarios with specific entry levels, Fed policy and central bank demand outlook, and institutional predictions for 2026 and beyond.
Forecasts presented in this section only reflect the author’s private opinion and should not be considered as guidance for trading. RoboForex bears no responsibility for trading results based on trading recommendations described in these analytical reviews.