
Weekly technical analysis and forecast (20–24 July 2026)
In this weekly technical analysis, we examine the key chart patterns and price levels for EURUSD, USDJPY, GBPUSD, AUDUSD, USDCAD, Gold (XAUUSD), Brent crude oil, and Bitcoin (BTCUSD) to forecast market developments for the week ahead (20–24 July 2026).
Major technical levels to watch this week
- EURUSD: Support: 1.1379, 1.1260. Resistance: 1.1482, 1.1509
- USDJPY: Support: 161.30, 159.55. Resistance: 163.35, 164.15
- GBPUSD: Support: 1.3385, 1.3300. Resistance: 1.3555, 1.3630
- AUDUSD: Support: 0.6873, 0.6788. Resistance: 0.6996, 0.7066
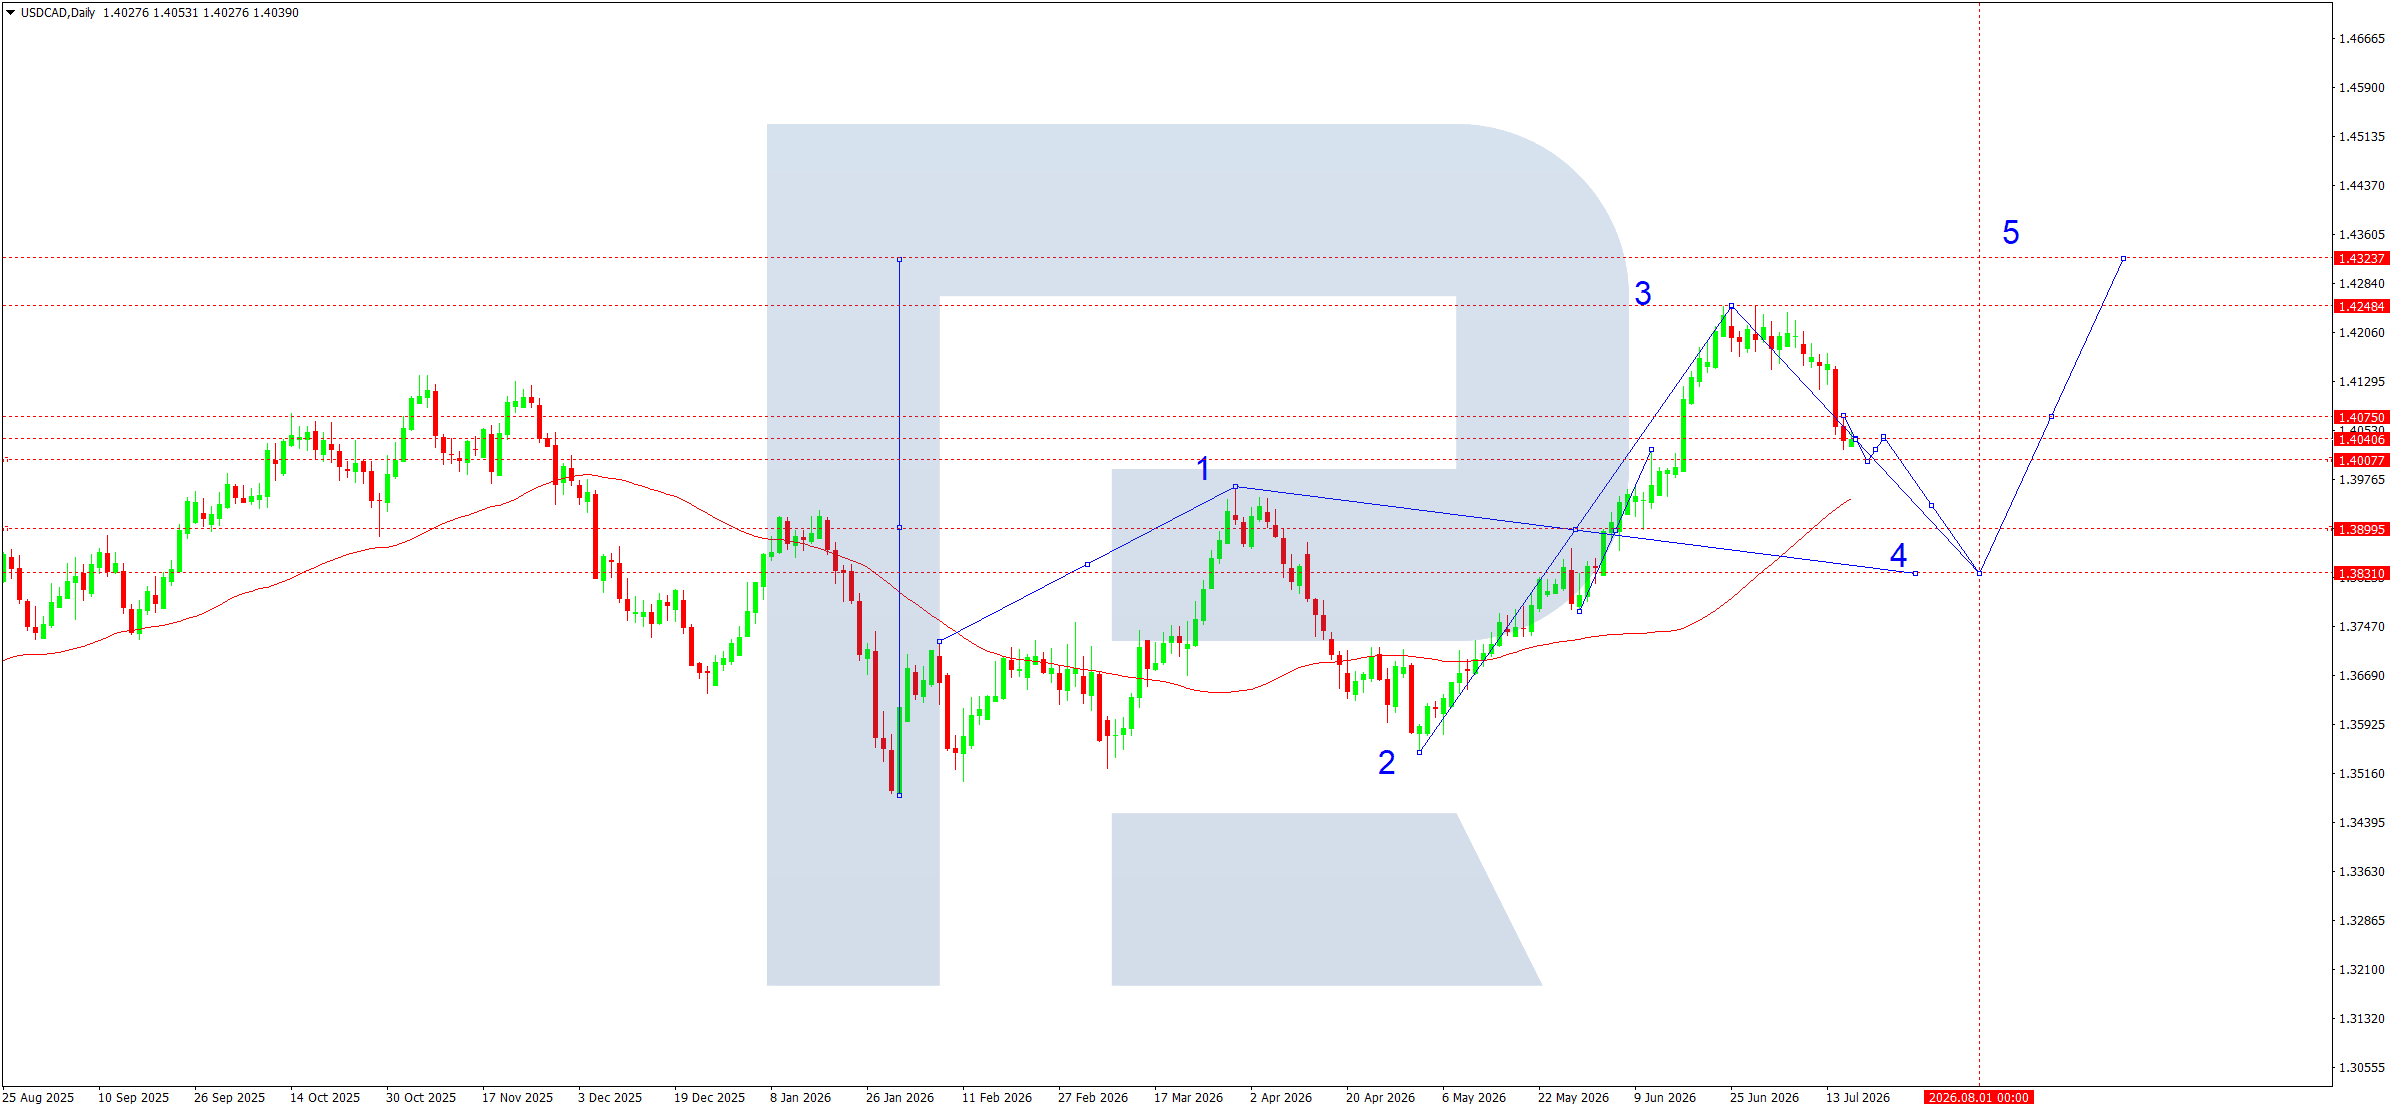
- USDCAD: Support: 1.4007, 1.3895. Resistance: 1.4141, 1.4248
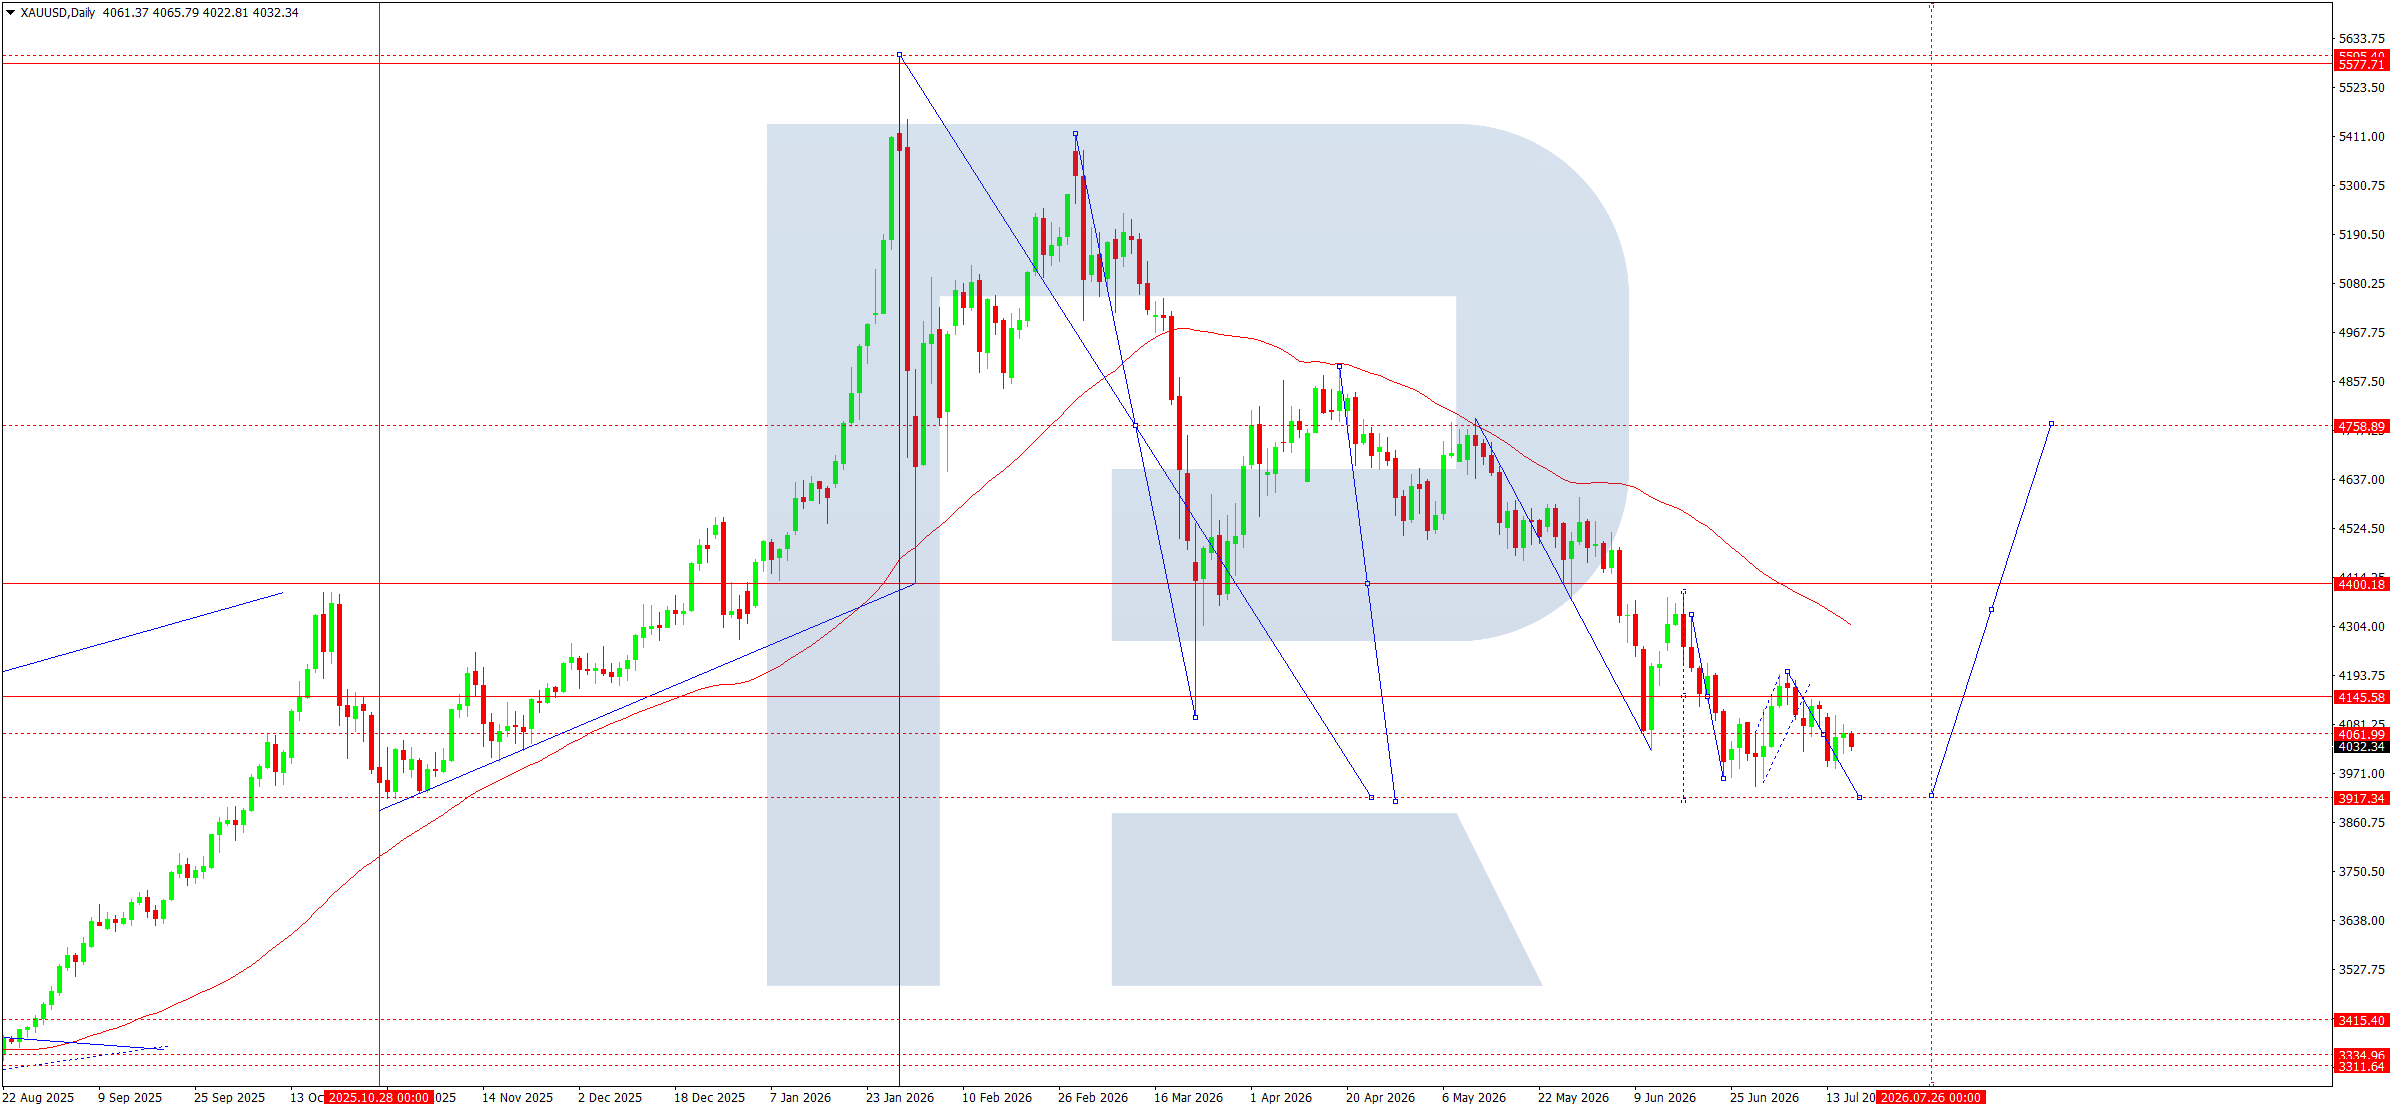
- Gold: Support: 4,060, 3,917. Resistance: 4,145, 4,400
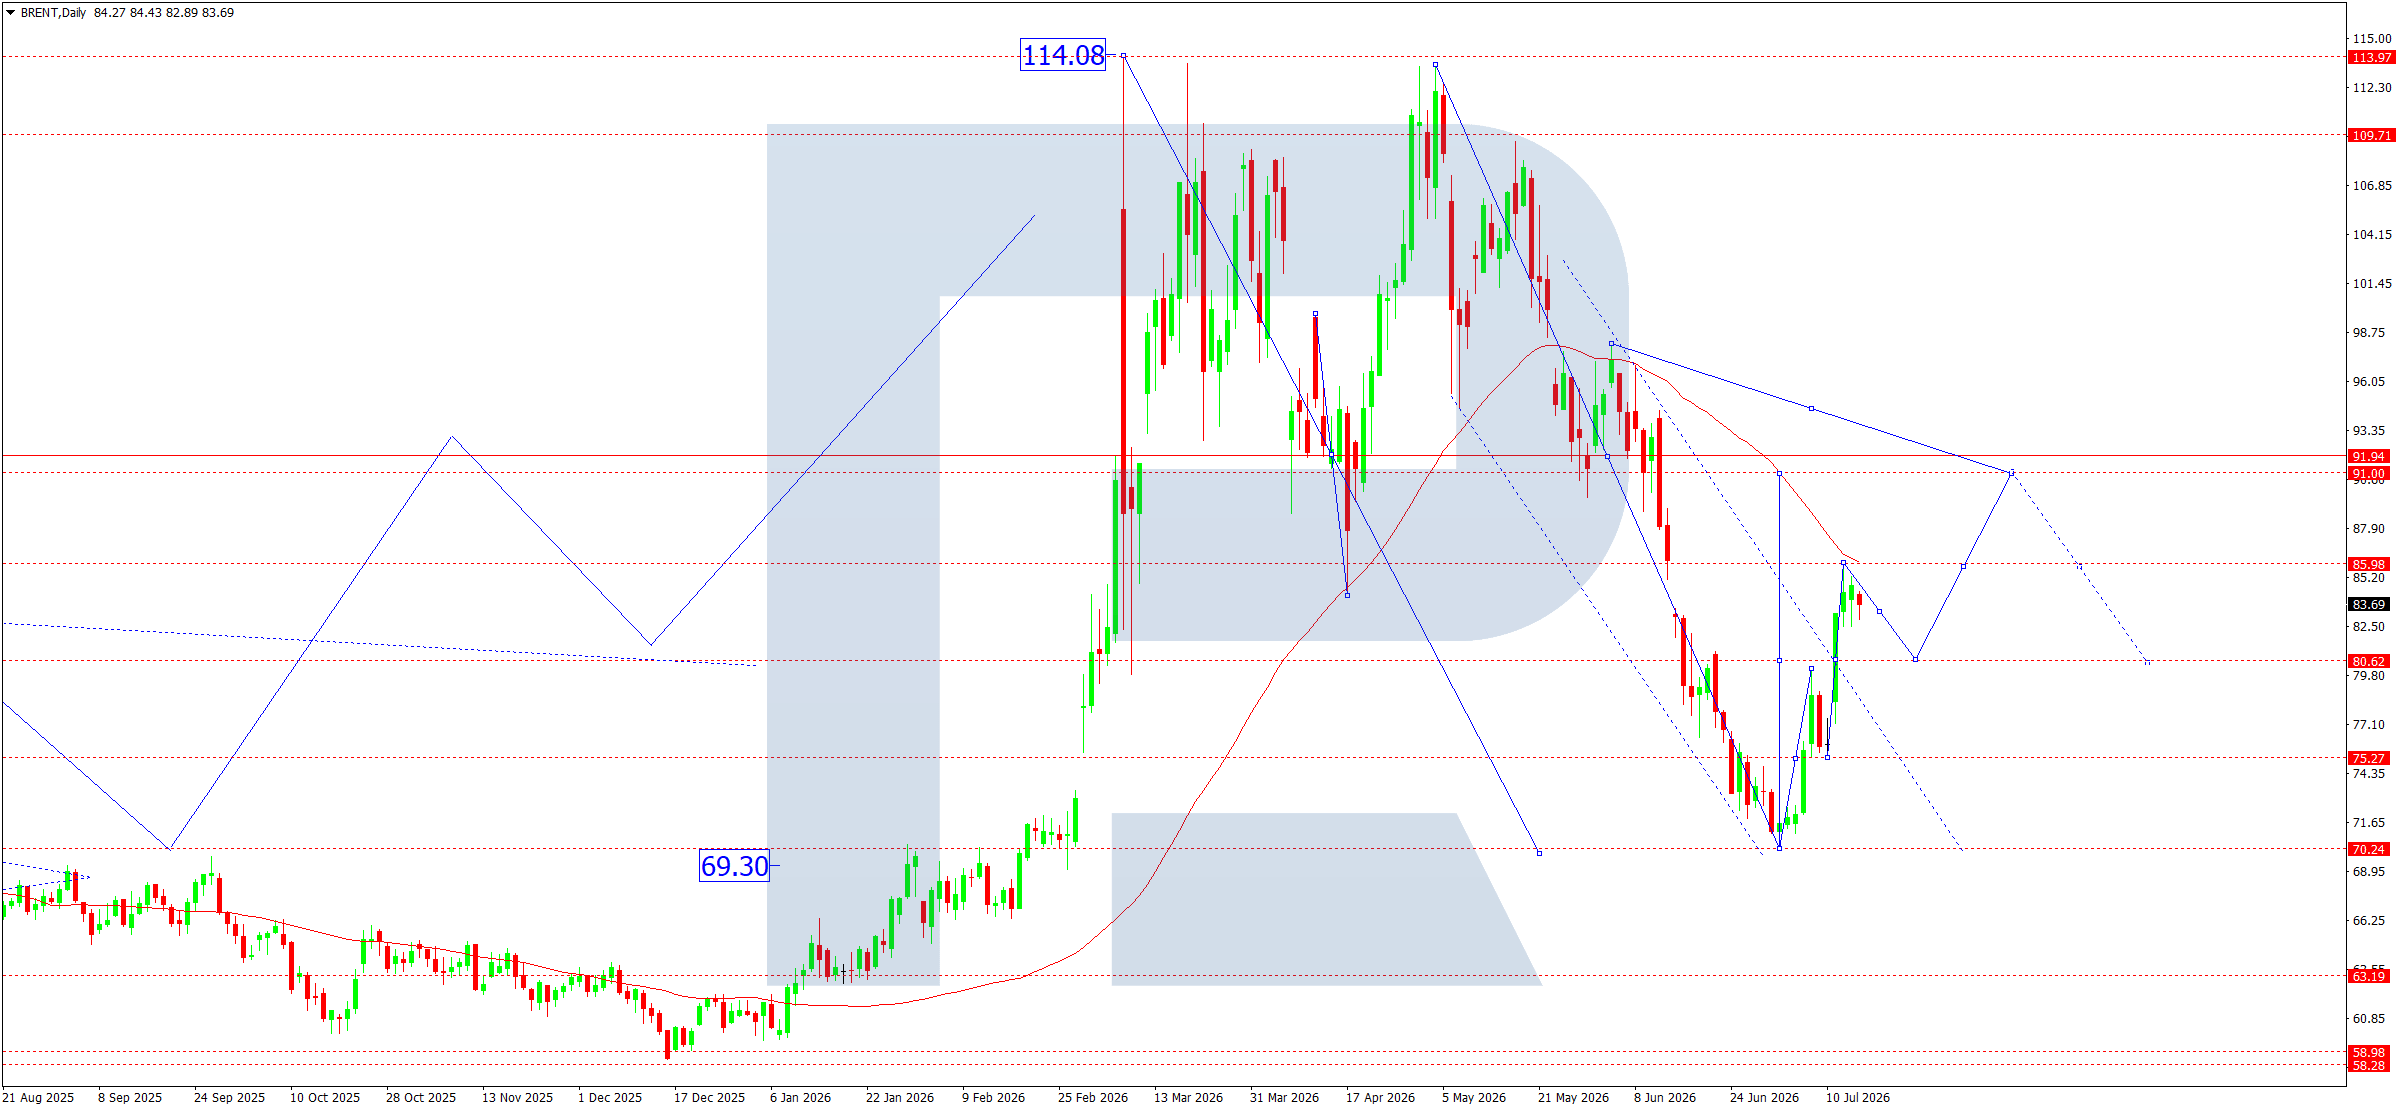
- Brent: Support: 80.62, 75.27. Resistance: 85.98, 91.00
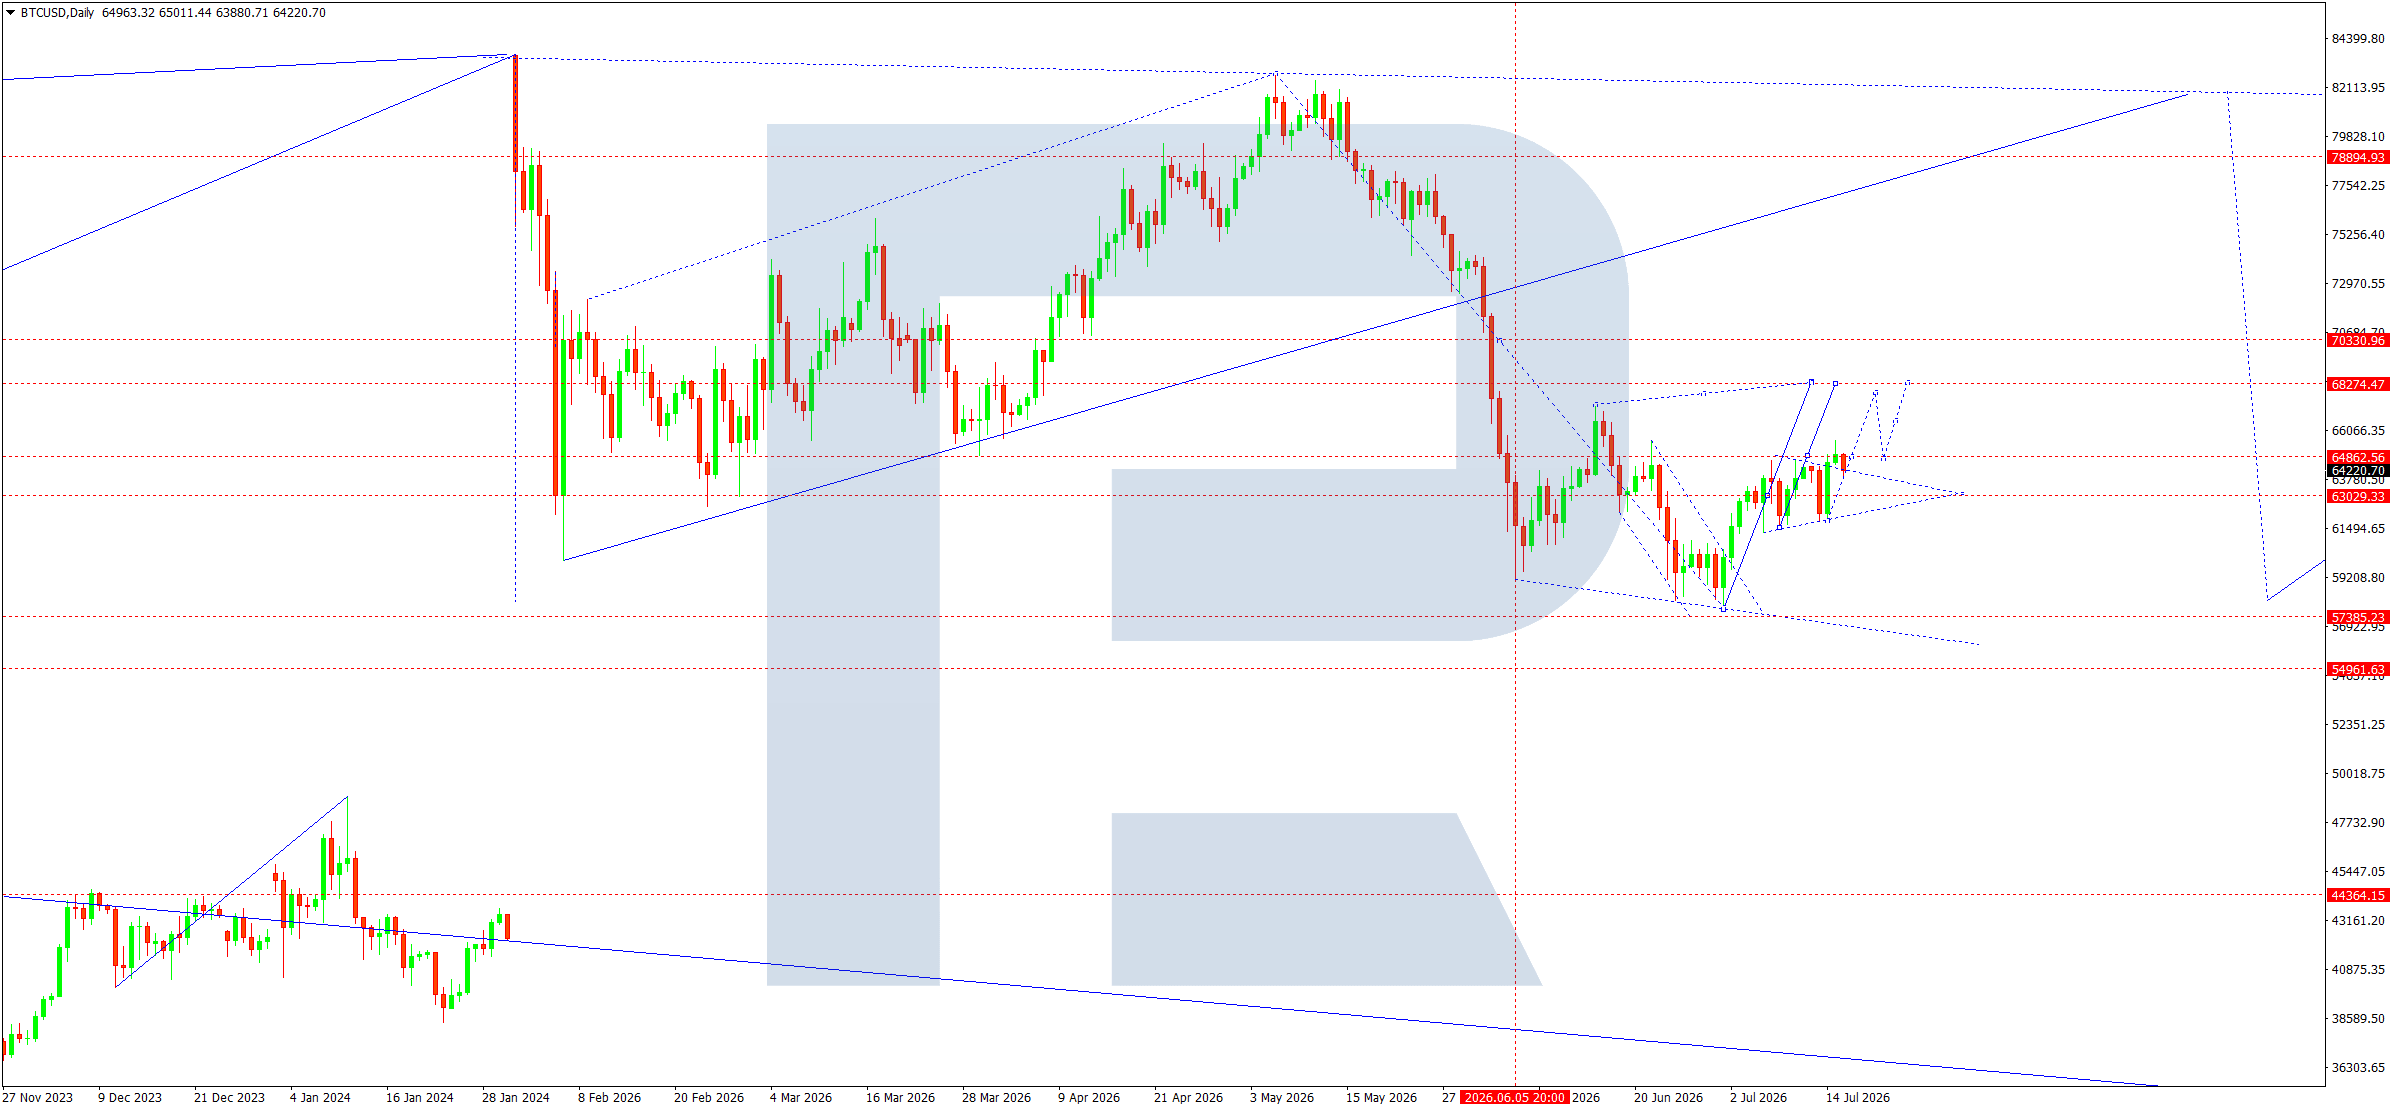
- BTCUSD: Support: 63,000; 57,400. Resistance: 64,600; 68,700
EURUSD forecast
The EURUSD pair ends the week near local lows after a period of elevated volatility. Diverging expectations regarding the future direction of monetary policy on either side of the Atlantic remain the main market driver. The latest US data showed that the economy remains resilient, while inflationary pressure is gradually easing. Federal Reserve officials note that the current interest rate level remains sufficiently restrictive, although future decisions will depend on incoming macroeconomic data. At the same time, the market continues to expect the Fed to maintain a cautious approach at its upcoming meeting.
In the eurozone, investors remain focused on the economic growth outlook and inflation dynamics. The European Central Bank continues to pursue gradual price stabilisation, although weak business activity and persistent risks to the industrial sector limit the euro’s appreciation potential. Geopolitical risks and developments in the energy market remain an additional source of uncertainty and may support demand for the dollar as a safe-haven asset.
EURUSD technical analysis
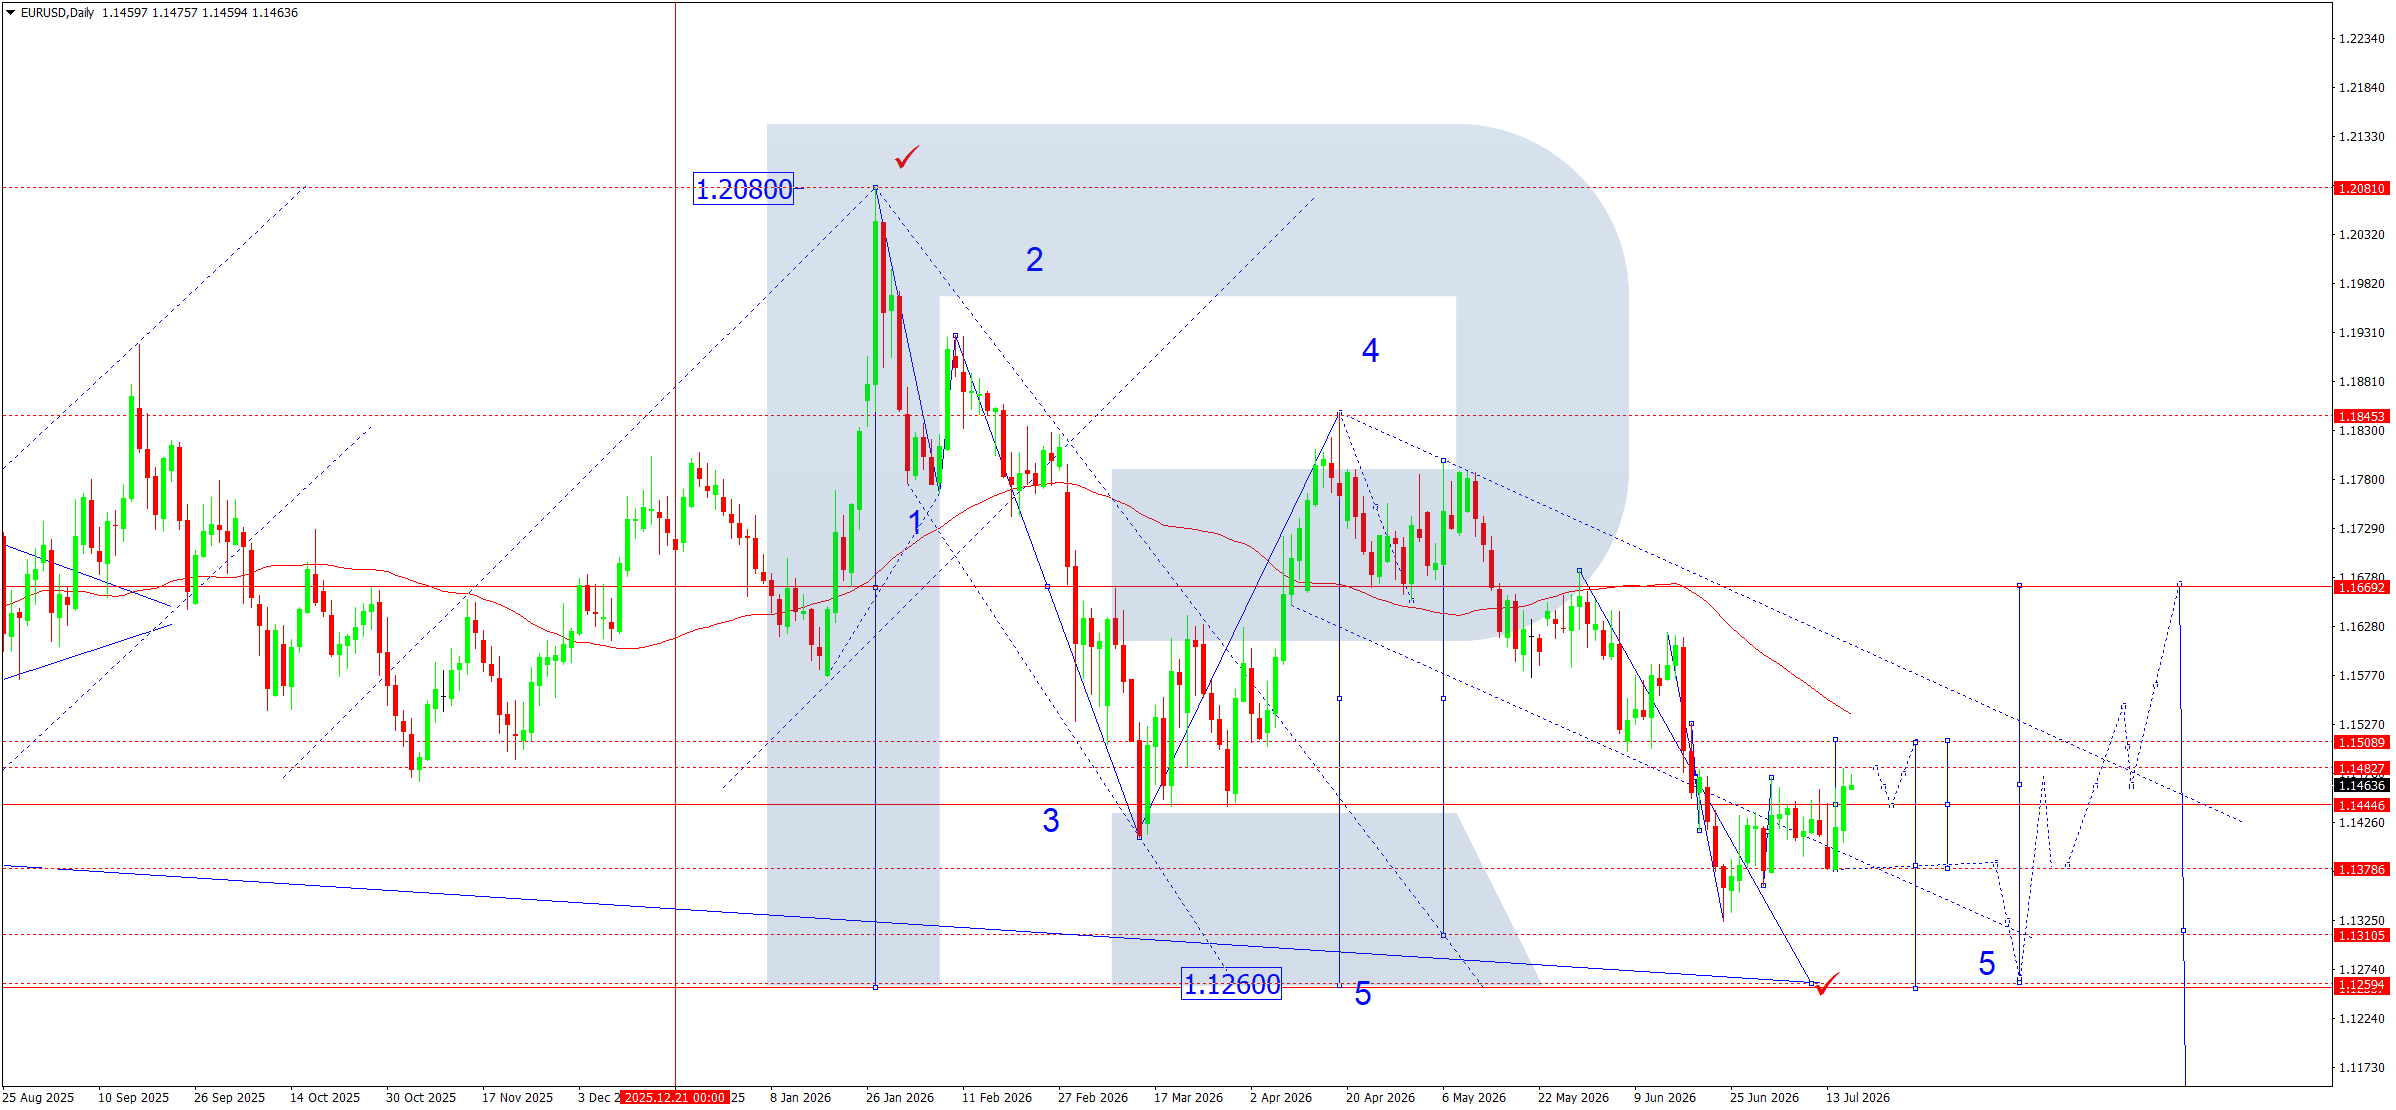
From a technical perspective, EURUSD continues to develop a downward structure corresponding to the formation of the fifth downward wave under the Elliott wave structure. On the daily chart, the price remains within a descending channel, while the SMA50 lies significantly above current quotations, confirming the persistence of the long-term bearish trend.
During the past week, the market tested the 1.1379 support area before forming a corrective rebound. However, this rise remains purely technical and is developing within the broader downward movement. The 1.1444–1.1482 range represents the nearest resistance zone. The local pivot point lies in this area, where sellers may increase pressure again.
According to the presented wave model, the current correction may continue towards the 1.1482 area and, if buying activity strengthens, test 1.1509. Nevertheless, the primary downward structure remains unchanged. After the corrective wave ends, the price is expected to resume its decline and retest 1.1379.
If sellers consolidate below this support, the way will open towards the next strategic target at 1.1260, which coincides with the completion of the current five-wave structure and the long-term support line. As long as the price remains below the SMA50 and the upper boundary of the descending channel, sellers retain the advantage.
EURUSD forecast scenarios
Bearish (base case): the market forms a consolidation around 1.1444. A correction towards 1.1482–1.1509 is possible, followed by an expected resumption of the decline towards 1.1379. A firm breakout below the support will make 1.1260 the primary target.
Bullish (alternative): if buyers consolidate above 1.1482 and break through 1.1509 on rising volumes, the correction may continue towards 1.1669, signalling the formation of a deeper upward correction.
USDJPY forecast
The USDJPY pair ends the week near multi-month highs, maintaining firm upward momentum. The monetary policy divergence between the US Federal Reserve and the Bank of Japan remains the main driver. Despite some easing of inflationary pressure in the US, Fed officials continue to maintain a cautious stance, noting that inflation remains significantly above the target level. Recent comments from US policymakers confirm that they are in no hurry to shift towards policy easing, supporting Treasury yields and demand for the dollar.
The situation in Japan remains more complex. The BoJ is gradually normalising monetary policy, although the weak yen continues to increase import costs and intensify inflationary pressure. At the same time, higher interest rates are causing dissatisfaction among businesses due to rising borrowing costs, so the market does not expect aggressive policy tightening. The possibility of verbal or even direct currency intervention by the Japanese authorities also remains if the national currency weakens further.
Therefore, the fundamental backdrop continues to favour the dollar, although the pair’s approach towards the area of previous interventions significantly increases the probability of short-term corrections.
USDJPY technical analysis
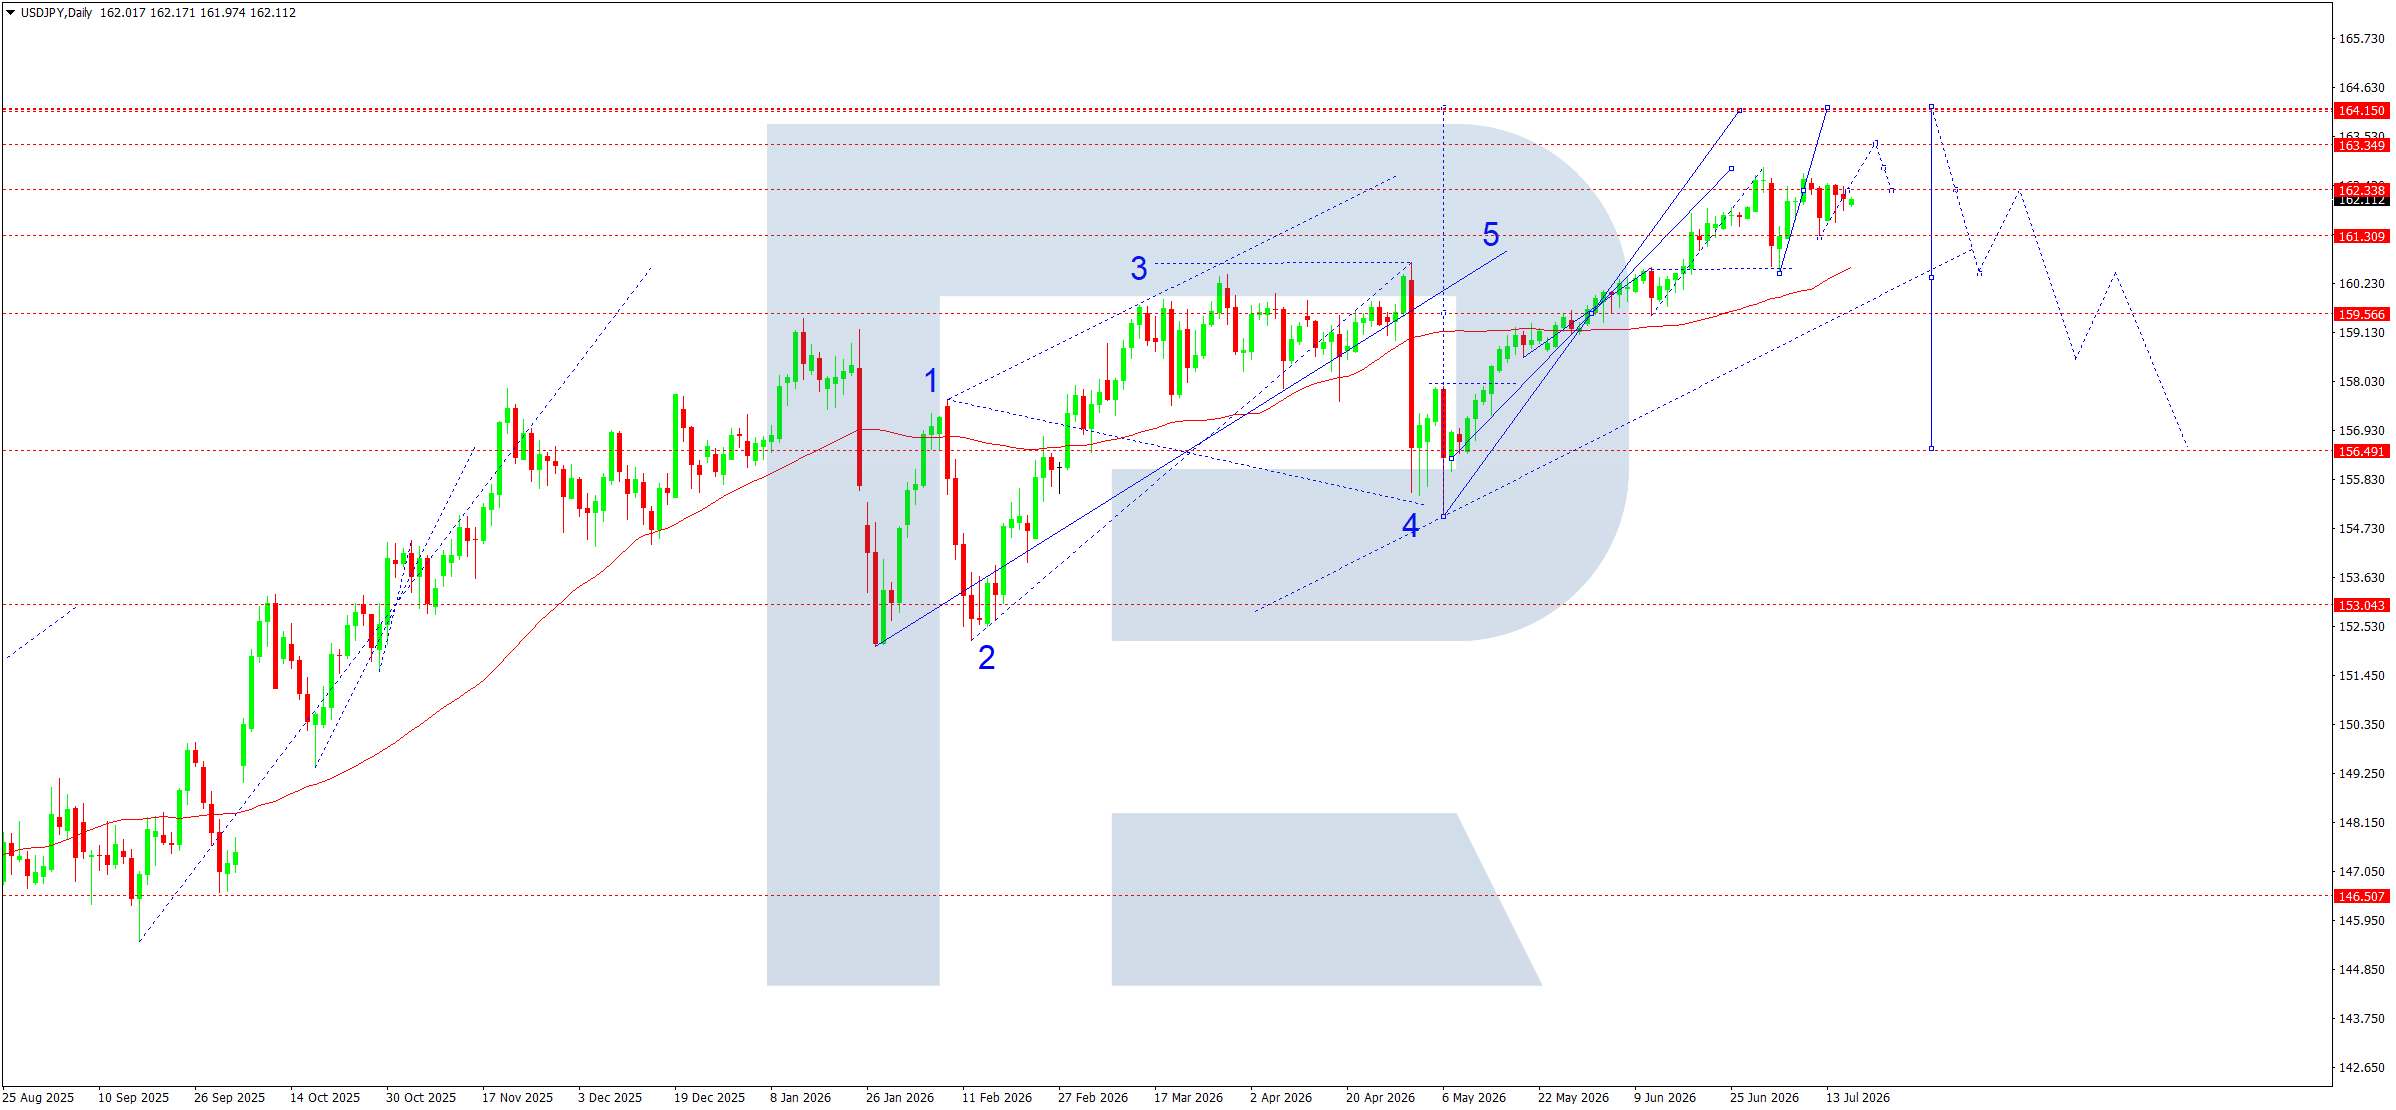
The daily chart maintains a complete upward Elliott wave structure. After completing the large corrective wave 4, the market formed a powerful impulse wave 5, within which the final upward structure is developing. The price holds firmly above the SMA50, which continues to act as dynamic support and confirms the persistence of the medium-term bullish trend.
After reaching the 162.30–162.40 area, the market entered a consolidation phase. A local range is forming, which may represent accumulation before an attempt to continue the rise. According to the presented wave structure, the base-case scenario assumes the completion of a minor correction followed by new highs.
The nearest resistance lies at 163.35. A firm breakout above this level will open the way towards the primary target at 164.15, which coincides with the upper boundary of the projected ascending channel and the completion of the current impulse. The probability of profit-taking and the formation of a deeper corrective wave will increase significantly in this area.
At the same time, the chart shows an alternative scenario. If buyers fail to consolidate above 163.35–164.15, the probability of a reversal pattern will increase. In this case, the 161.30 area, where the nearest technical support lies, will become the initial downside target. A breakout below this level will intensify selling pressure and open the way towards the next support zone at 159.55, which coincides with the previous consolidation area and the lower boundary of the ascending channel.
As long as the price remains above 161.30, the overall technical picture continues to indicate that buyers retain control.
USDJPY forecast scenarios
Bullish (base case): after the current consolidation ends, the market may break through 163.35 and continue rising towards 164.15, where the upward wave is expected to end.
Bearish (alternative): if the price consolidates below 161.30, the probability of a deeper correction towards 159.55 will increase.
GBPUSD forecast
Expectations regarding decisions by the largest central banks and assessments of the resilience of the UK and US economies will influence the GBPUSD pair in the upcoming week. Market participants will focus primarily on the monetary policy outlooks of the Bank of England and the Federal Reserve. The latest US data showed a gradual easing of inflationary pressure, although Fed officials continue to maintain a cautious stance, noting that inflation remains above the target level and that future decisions will depend on incoming data.
In the UK, the BoE continues to keep its interest rate unchanged while highlighting persistent inflation risks associated with volatile energy prices. Despite some decline in inflation, the regulator is in no hurry to shift towards a more accommodative policy, which continues to support the pound. Political expectations regarding the UK’s fiscal policy remain an additional factor and have contributed to the strengthening of the British currency in recent days.
GBPUSD technical analysis
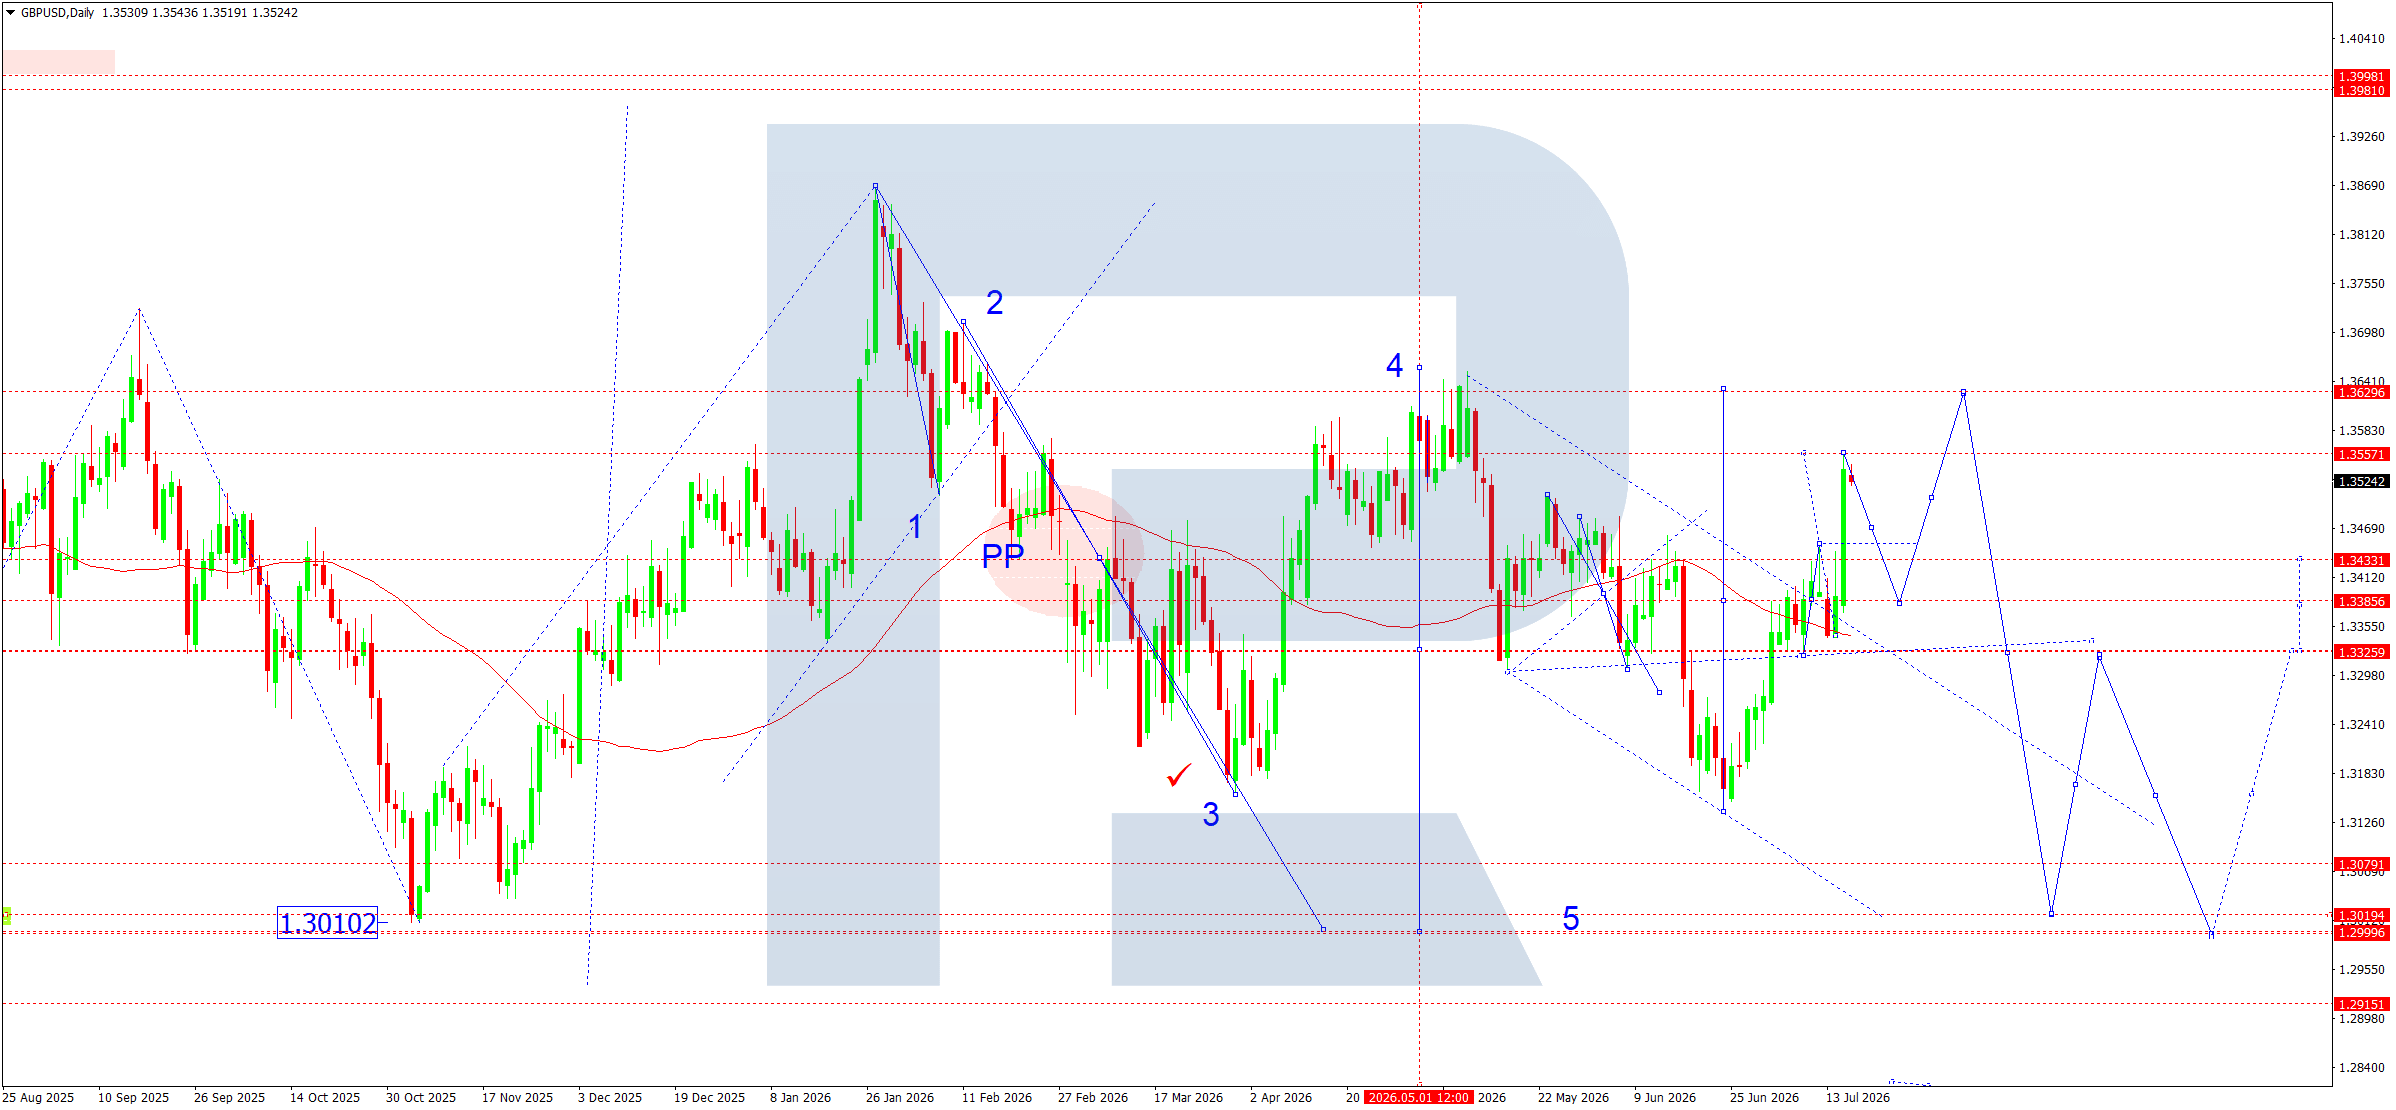
The daily GBPUSD chart continues to develop a complex corrective structure after the completion of the previous impulse wave. The price continues to trade within a descending corrective channel, although a local upward correction has formed over the past few trading days.
The pivot point (PP) near 1.3433 remains the key area. This zone acts as the main reference point for determining the next direction. The SMA50 moving average passes almost directly through the consolidation area, confirming the absence of a clear medium-term trend.
According to the Elliott wave structure, the market has completed the previous downward wave and is forming a corrective phase. The price will likely continue rising towards the 1.3557 resistance in the coming days. If buyers consolidate successfully above this level, they will be able to test the next target at 1.3629, where the upper boundary of the projected corrective pattern lies.
However, the primary chart structure remains bearish. The chart continues to indicate the possibility that the corrective rise will end and a new downward wave will subsequently form. After the rise towards the 1.3557–1.3629 area ends, selling pressure is expected to resume, initially targeting 1.3326. A breakout below this support will increase the probability of a decline towards the 1.3019 zone, which coincides with the long-term target area of the fifth wave and the lower boundary of the projected channel.
Therefore, the current rise remains a corrective phase within a larger downward structure. Only a firm consolidation above 1.3629 could significantly weaken the bearish scenario and open the way for a deeper upward correction.
GBPUSD forecast scenarios
Bearish scenario (primary): the corrective rise is expected to end within the 1.3557–1.3629 range. After a reversal pattern forms, the price will likely decline towards 1.3326. A breakout below the support will make the 1.3019 area the next target.
Bullish scenario (alternative): if the market consolidates firmly above 1.3557 and demand remains strong, the rise may continue towards 1.3629, followed by an attempt to develop a larger upward correction.
AUDUSD forecast
The Australian dollar ends the week amid persistent uncertainty across global financial markets. Changing expectations regarding the US Federal Reserve’s future policy remain the main factor for AUDUSD. Following the release of weaker US inflation data, market participants significantly reduced the probability of an imminent interest rate increase, putting pressure on the US dollar and allowing the Australian currency to recover some ground. US government bond yields also declined, supporting demand for higher-risk assets.
The stabilisation of sentiment across global equity markets and the gradual easing of concerns about a further escalation of the conflict in the Middle East provide additional support to the Australian dollar. However, persistent uncertainty surrounding the outlook for the Chinese economy limits the positive impact. As Australia is one of the largest exporters of commodities to China, any signs of weakening Chinese demand could rapidly worsen the outlook for the national currency. Next week, investors will continue to closely assess US macroeconomic statistics, Chinese data, and comments from Fed officials, which could materially change monetary policy expectations. The Reserve Bank of Australia continues to maintain a cautious stance, keeping its interest rate unchanged and awaiting new inflation data before making further decisions.
AUDUSD technical analysis
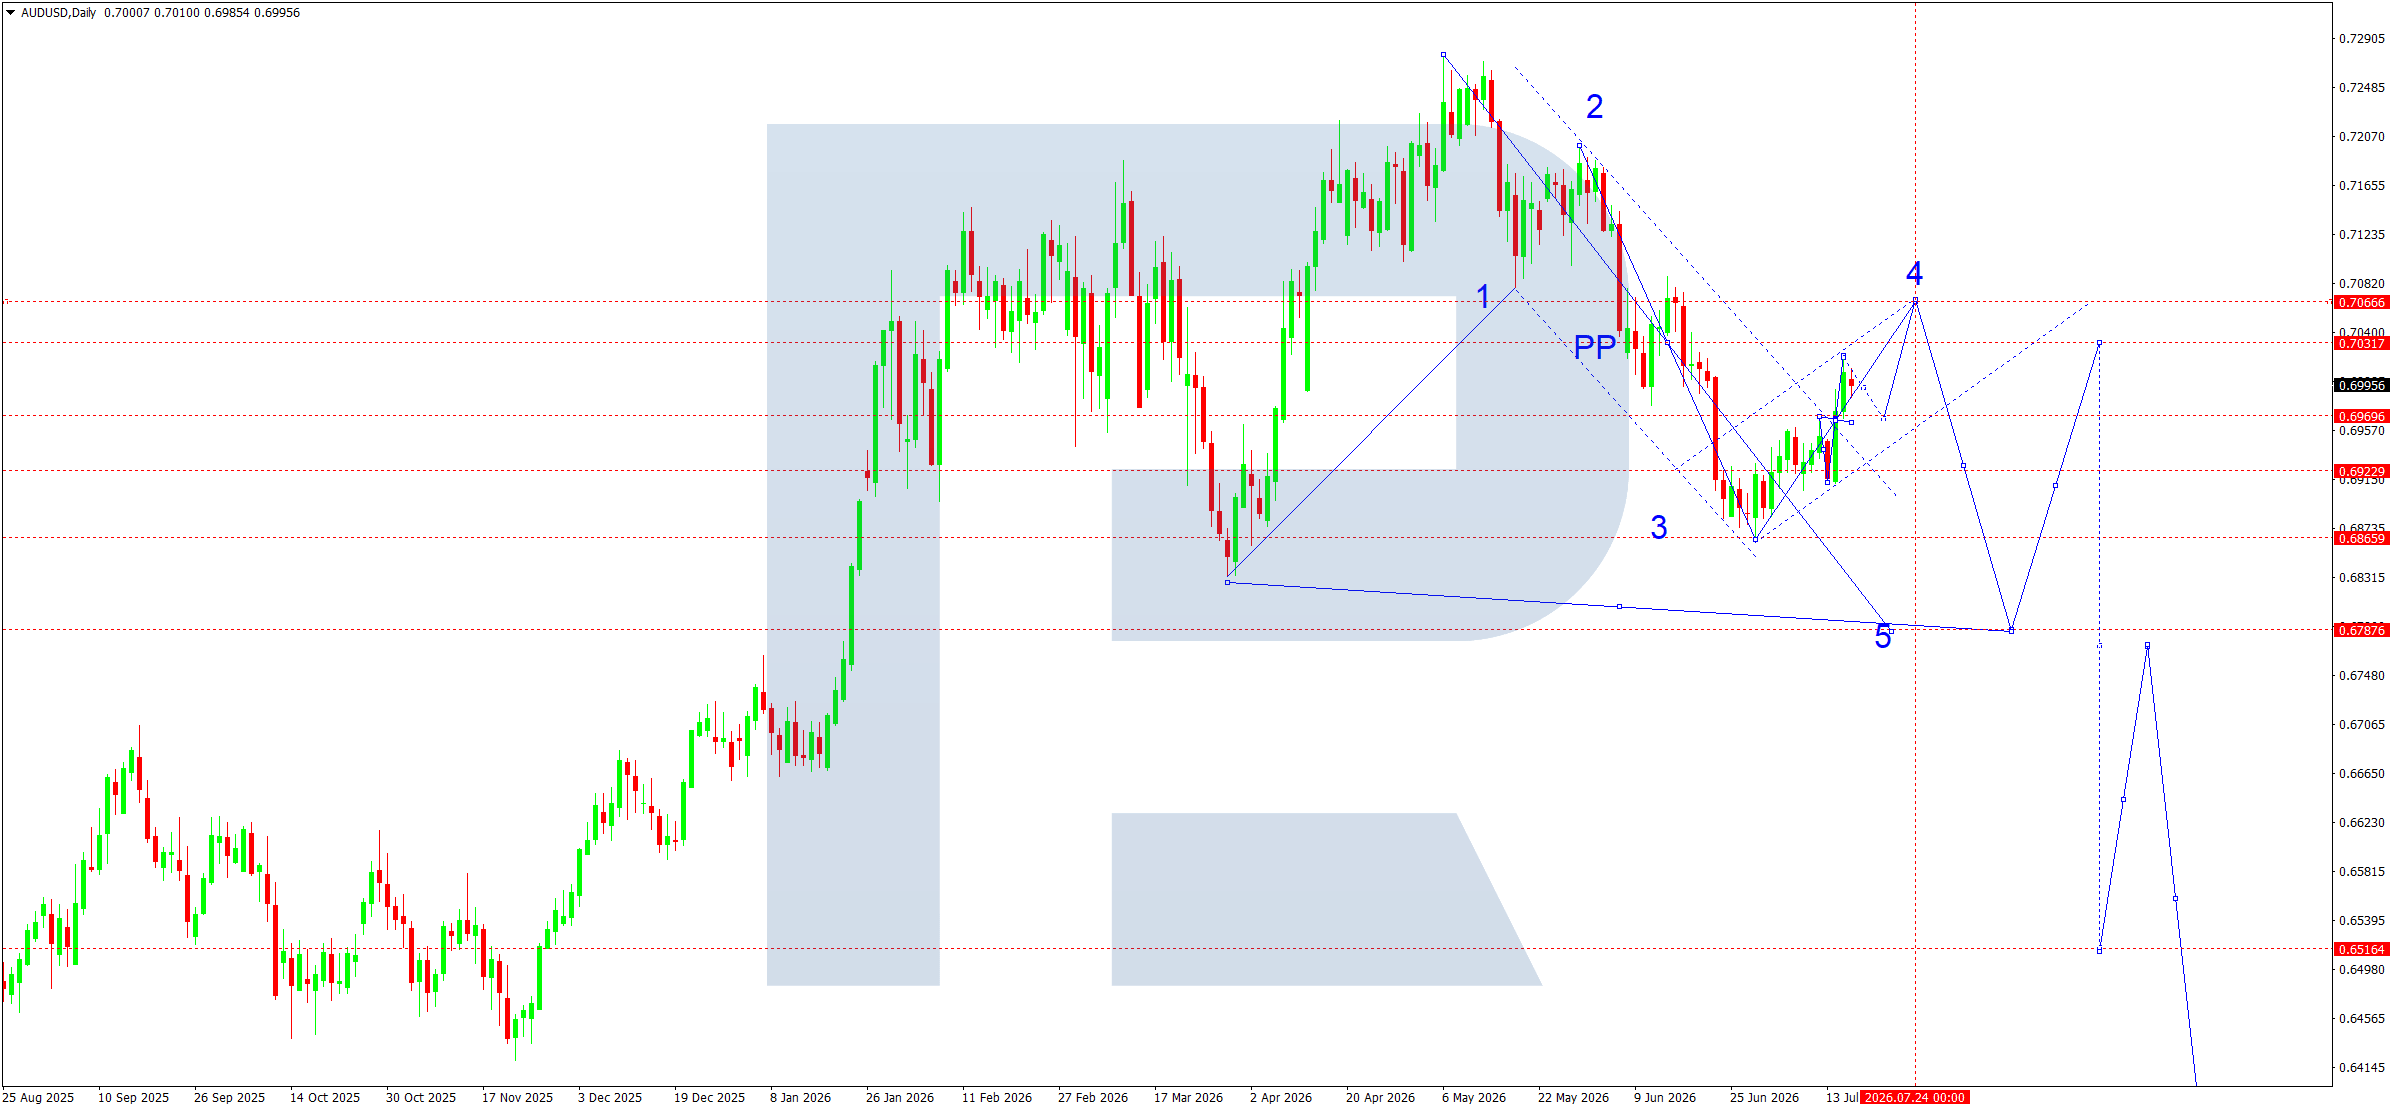
From a technical perspective, AUDUSD continues to form a corrective structure after completing a downward wave. On the daily chart, the price consolidated above the 0.6873 support, allowing it to develop a local recovery towards the PP pivot area. The market is currently testing the 0.6996 resistance, which acts as the key boundary between a continuation of the correction and a resumption of the primary downward movement.
According to the Elliott wave structure, a corrective pattern is developing, with wave 4 potentially ending in the 0.7066–0.7070 area. A strong resistance zone lies here, coinciding with the upper boundary of the local channel and the projected correction target. As long as the price remains below this area, sellers retain the medium-term advantage.
If pressure persists near the PP, a new downward wave 5 will likely form. The 0.6873 level represents the first downside target. If sellers break firmly below this level, they will be able to test the 0.6788 support, which represents the primary target of the current wave structure. A deeper correction may develop after the entire five-wave pattern ends, although this scenario remains premature for now.
The indicator picture also supports a cautious approach. The price continues to trade below the key resistance area, while the recovery remains corrective. It is premature to discuss the formation of a new uptrend until the price moves above 0.7066.
AUDUSD forecast scenarios
Bearish scenario (base case): after the local correction ends in the 0.6996–0.7066 area, the decline is expected to resume towards 0.6873, followed by the development of an impulse towards 0.6788.
Bullish scenario (alternative): if the market consolidates firmly above 0.7066, a continuation of the corrective rise towards 0.7070 may be considered, with the possibility of a broader upward movement.
USDCAD forecast
The USDCAD pair begins the new trading week amid a mixed fundamental backdrop. The Bank of Canada’s decision was the main event of the past week. The central bank kept its interest rate unchanged at 2.2500%, confirming a cautious approach towards future monetary policy. The regulator noted the economy’s gradual recovery but emphasised that inflation risks associated with geopolitics and energy price dynamics remain high.
In the US, pressure on the dollar intensified after the release of softer inflation data. The market revised its expectations regarding the Federal Reserve’s future actions, reducing the probability of an imminent interest rate increase. Lower US bond yields put pressure on the US dollar, although persistent uncertainty surrounding the situation in the Middle East continues to support demand for safe-haven assets.
The oil market remains an additional factor for the Canadian dollar. Despite persistent geopolitical tensions, oil prices stabilised after their recent rise, providing moderate support to the Canadian currency. In the upcoming week, investors will closely monitor new US macroeconomic releases, oil price dynamics, and comments from Fed officials, which may determine the pair’s next direction.
USDCAD technical analysis
The daily USDCAD chart maintains a medium-term upward structure. After completing impulse wave 3 near 1.4248, the market entered a corrective decline, forming Elliott wave 4.
The price is currently approaching the important 1.4040–1.4007 support zone, which coincides with the previous consolidation area and represents the first point of buyer interest. Stronger support lies lower at 1.3895–1.3831, where the lower boundary of the constructed channel passes and the projected corrective pattern ends.
The SMA50 moving average continues to rise firmly and lies significantly below current quotations, confirming the persistence of the long-term uptrend. As long as the price remains above the SMA50, the decline should be viewed as a correction within a larger bullish structure.
According to the wave structure, the concluding wave 4 should create a base for the formation of a new impulse wave 5. The 1.4324 area represents the primary upside target, coinciding with the upper boundary of the long-term channel and the projected Elliott wave target.
The 1.4075–1.4141 range remains intermediate resistance. Consolidation above this area will provide the first technical confirmation that the correction has ended and the upward impulse has resumed. If selling pressure persists, the market may test 1.3895, where demand is expected to strengthen and a reversal pattern may form.
The overall technical picture remains constructive for buyers. The structure of higher highs and higher lows remains intact, while the current decline appears to be a standard correction within the continuing uptrend.
USDCAD forecast scenarios
Bullish (base case): the correction is expected to end within the 1.4040–1.4007 range. After a reversal structure forms, the price will likely resume its rise towards 1.4141, followed by a move towards 1.4324.
Bearish (alternative): if the market consolidates firmly below 1.4007, the probability of a continued decline towards the 1.3895 area and subsequently 1.3831 will increase, where the entire corrective wave 4 may end.
XAUUSD forecast
Several fundamental factors will influence gold in the upcoming week. The combination of geopolitical risks in the Middle East and expectations regarding the US Federal Reserve’s future policy remains the market’s main theme. A new escalation of the conflict involving Iran caused oil prices to rise, intensifying concerns about another acceleration in inflation. This creates a mixed situation for the gold market: demand for safe-haven assets remains high, while rising inflation expectations increase the probability of interest rates remaining elevated, putting pressure on the precious metal’s price.
The latest US inflation data remain an additional factor. Despite some signs of easing price pressure, market participants believe that higher energy prices could alter the inflation picture again in the second half of the year. Investors will therefore scrutinise any comments from Fed officials for possible changes in monetary policy.
As a result, the fundamental backdrop remains mixed. Geopolitical developments continue to support demand for safe-haven assets, although the strong dollar and persistently high US bond yields limit gold’s recovery potential. The market therefore maintains elevated volatility and has yet to demonstrate a sustainable upward reversal.
XAUUSD technical analysis
The daily XAUUSD chart maintains a stable downtrend. The price continues to form a sequence of lower highs and lower lows, remaining significantly below the SMA50 moving average, which acts as dynamic resistance.
After a sharp decline from the January high, the market gradually formed several downward impulses under the Elliott wave structure. The latest downward wave brought the price into the strong 3,917 support area, where consolidation began. Over the past few weeks, gold has formed a sideways range between 3,917 and 4,145, indicating position accumulation ahead of the next impulse.
According to the structure shown on the chart, 3,917 represents the primary pivot point of the current model. As long as quotations remain above this support, the probability of an upward corrective wave gradually increases. The projected model indicates that the downward wave may end and give way to an upward correction, initially targeting the 4,400 area. If buying activity develops further, the 4,758 area, where a strong previous selling zone lies, may become the next medium-term target.
However, it remains premature to discuss a full reversal. The price remains below the SMA50, and active selling accompanied every previous rise. To confirm a trend reversal, buyers must consolidate above the 4,145 resistance, after which the price may test 4,400.
If the US dollar strengthens again or the Fed issues new hawkish comments, pressure on gold may resume. The market would then retest the 3,917 support. A breakout below this level will open the way for the next downward wave and an expansion of the decline.
XAUUSD forecast scenarios
Bearish (base case): consolidation is expected to continue near 4,060, followed by a test of the 3,917 support. A firm consolidation below this level may give the downtrend renewed momentum.
Bullish (alternative): if buyers consolidate above 4,145 on rising volumes, the probability of a corrective rise towards 4,400 and subsequently the 4,758 area will increase.
Brent forecast
The oil market ends the week amid persistently high volatility. Geopolitical tensions in the Middle East remain the main factor and continue to influence market expectations regarding supply stability. Despite a partial recovery in export flows, the risks of new disruptions in the region remain high, supporting the risk premium in Brent quotations. At the same time, the market closely assesses US commercial crude oil inventory data, which continue to show declines and indicate resilient demand during the summer season.
OPEC+ policy also exerts additional influence. The organisation confirmed its intention to gradually adjust production volumes while retaining the ability to change its strategy quickly if market conditions deteriorate. This approach helps maintain a balance between supply and demand but also limits the potential for a sharp price increase.
Investors also continue to monitor the global economic outlook. Weaker forecasts for global oil demand growth put pressure on long-term expectations, although geopolitical risks and falling inventories currently offset this effect in the short term. Therefore, developments in oil supplies, the situation in the Middle East, and new macroeconomic data from the US and China will likely influence the upcoming week.
Brent technical analysis
The daily Brent chart shows a firm rebound after the price reached the 70.24 support area. The downward impulse wave ended at this level, after which quotations began to recover. The market has now approached the first important resistance at 85.98, where traders are taking profits after the latest upward wave.
According to the Elliott wave structure, the current movement may represent the development of the first corrective wave after the strong downward impulse ended. The 91.00 area remains the primary target for buyers, where an important horizontal resistance level and the upper boundary of the local structure coincide. Consolidation above 91.00 will significantly improve the technical picture and open the way towards the next target at 96.00–97.00.
The SMA50 moving average remains above the current price, indicating that the medium-term downtrend persists. However, the distance between the price and the average has narrowed significantly. If Brent consolidates above the SMA50, this will provide the first technical confirmation of a deeper upward correction.
At the same time, the 85.98–91.00 area represents a strong resistance zone. Previous lows, descending channel lines, and the projected correction trajectory converge here. Therefore, the probability of a local pullback after reaching this zone remains relatively high.
If a corrective decline occurs, 80.62 will become the most important support. Holding above this level will preserve the current upward scenario. A deeper decline towards 75.27 also remains possible within the formation of the second corrective wave before another stage of growth.
Overall, the chart structure indicates that the market is shifting from an impulsive decline into a recovery phase, although a firm consolidation above 91.00 will provide the final confirmation of a trend reversal.
Brent forecast scenarios
Bearish (base case): after consolidating above 85.98, the market will continue rising towards 91.00. Following a possible correction towards 85.98, the upward movement is expected to resume, with the prospect of a new growth wave.
Bullish (alternative): if Brent fails to overcome the 85.98 resistance and returns below 80.62, the probability of a decline towards 75.27, followed by another test of the 70.24 area, will increase.
BTCUSD forecast
Several fundamental factors will influence Bitcoin in the upcoming week. Market participants remain focused on expectations regarding the Fed's future actions, US inflation dynamics, and institutional investor activity through spot Bitcoin ETFs. Despite persistent hawkish rhetoric from Fed officials, the latest inflation data somewhat eased concerns about further monetary policy tightening, supporting high-risk assets, including cryptocurrencies.
The renewed inflow of capital into US spot Bitcoin ETFs after an extended period of outflows provided an additional positive factor. Institutional investors have begun to show renewed interest in digital assets, although the volume of new investment remains insufficient to form a sustainable long-term uptrend. The market also closely monitors discussions regarding the regulation of the US crypto industry, as potential legislative changes could significantly affect investor sentiment.
BTCUSD technical analysis
The daily BTCUSD chart maintains a medium-term bearish structure after completing the large downward wave from the 81,000–82,000 area. However, the market has gradually entered a consolidation phase over the past few weeks.
After forming a local low near 57,400, buyers managed to return the price above the 61,300–63,000 zone, where a triangular accumulation pattern is now forming. According to the chart structure, this consolidation represents an intermediate phase before the next impulse movement.
The 63,000–64,600 area remains the key pivot point. Buyers and sellers are competing for control in this area. As long as the price remains above the 63,000 support, the probability of a continued recovery wave remains high.
The 64,600 resistance represents the nearest target for buyers. A firm breakout above this level will open the way towards the next reference point at 68,700, which coincides with the upper boundary of the local pattern and the intermediate resistance level under the Elliott wave structure. This zone may become the target of the final corrective wave before a new medium-term movement forms.
The overall long-term structure remains downwards. The upper boundary of the primary channel lies significantly above current prices, although the chart also retains an alternative downward trajectory that assumes selling will resume after the current recovery ends.
Momentum indicators are gradually stabilising after the sharp June sell-off, confirming that selling pressure is easing. However, the absence of strong volume during the rise indicates that the current recovery remains corrective, while a consolidation above 64,600 followed by a move towards 68,700 will provide the final confirmation of a trend reversal.
BTCUSD forecast scenarios
Bearish (base case): the market continues to consolidate above 63,000, followed by a breakout above 64,600 and the development of a recovery wave towards 68,700.
Bullish (alternative): if the price returns below 63,000 and breaks through 61,300, selling pressure will intensify, creating conditions for another decline towards 57,400.
Editors’ picks
 EURUSD forecast 2026–2027: technical analysis, price levels & predictions
EURUSD has pulled back from the 2026 high of 1.1915 and is now trading near 1.1450 — below both EMA65 and EMA200 — with the active scenario shifting from bullish to bearish. The ECB raised rates to 2.40%, but the Fed holds at 3.75%, and US inflation (3.5%) continues to outpace the eurozone (2.8%). A confirmed break below 1.1280 opens the next downward wave toward 1.1080. We break down the key levels, three trading scenarios with entry triggers, and what Deutsche Bank, Morgan Stanley and UBS are forecasting for EURUSD in 2026.
 Gold (XAUUSD) forecast 2026: predictions based on fundamental and technical analysis
Gold has corrected over 25% from its all-time high of 5,597 USD and is now trading near 4,100 USD — testing a critical support zone. Is this the bottom, or will the downtrend continue? We break down the key levels (support 3,920 USD, breakout trigger 4,500 USD), three trading scenarios with entry levels, and what J.P. Morgan, Goldman Sachs and Deutsche Bank are forecasting for gold in 2026.
Forecasts presented in this section only reflect the author’s private opinion and should not be considered as guidance for trading. RoboForex bears no responsibility for trading results based on trading recommendations described in these analytical reviews.