
Weekly technical analysis and forecast (27–31 July 2026)
In this weekly technical analysis, we examine the key chart patterns and price levels for EURUSD, USDJPY, GBPUSD, AUDUSD, USDCAD, Gold (XAUUSD), US 500, and Bitcoin (BTCUSD) to forecast market developments for the week ahead (27–31 July 2026).
Major technical levels to watch this week
- EURUSD: Support: 1.1355, 1.1310. Resistance: 1.1439, 1.1473
- USDJPY: Support: 162.34, 160.99. Resistance: 163.39, 164.15
- GBPUSD: Support: 1.3280, 1.3004. Resistance: 1.3435, 1.3557
- AUDUSD: Support: 0.6850, 0.6774. Resistance: 0.7024, 0.7037
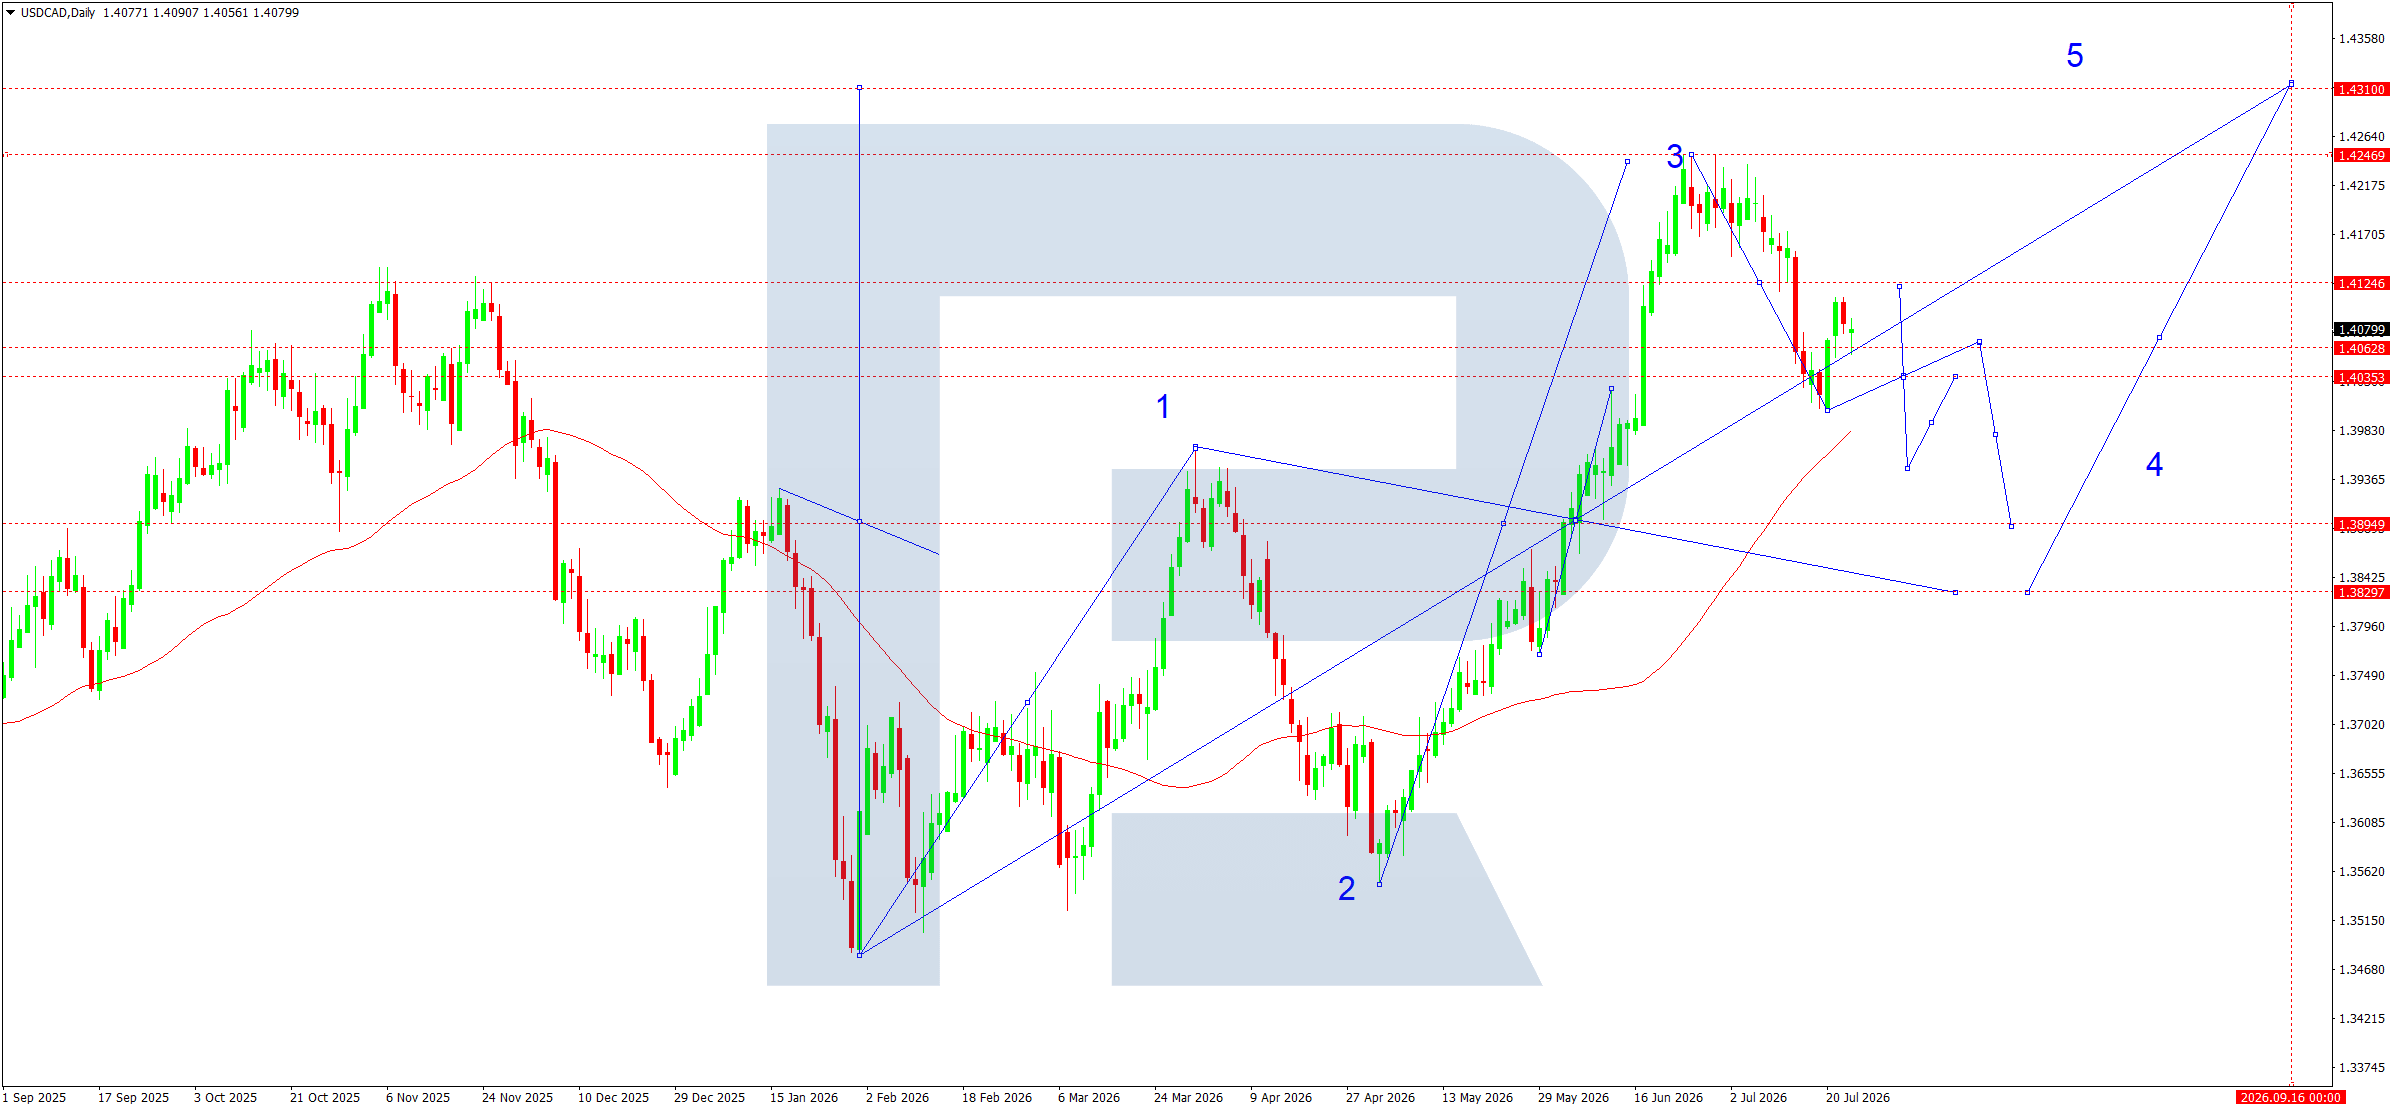
- USDCAD: Support: 1.4035, 1.3895. Resistance: 1.4125, 1.4247
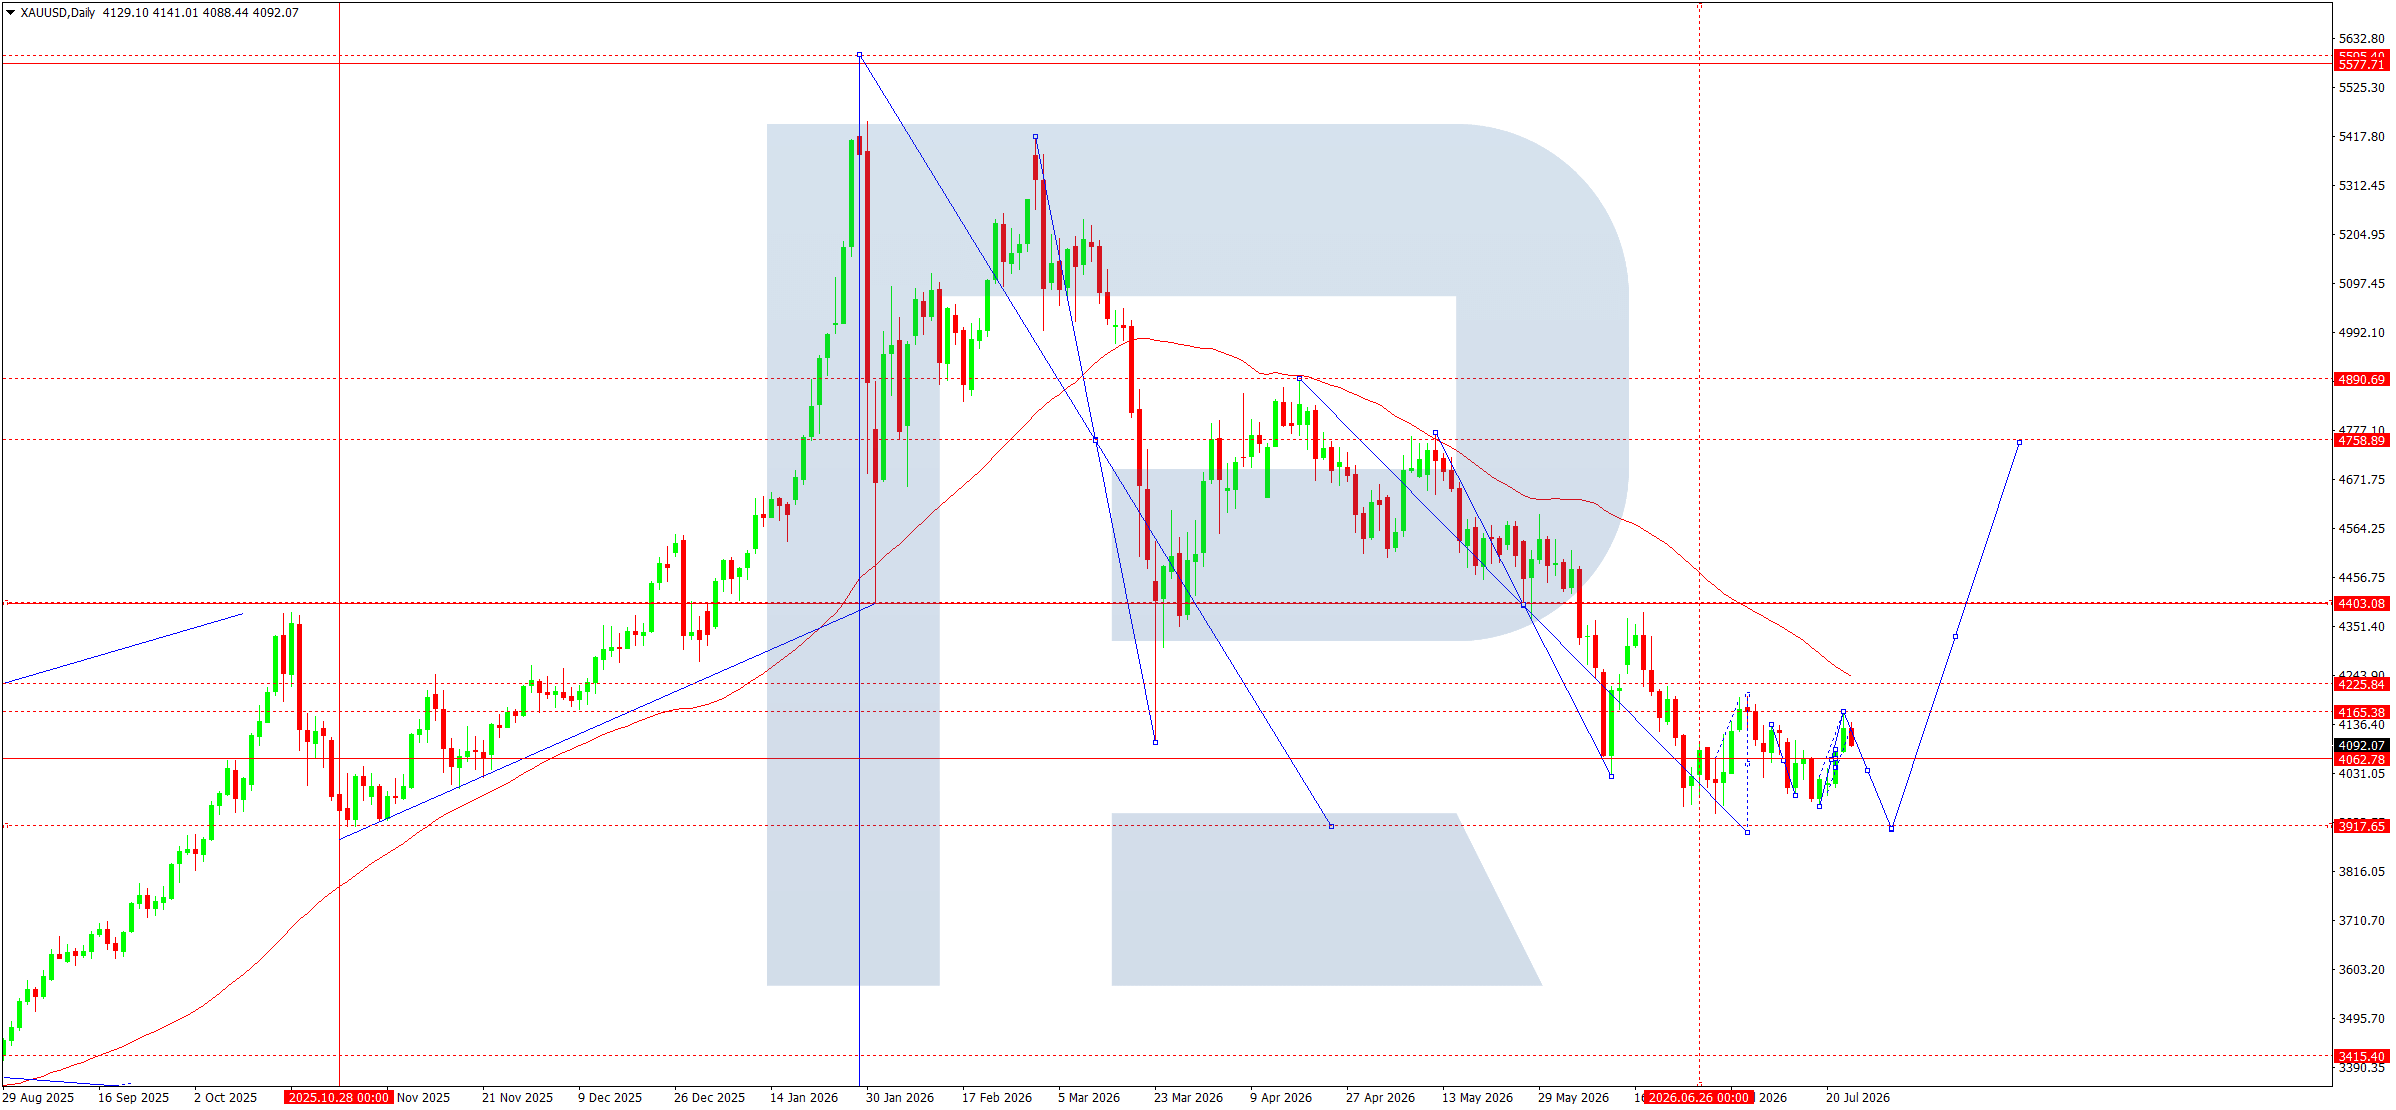
- Gold: Support: 4,062, 3,917. Resistance: 4,165, 4,403
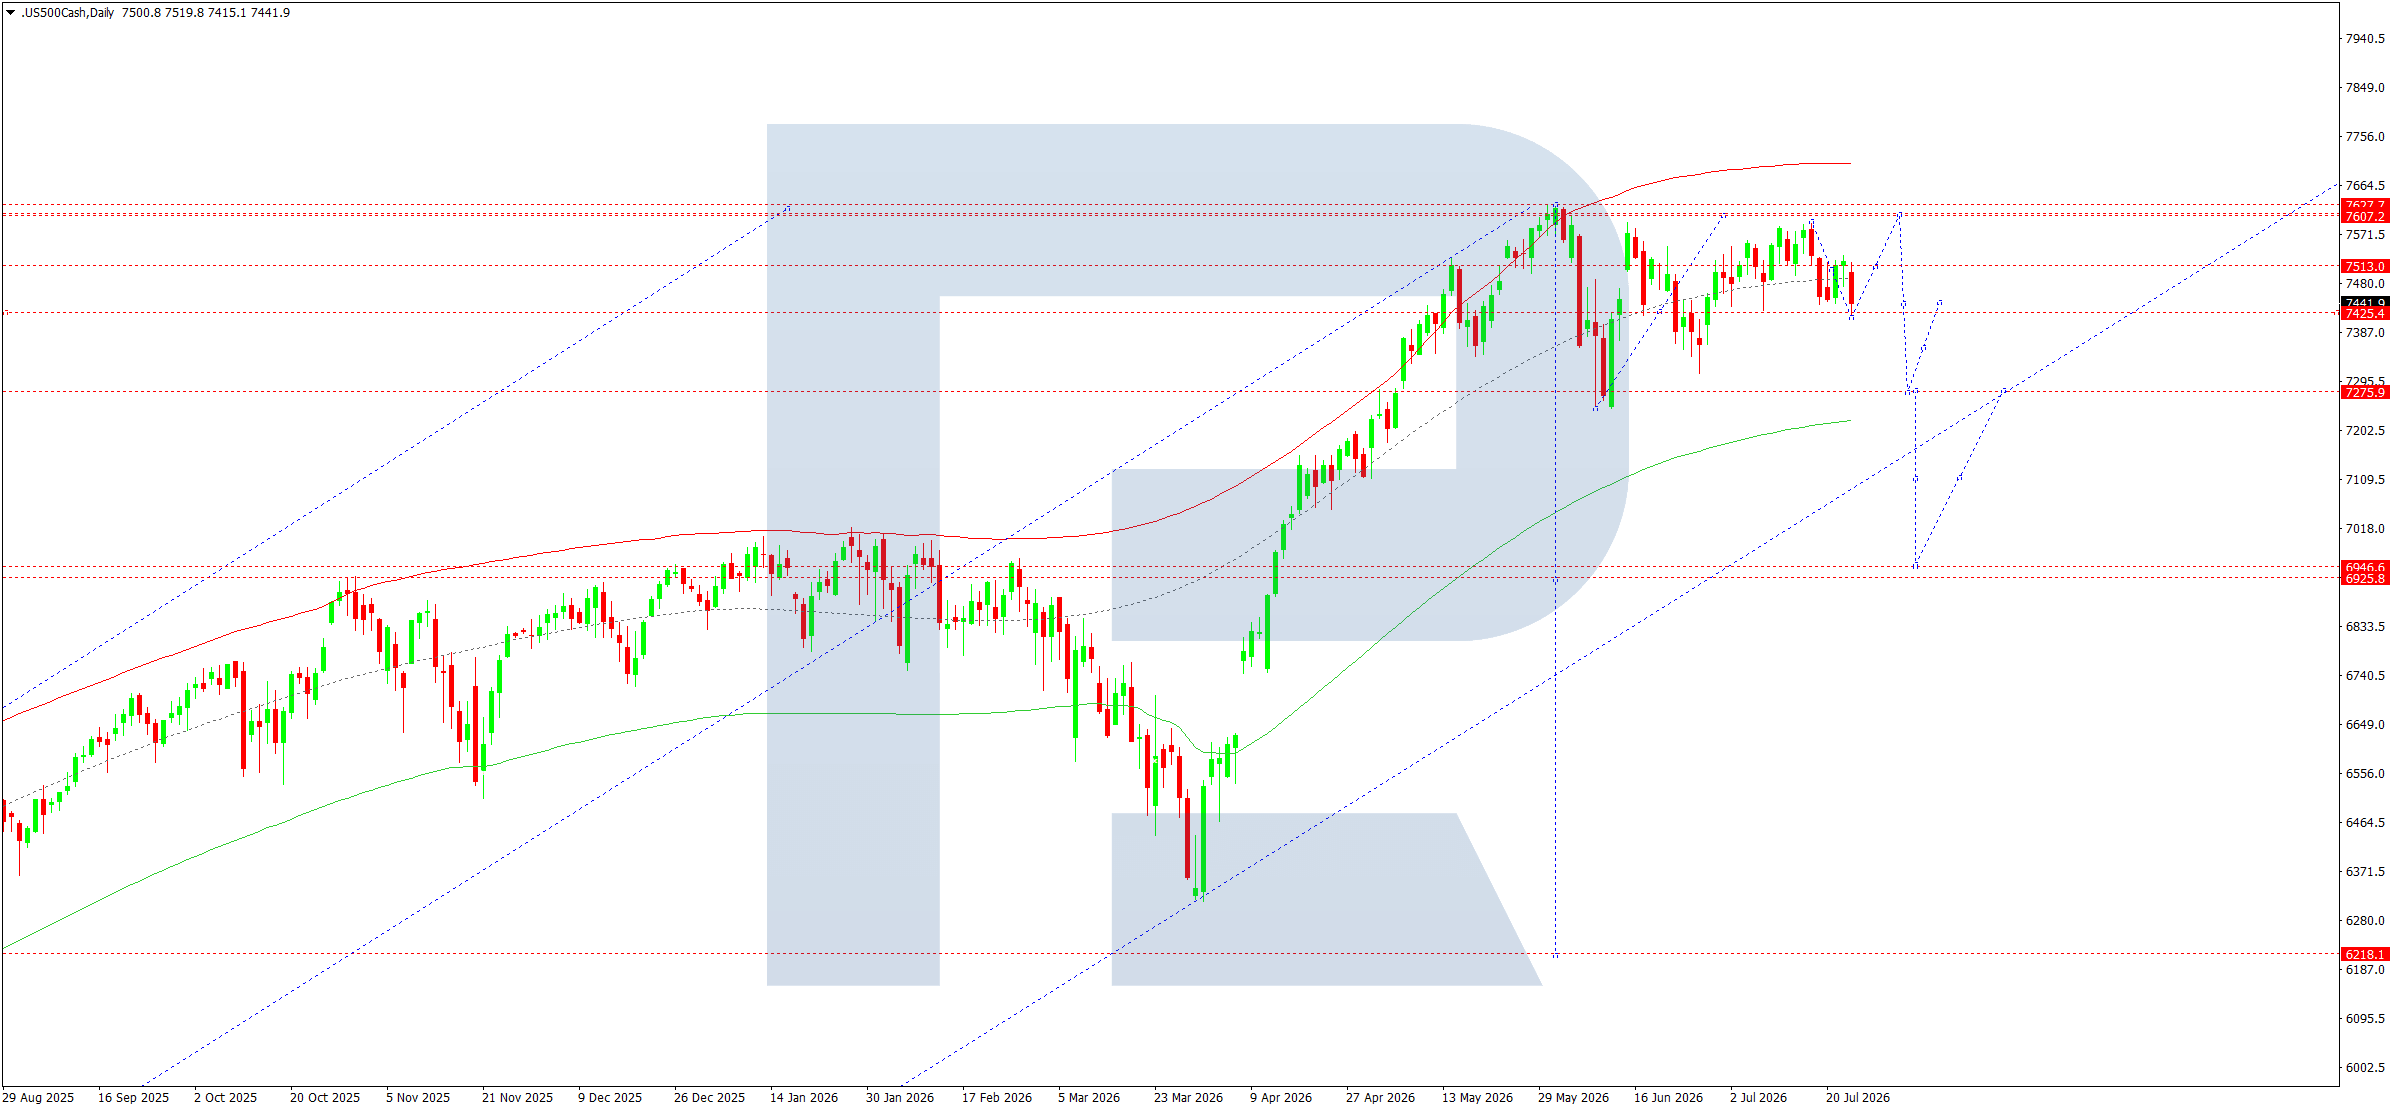
- US 500: Support: 7,441, 7,276. Resistance: 7,607, 7,665
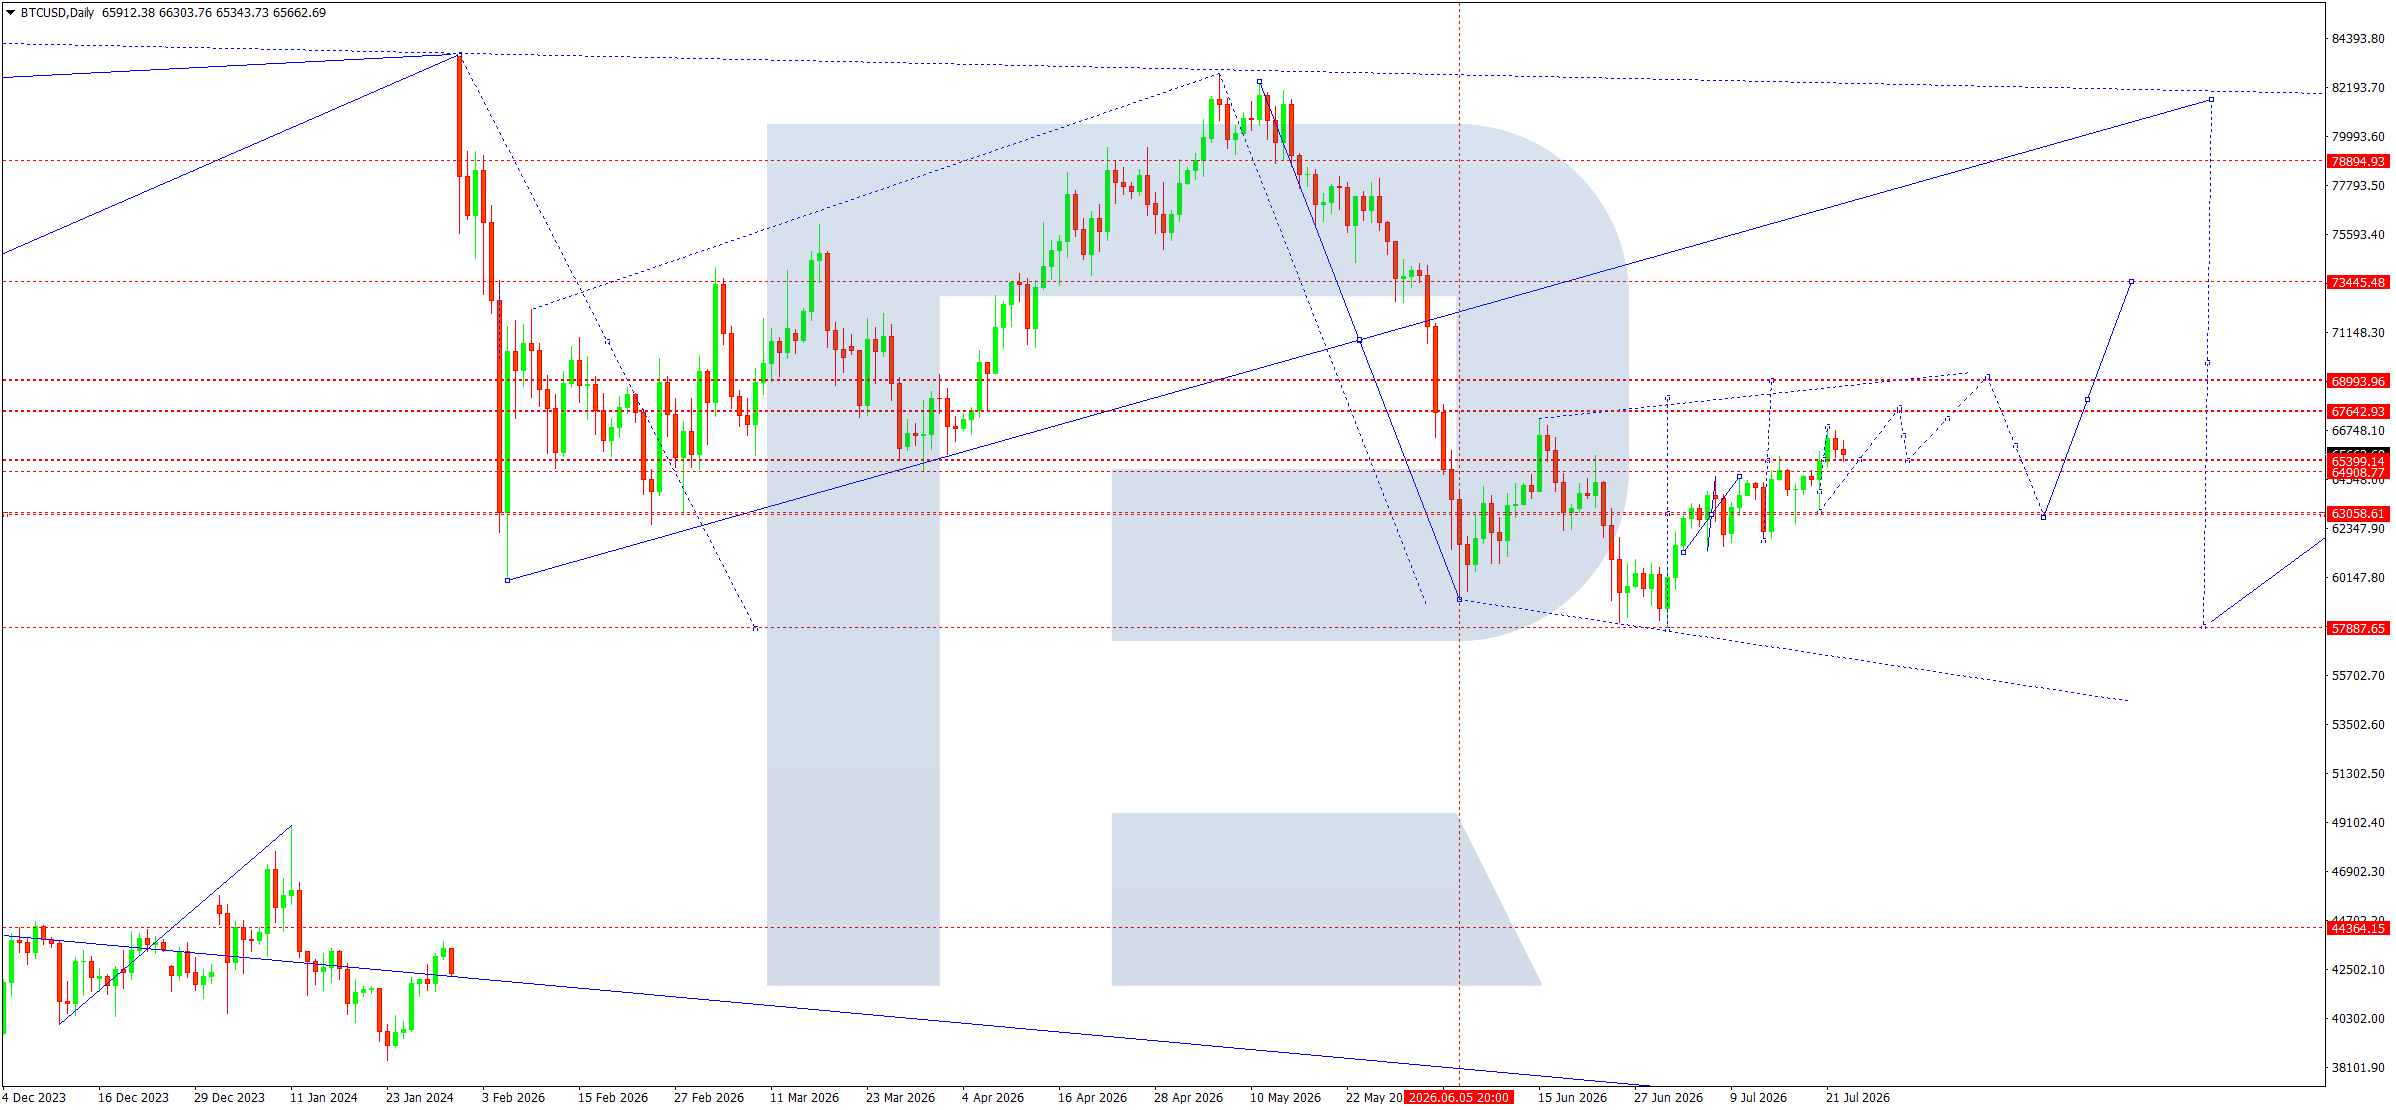
- BTCUSD: Support: 63,056; 57,888. Resistance: 67,643; 68,904
EURUSD forecast
The coming week for EURUSD will be influenced by expectations surrounding decisions from the world's major central banks and persistent geopolitical tensions. The main event remains the European Central Bank meeting, at which the market expects interest rates to remain unchanged. Investors will closely analyse comments from ECB officials regarding the future path of monetary policy. Rising energy prices due to tensions in the Middle East are once again increasing inflation risks for the eurozone, forcing the regulator to maintain a cautious but relatively hawkish stance.
In the US, market attention is gradually shifting towards the upcoming Federal Reserve meeting. Despite the continued resilience of the US economy, recent inflation data support expectations that the current interest rate will be maintained. However, a strong labour market and stable consumption continue to support the dollar, limiting the euro's upside potential. Oil-market dynamics remain an additional factor: high oil prices are increasing inflationary pressure in both Europe and the US, raising overall foreign-exchange market volatility.
EURUSD technical analysis
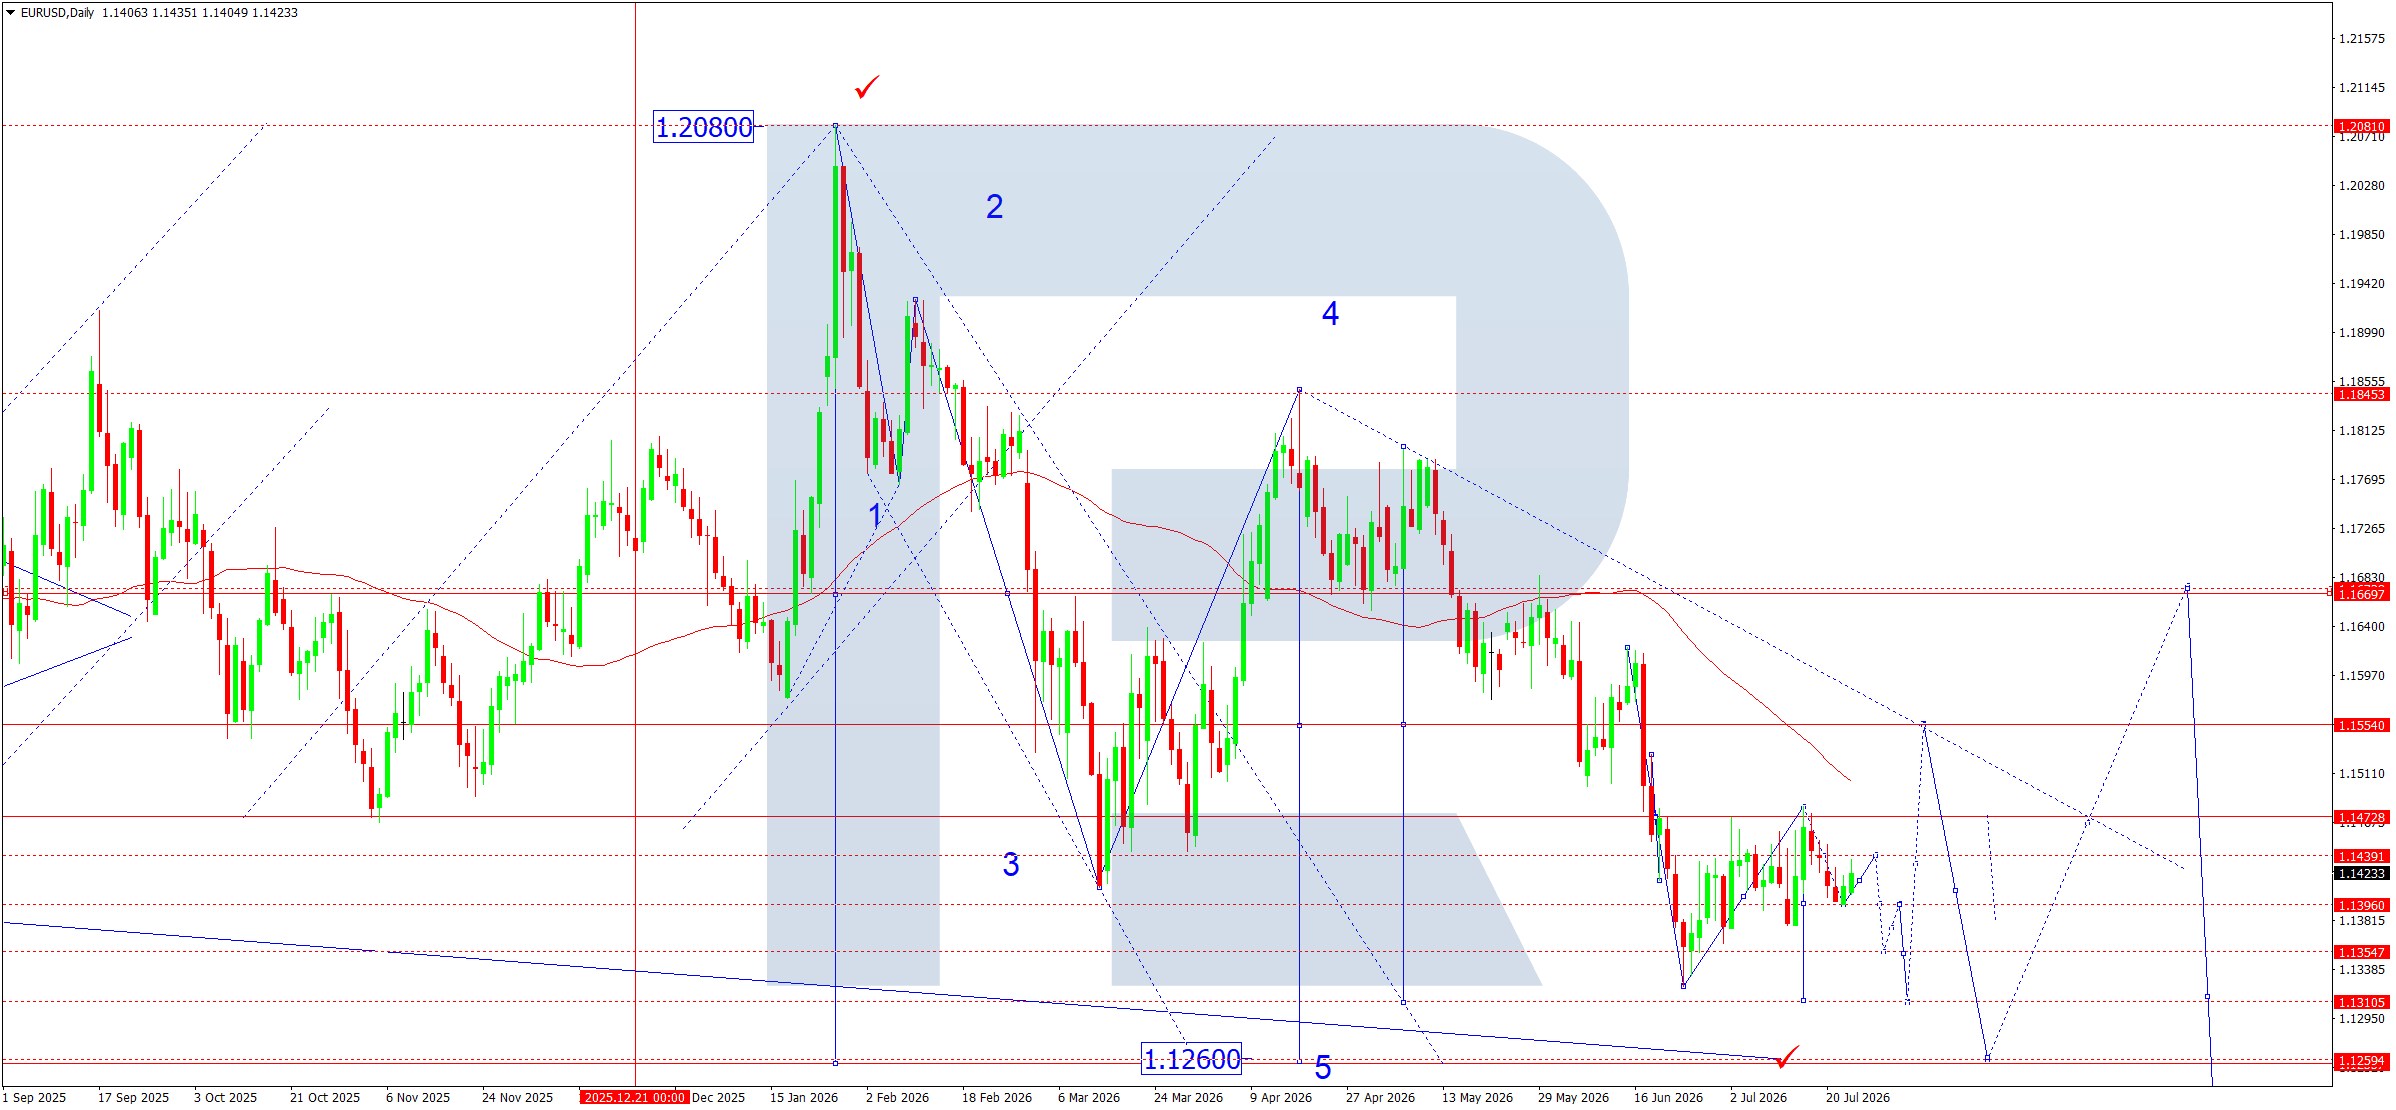
On the daily chart, EURUSD continues to develop a downward wave structure. After the completion of a large corrective fourth wave, the market continues to form the fifth downward wave. The decline halted near 1.1396, where a local consolidation zone formed.
The price is currently holding within a narrow 1.1396–1.1439 range. This range is becoming the market's pivot area for the coming trading days. As long as the quotes remain below the descending resistance line and the SMA50, sellers retain the medium-term advantage.
The nearest resistance is at 1.1439. A break above it will allow the market to develop a corrective recovery towards 1.1473, where the next technical resistance level and the upper boundary of the local corrective structure are located. However, even a rise into this area is still viewed solely as a correction within the continuing downtrend.
Buyer interest is concentrated near 1.1396. If this support is breached, the market will confirm the continuation of the fifth downward wave. The first target is 1.1355, corresponding to the nearest support zone on the chart. After a possible brief correction towards 1.1396, sellers may make another attempt to push the price down towards 1.1310, where the next strategic target of the decline is located.
The Elliott wave structure remains fully consistent with the bearish scenario. The descending channel also continues to limit recovery attempts. Until the price establishes a foothold above 1.1473, it is premature to speak of a full reversal. The base case remains the development of the final part of the fifth wave, with local lows being updated gradually.
EURUSD forecast scenarios
Bearish (base case): the market continues to consolidate around 1.1396. A downside break will open the way towards 1.1355. After a local correction towards 1.1396, the decline is expected to continue towards 1.1310.
Bullish (alternative): if buyers establish a foothold above 1.1439, the potential for a corrective rise towards 1.1473 will open. A firm break above this resistance could allow the recovery to continue towards 1.1554.
USDJPY forecast
USDJPY approaches the final week of July near multi-year highs, with market participants' attention focused almost entirely on the upcoming meetings of the US Federal Reserve and the Bank of Japan. Expectations regarding the next decisions of the two major central banks will determine the pair's direction.
In the US, investors continue to assess the resilience of the economy, inflation dynamics, and labour-market conditions. Despite some moderation in individual inflation indicators, the market still allows for the Fed to maintain a hawkish stance. High US Treasury yields and expectations that the regulator will not rush to ease monetary policy are providing additional support for the dollar.
In Japan, the situation remains the opposite. Despite the interest-rate increase in June, the weak yen continues to intensify imported inflation. Most economists expect the Bank of Japan to raise rates further by the end of the year, while the regulator's upcoming meeting may set the tone for the national currency's subsequent performance. The possibility of verbal or actual intervention by the Japanese authorities also remains if the yen weakens further.
The coming week therefore promises to be one of the most volatile in recent times, as any shift in expectations regarding Fed or BoJ policy could trigger sharp movements in USDJPY.
USDJPY technical analysis
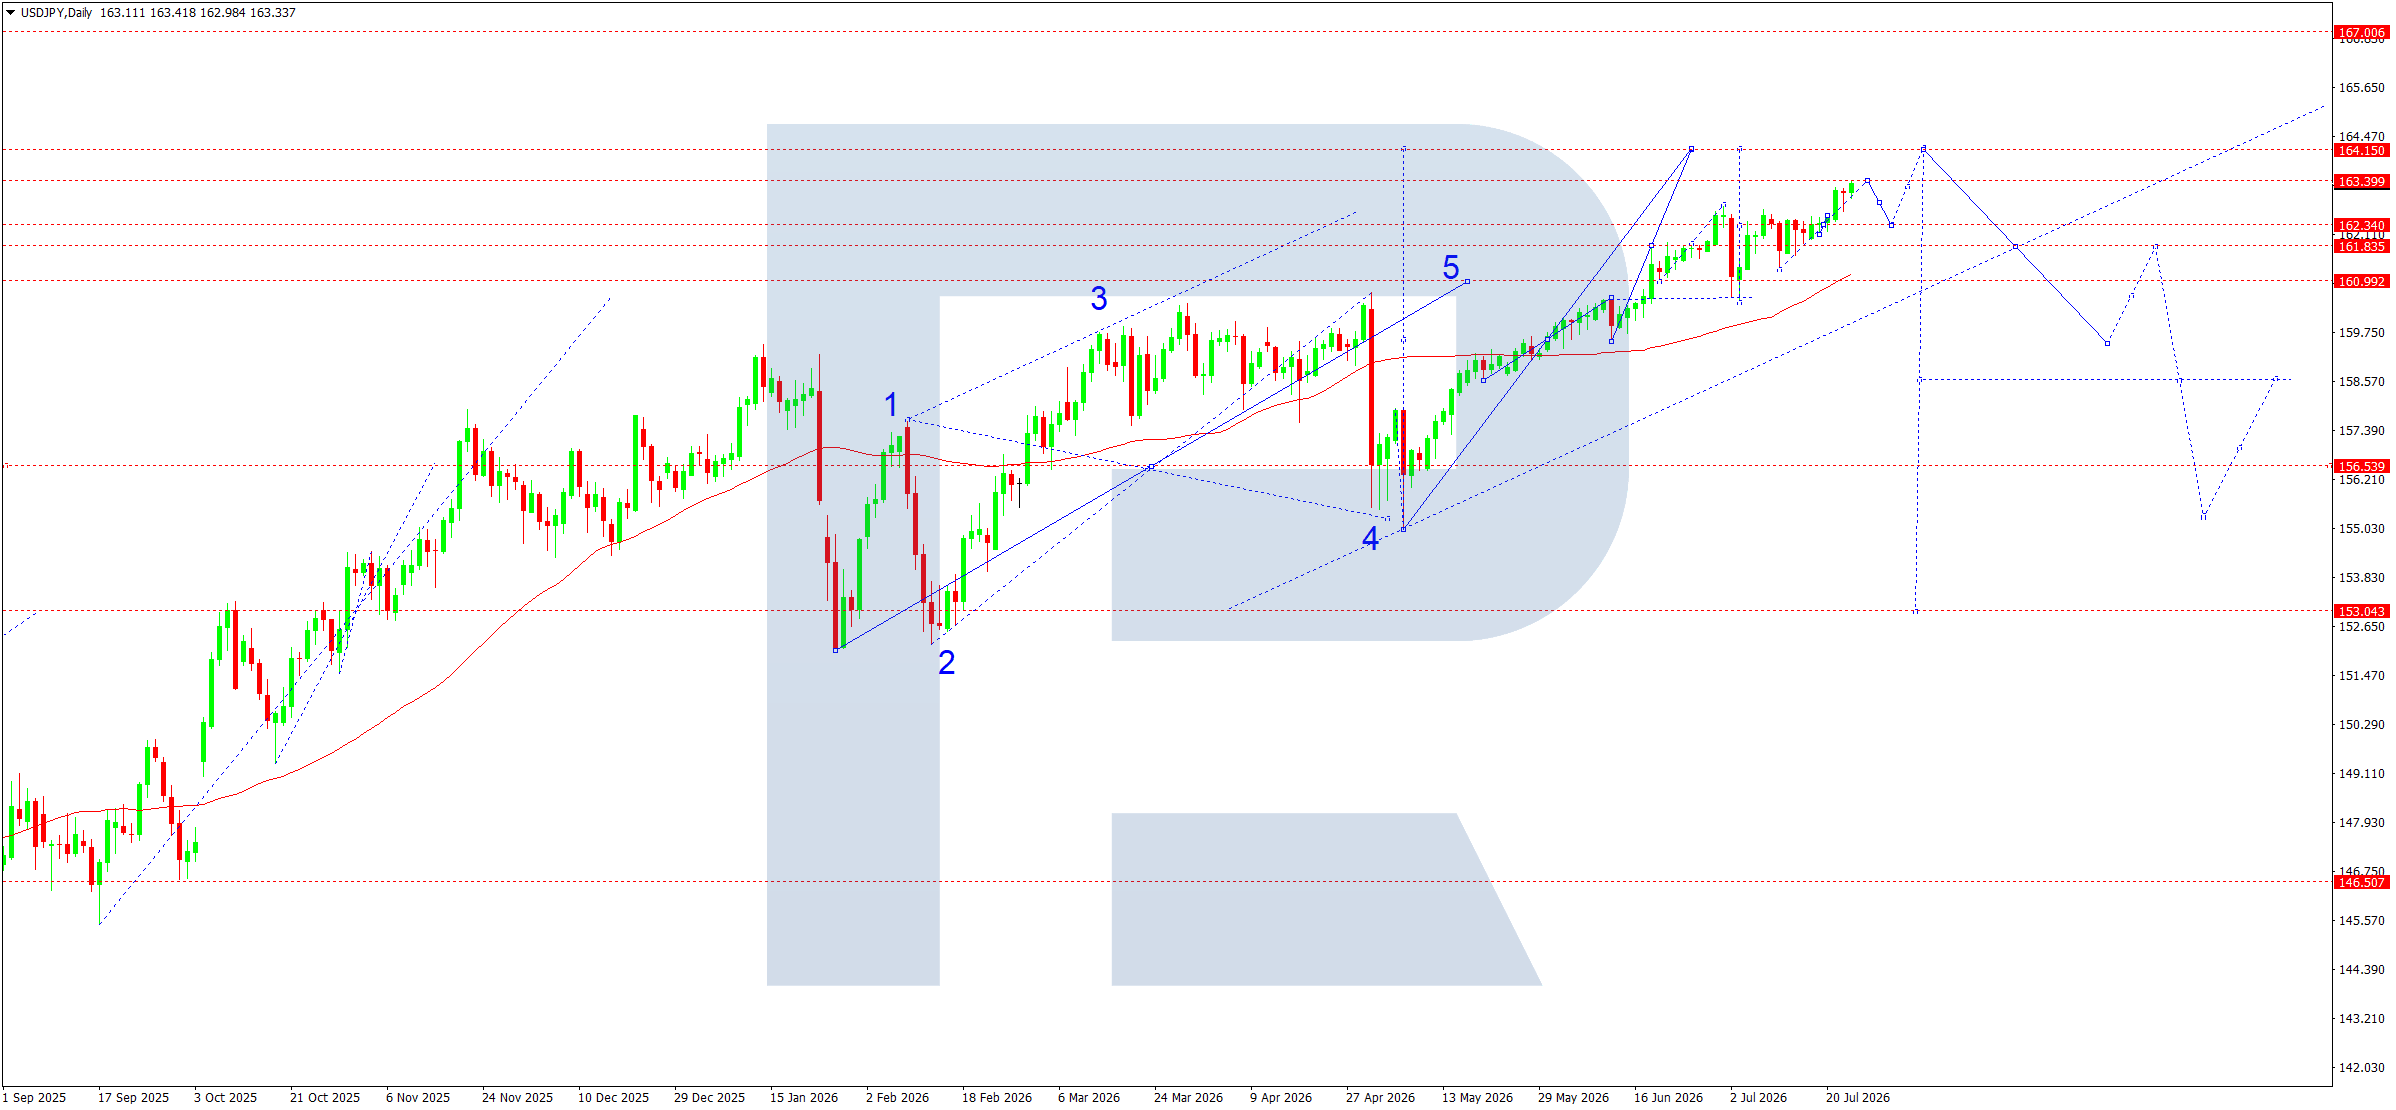
The daily chart maintains a steady uptrend. The price continues to form a sequence of higher highs and higher lows, remaining well above the SMA50, which acts as dynamic support for the long-term movement.
According to the Elliott wave structure, the market has completed a large fifth impulsive wave, reaching the 163.39–164.15 resistance area. This range is now the main battleground between buyers and sellers.
After reaching a local high, the price entered a consolidation phase near 162.34. The chart clearly shows the formation of a local range that may serve either as a base for continued growth or as the starting point for a deeper correction.
The matrix pivot point is located near 162.34. As long as the price remains above it, the medium-term structure stays bullish. If demand persists, buyers may retest resistance at 163.39. A firm hold above this level will open the way towards 164.15 and then the strategic target at 164.47.
At the same time, the chart also indicates an alternative scenario. A failure to establish a foothold above 163.39 could trigger a corrective wave. The first downside target will be the 160.99 area, where important intermediate support is located. Below it lies 158.57, coinciding with the lower boundary of the projected ascending channel. This zone may become the area where the correction ends before the long-term uptrend resumes.
The overall technical picture remains positive: the price is within an ascending channel, the SMA50 is pointing upwards, and the structure of highs remains intact. However, the proximity of strong resistance levels and expectations surrounding central-bank decisions significantly increase the likelihood of sharp moves in both directions.
USDJPY forecast scenarios
Bullish (base case): the market holds above 162.34 and, after a brief consolidation, breaks through 163.39. In this case, growth is likely to continue towards 164.15, with the prospect of testing 164.47.
Bearish (alternative): if the price establishes a foothold below 162.34 and breaks support at 160.99, the likelihood of a correction towards 158.57 will increase.
GBPUSD forecast
The coming week for GBPUSD will be shaped by expectations surrounding decisions from two key central banks: the US Federal Reserve and the Bank of England, whose meetings will take place at the end of July. Investors continue to assess the likelihood that tight US monetary policy will be maintained amid persistent inflation and rising energy prices. Geopolitical tensions in the Middle East and continued strong demand for safe-haven assets are providing additional support for the US currency.
In the UK, inflation continues to slow but remains above the target. This reduces pressure on the BoE, although the regulator remains cautious given the risk that rising oil prices could cause inflation to accelerate again. Until the central-bank decisions are announced, the market is likely to remain sensitive to business-activity data and expectations regarding the future path of interest rates.
GBPUSD technical analysis
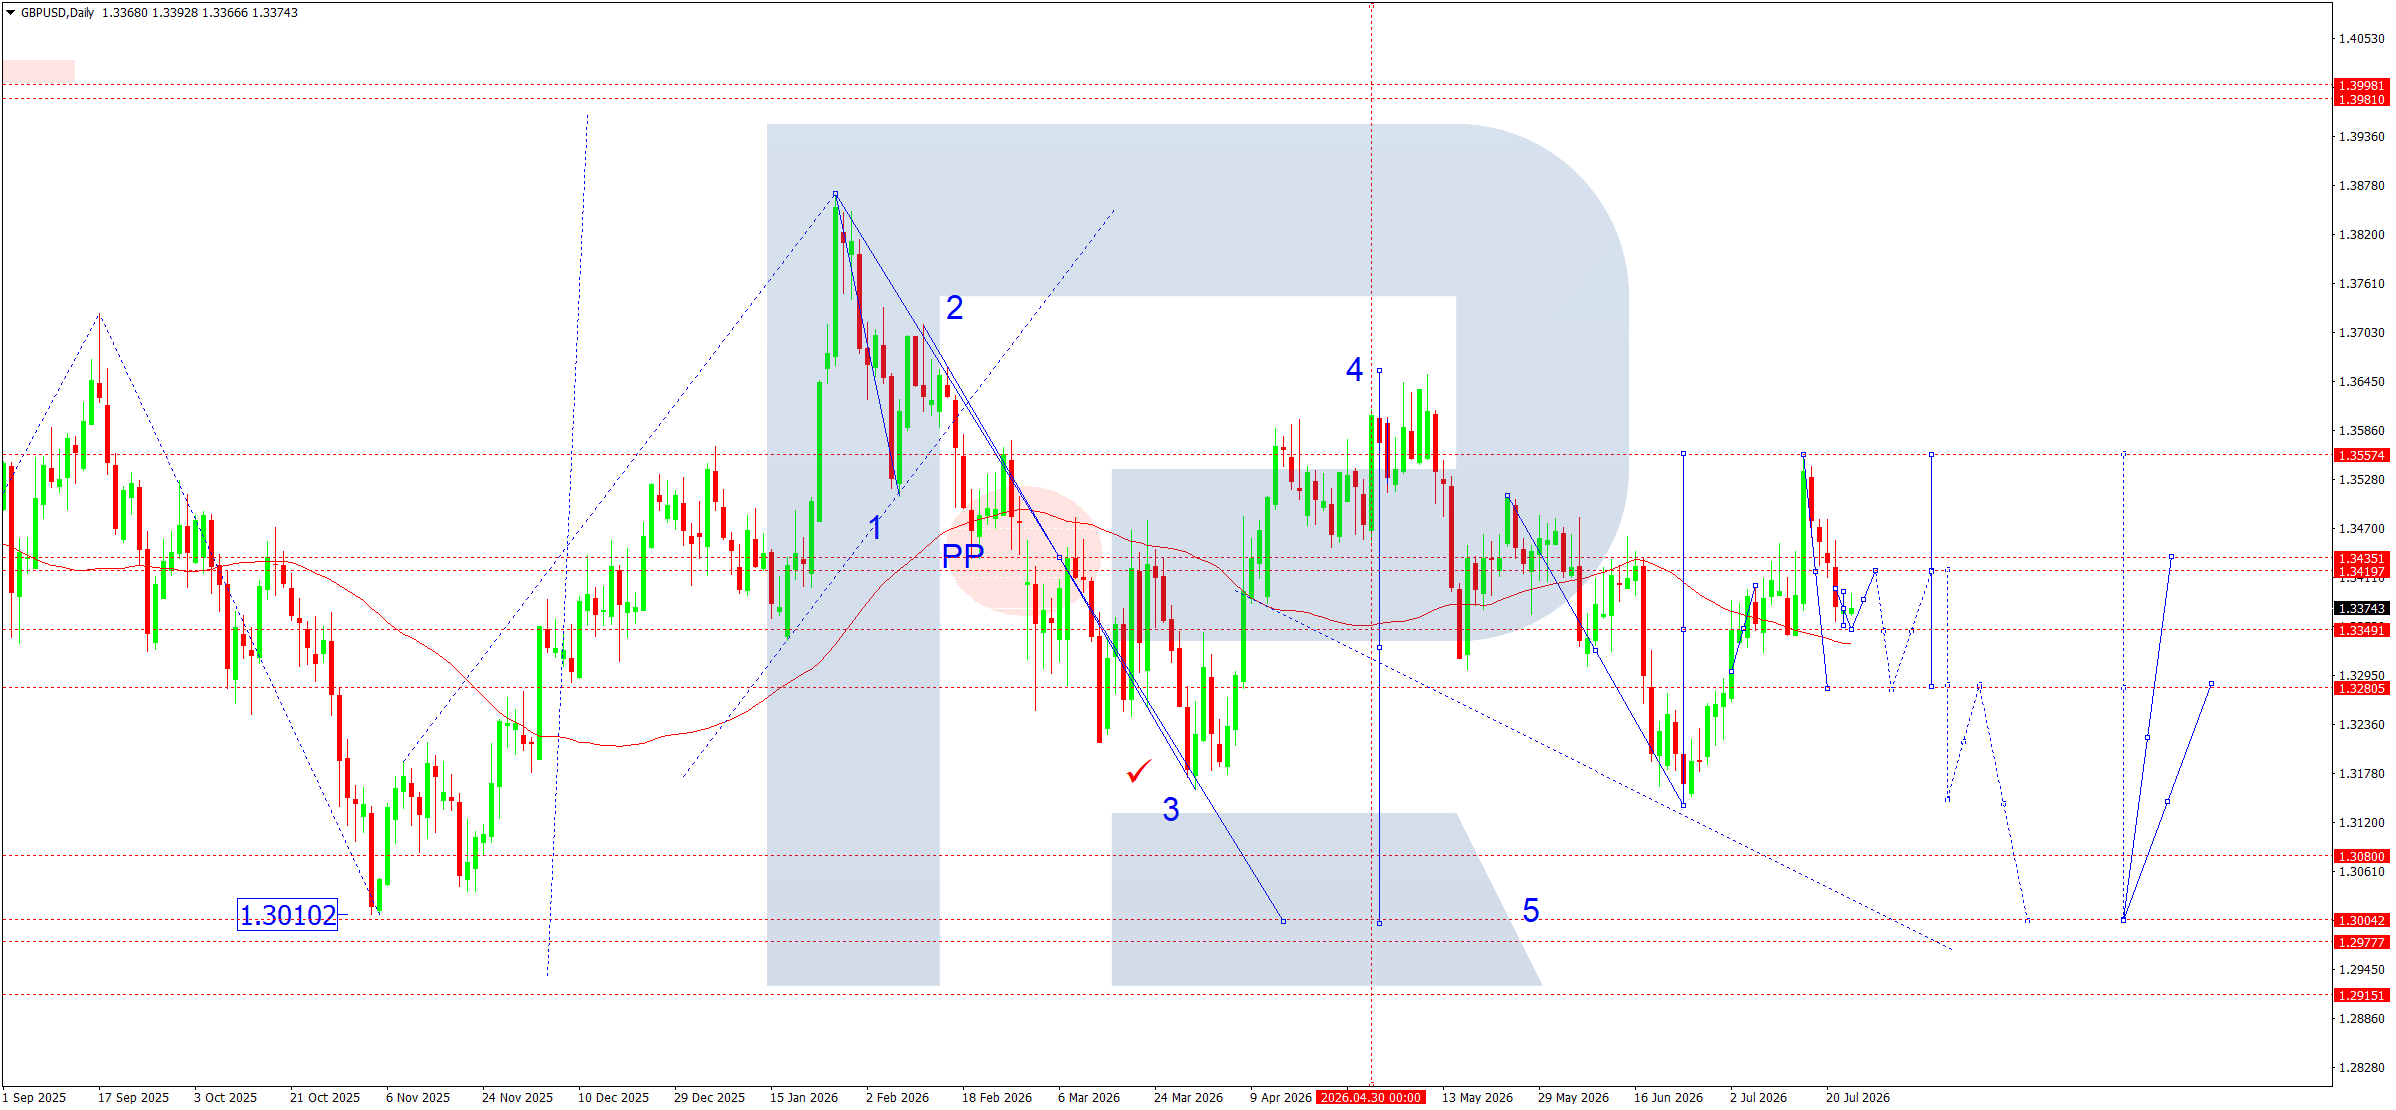
On the daily chart, GBPUSD continues to develop a broad sideways consolidation after completing an impulsive structure. The price continues to trade near the pivot point (PP), located around 1.3419–1.3435. This area remains the key boundary between the development of an upward correction and the resumption of the decline.
According to the Elliott wave structure, downward wave 3 was completed earlier, after which the market formed corrective wave 4. The quotes are currently retesting the medium-term resistance area, although there has not yet been a firm hold above it. This indicates persistent uncertainty and a high probability that consolidation will continue.
The SMA50 runs almost through the current prices, confirming the absence of a pronounced medium-term trend. The indicator acts as dynamic resistance, while repeated rebounds from this area point to a continuing balance between buyers and sellers.
From a technical perspective, the nearest resistance remains at 1.3435. A firm break above it will allow buyers to test the next target at 1.3557, where the upper boundary of the current range is located.
If selling pressure persists, the main reference point remains support at 1.3280. A break below it will confirm the end of the corrective phase and create the conditions for a new downward wave towards 1.3004. This area corresponds to the presumed target of the fifth wave on the chart and coincides with the lower boundary of the long-term range.
As long as the price remains within the 1.3280–1.3435 range, the priority scenario is trading amid elevated volatility, with alternating short-term impulses and corrections. The final direction will likely be determined after the Fed and Bank of England meetings.
GBPUSD forecast scenarios
Bearish scenario (base case): consolidation is expected to form below 1.3435, followed by a decline towards 1.3280. After a possible short-term correction, the decline may continue towards 1.3004.
Bullish scenario (alternative): if buyers establish a foothold above 1.3435 on rising volumes, the likelihood of continued growth towards 1.3557 will increase.
AUDUSD forecast
AUDUSD ends the week under the influence of conflicting fundamental factors. The main event was strong Australian labour-market data, which significantly exceeded market expectations. Employment growth strengthened expectations that the Reserve Bank of Australia will maintain a hawkish monetary policy stance and will not rush to ease policy. Persistent inflationary pressure, which remains above the regulator's target range, is providing additional support for the Australian currency.
At the same time, the strengthening US dollar continues to put pressure on the AUD. Market participants are awaiting the Fed meeting, where the regulator is likely to keep interest rates high and reaffirm its commitment to fighting inflation. Rising US Treasury yields are supporting demand for the dollar and limiting the Australian currency's recovery potential.
Geopolitical tensions in the Middle East remain an additional factor. High oil prices are supporting inflation expectations worldwide and reinforcing caution among major central banks. For Australia, this factor is mixed: rising commodity prices traditionally support the export sector but also contribute to a stronger dollar as a safe-haven asset.
AUDUSD technical analysis
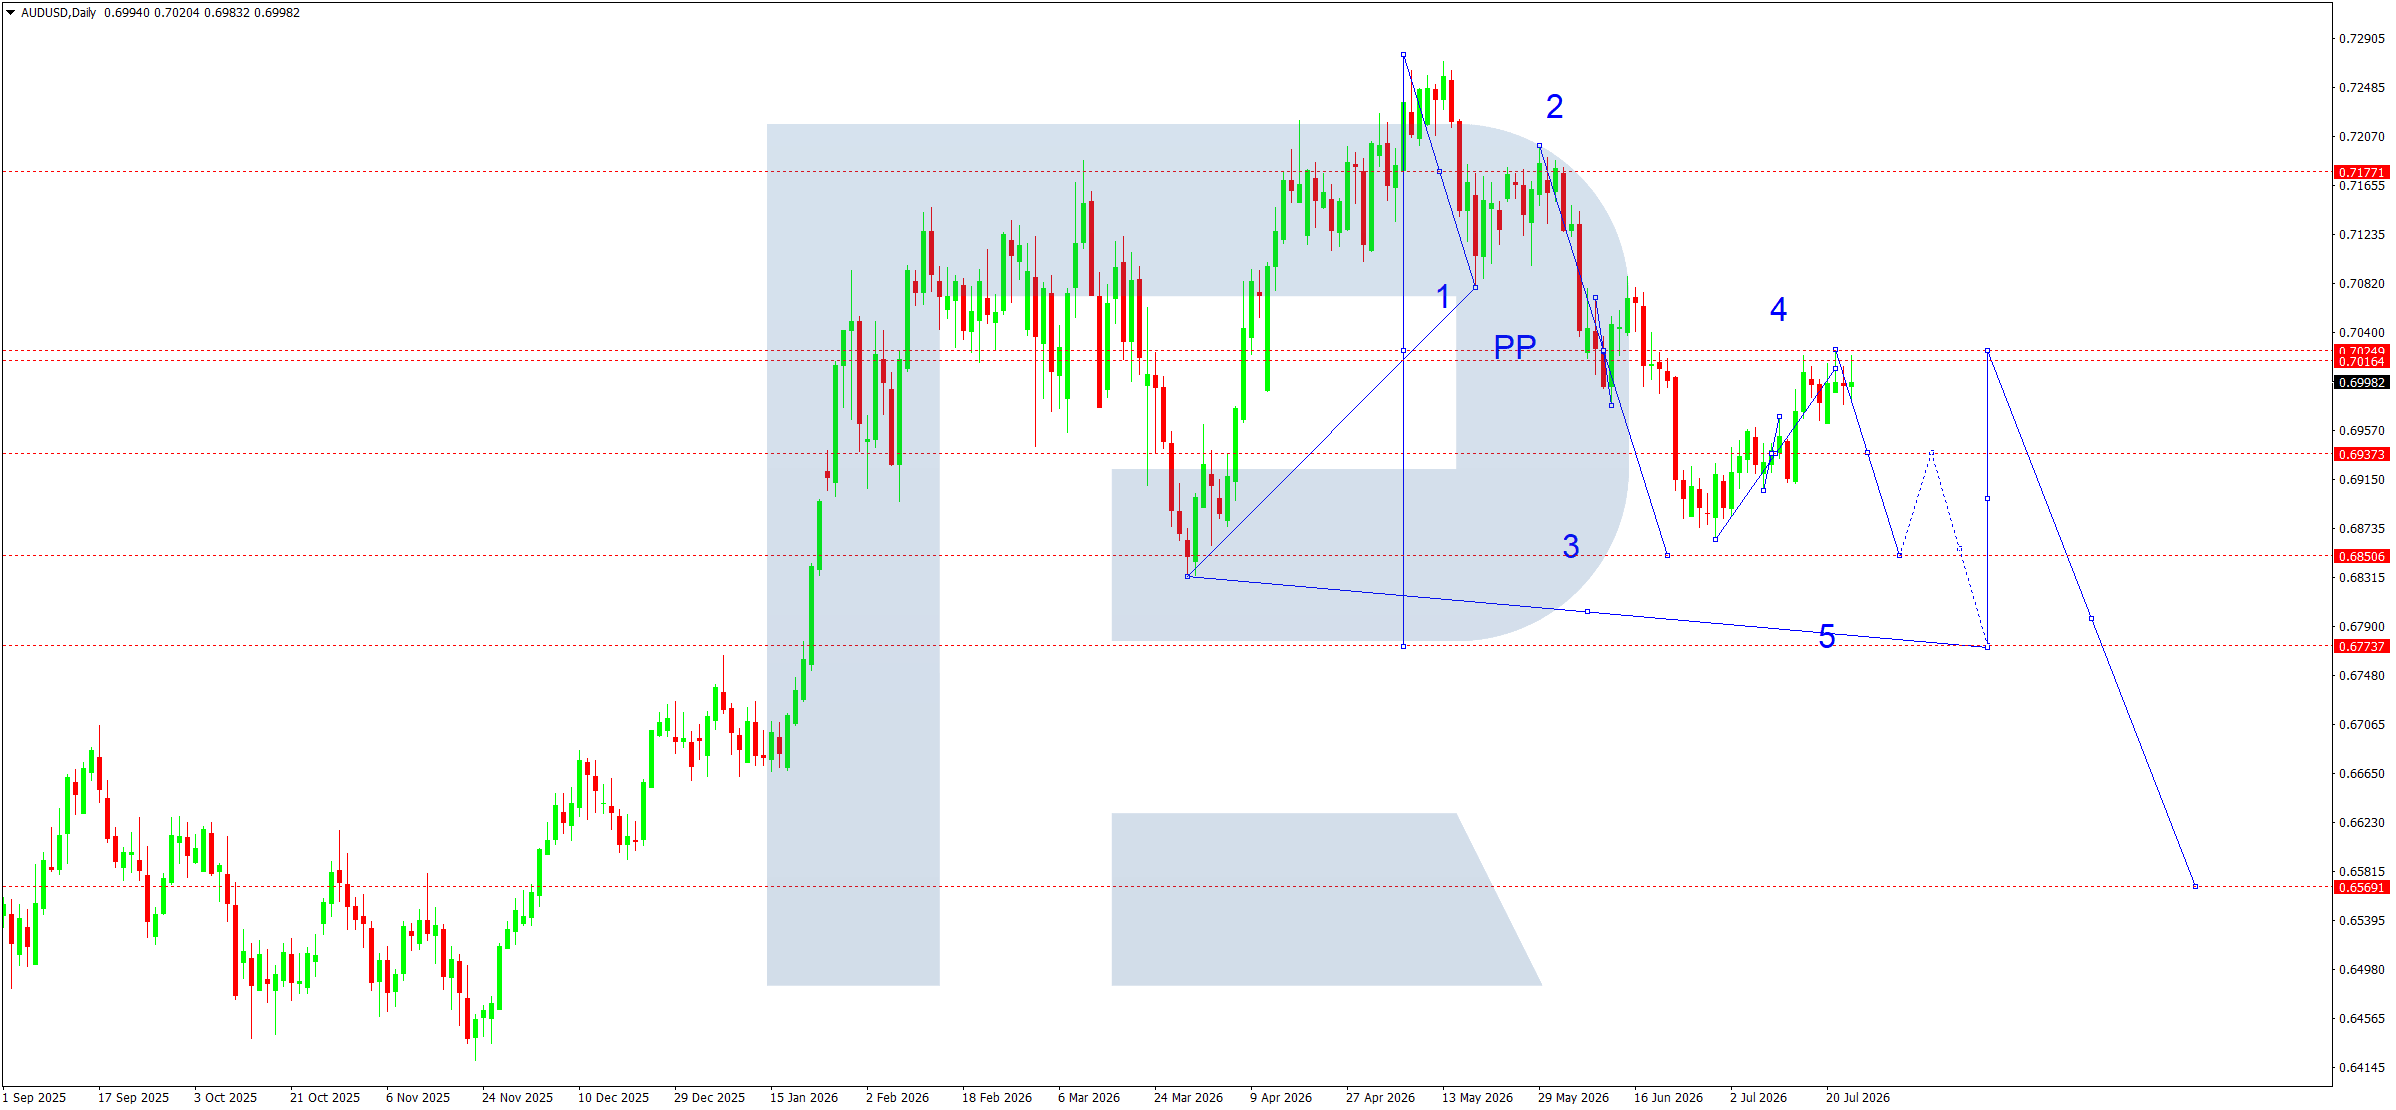
On the daily chart, AUDUSD continues to form a bearish wave structure. After completing the second corrective wave near 0.7177, the market moved into the third downward wave, which reached the 0.6850 area. This level currently acts as the key support for the entire medium-term structure.
The subsequent recovery is developing as a corrective fourth wave. According to the labelling, the main target for buyers remains the pivot point (PP) area near 0.7024. This level is the main resistance for the current correction. As long as the price remains below it, the overall bearish structure remains valid.
The 0.7037 zone provides additional resistance, marking the upper boundary of the current corrective range. If selling pressure persists, the fourth wave may end in this area, followed by the development of a fifth impulsive wave.
The base wave model suggests that the decline will resume once the correction is complete. The first target for sellers will again be support at 0.6850. A break below it will open the way towards 0.6774, which is marked on the chart as the main target of the fifth wave. If a strong downward impulse develops, the market could continue towards the strategic target at 0.6569.
The indicator picture also remains favourable for sellers. The price continues to trade below the key reversal zone, while the current rise still appears to be only a corrective recovery within the dominant downtrend. Until the price establishes a foothold above the PP area, it is premature to speak of a change in the medium-term trend.
AUDUSD forecast scenarios
Bearish (base case): the correction is expected to end near 0.7024. As long as the price remains below this level, a renewed decline towards 0.6850 is the most likely outcome, followed by the development of the fifth wave towards 0.6774.
Bullish (alternative): if the market establishes a foothold above 0.7024 amid rising volumes, the recovery may continue towards 0.7037.
USDCAD forecast
USDCAD ends the week in consolidation after the strong upward impulse of previous weeks. The main fundamental market drivers remain expectations regarding the US Federal Reserve's next steps, the Bank of Canada's monetary policy, oil-market dynamics, and persistent geopolitical tensions in the Middle East.
Last week, the Bank of Canada kept its key interest rate at 2.2500%, noting a gradual economic recovery but emphasising persistent risks related to global trade and geopolitics. At the same time, the regulator acknowledged that inflationary pressure is largely being supported by high energy prices, although it expects inflation to slow gradually over the medium term.
In the US, market participants continue to price in a scenario in which the Fed maintains tight policy. Rising global oil prices have once again increased inflation expectations and supported US Treasury yields, which is helping the US dollar. At the same time, higher oil prices remain a positive factor for the Canadian dollar, as Canada is one of the world's largest energy exporters. USDCAD's movement in the coming days will therefore be determined by the balance between a strong US dollar and support for the Canadian currency from the oil market.
USDCAD technical analysis
On the daily chart, the market continues to develop a medium-term upward impulse. According to the Elliott wave structure, waves 1, 2, and 3 have been completed, after which corrective wave 4 is forming. The current decline remains corrective and is developing within the uptrend.
The key area is 1.4035–1.4063, where local support and the upper boundary of the previously broken ascending channel are located. As long as the price remains above this zone, the bullish structure remains intact.
The chart clearly shows the formation of a consolidation range after the completion of the third wave. The presumed wave 4 may take the form of a complex sideways correction, with a possible decline first towards 1.3895 and, if selling pressure intensifies, towards support at 1.3829. This area is the main zone where the correction may end and a new upward wave may begin.
Once the correction is complete, the technical picture suggests the start of a fifth impulsive wave. The first target for buyers will be a return above 1.4125. A firm hold above this resistance will open the way towards 1.4247, while the main long-term target of the pattern remains near 1.4310, corresponding to the completion of the entire five-wave bullish structure shown on the chart.
The price remaining above the 50-day moving average, which continues to turn upwards, provides additional confirmation of the bullish scenario and indicates that buyers dominate the medium-term outlook. Despite the local correction, the structure of highs and lows has not yet been broken, allowing the current decline to be viewed as a technical pause before the main trend resumes.
USDCAD forecast scenarios
Bullish (base case): the correction is expected to end within the 1.4035–1.3895 range, followed by the development of a new upward wave. A firm hold above 1.4125 will open the way towards 1.4247.
Bearish (alternative): if the market establishes a foothold below 1.4035, the correction may continue towards 1.3895 and then 1.3829, where new demand is expected to emerge.
XAUUSD forecast
Gold ends the week amid persistent uncertainty in global financial markets. The main fundamental factors remain expectations surrounding the Fed meeting, rising oil prices amid geopolitical tensions in the Middle East, and changing expectations for the future monetary policy of leading central banks. During the week, market participants revised the probability that the Fed will maintain tighter policy through the end of the year after energy prices increased inflation risks. This is putting pressure on gold through higher US Treasury yields and a stronger US dollar.
The cautious stance of the European Central Bank remains an additional factor. The ECB kept interest rates unchanged but indicated that it was prepared to tighten policy again if inflationary pressure increased. This rhetoric supports high global interest rates and limits the recovery potential of precious metals.
At the same time, geopolitical risks continue to support demand for safe-haven assets. Despite the local decline in prices, interest in gold persists due to ongoing instability in the Middle East and high commodity-market volatility. The fundamental backdrop for next week therefore remains mixed: pressure from high interest rates is combined with sustained demand for safe-haven assets.
XAUUSD technical analysis
On the daily chart, XAUUSD maintains a medium-term downtrend. The price continues to trade below the SMA50, which acts as dynamic resistance and confirms that sellers retain the advantage.
After reaching a low near 3,917, the market entered a sideways consolidation phase. A corrective wave has developed in recent trading days within the 3,917–4,165 range. This structure is consistent with the completion of a local correction before another attempt to break out of the range.
The 4,060–4,095 area remains the market's key pivot zone. Buyers and sellers continue to compete for the short-term direction near this range. Until the price establishes a foothold above 4,165, it is premature to speak of a full reversal.
According to the wave structure, the current correction may end with another decline towards support at 3,917. This level is an important technical zone where the lower boundary of the current pattern lies. If sellers fail to establish a foothold below it, a larger upward correction is highly likely.
Under the bullish scenario, the first target will be a return to 4,403, where strong horizontal resistance is located. A break above it will open the way towards the next target at 4,759, which coincides with the previous distribution zone and an important resistance level on the daily chart.
The indicator picture also points to weakening bearish momentum. The decline is becoming less aggressive, while the formation of a series of local lows indicates energy accumulation ahead of the next directional move. However, until the price rises above the SMA50, sellers retain the advantage, so any purchases should still be viewed solely as corrective.
XAUUSD forecast scenarios
Bearish (base case): consolidation is expected to continue near 4,060, followed by a decline towards support at 3,917. Once the decline is complete, a new upward correction towards 4,403 is likely.
Bullish (alternative): if the price holds above 4,165 and the breakout is accompanied by rising volumes, growth may continue first towards 4,403 and then towards 4,759.
US 500 forecast
The US stock market ends the week in consolidation after an extended rise, while investors are gradually adopting a more cautious assessment of risks. Market participants are focused on several fundamental factors at once. First and foremost is the upcoming US Federal Reserve meeting, which will take place next week. The Fed's communications blackout prevents the market from receiving additional guidance, so expectations are being shaped mainly by macroeconomic data and inflation dynamics. Recent data confirm that inflationary pressure is easing, although the market still allows for the US regulator to maintain a relatively hawkish stance.
The corporate earnings season remains an additional source of volatility. Major technology companies are publishing financial results that continue to shape investor sentiment. Despite strong profit figures from individual companies, the market is becoming more sensitive to management guidance on capital expenditure and further investment in artificial intelligence. Geopolitical tensions in the Middle East also continue to exert an influence, supporting high oil prices and putting pressure on US Treasury yields. As a result, the S&P 500 remains in consolidation near all-time highs, where market participants are weighing strong corporate earnings against the risks of tighter financial conditions.
US 500 technical analysis
On the daily chart, the US 500 maintains its long-term uptrend. The price remains firmly above the main ascending channel line and the long-term moving average, confirming that buyers remain in control.
After reaching the 7,607–7,628 area, the index formed a local correction and moved into a horizontal accumulation phase. This zone remains the main resistance for the current week. Several attempts to hold above it have so far failed to gain traction, indicating weakening momentum after the previous upward wave.
The nearest support area lies around 7,441–7,425. Demand has repeatedly emerged here in recent weeks, preventing sellers from developing a deeper decline. As long as the price remains above this range, the uptrend structure remains intact.
The next important support is at 7,276. A break below it would provide the first technical confirmation that the market is moving into a deeper correction. Below this level, there is room for a move towards 6,946–6,926, where the next major area of buyer interest and a long-term pivot point are located.
The upper boundary of the range remains near 7,607–7,628. A firm hold above this resistance will confirm the end of the current consolidation and allow the index to form a new upward wave towards 7,665 and above.
Long-term trend indicators continue to favour buyers, although slowing growth and a narrowing trading range indicate that the market is preparing to break out of consolidation. The direction will most likely be determined by the outcome of the Fed meeting and investors' subsequent reaction to the earnings reports of major US companies.
US 500 forecast scenarios
Bearish (base case): the market holds above 7,441, breaks through the 7,607–7,628 resistance area, and develops a new upward wave towards 7,665, with the possibility of setting a new all-time high.
Bullish (alternative): if support at 7,441 is breached, the likelihood of a decline first towards 7,276 and, if selling pressure intensifies, towards the 6,946–6,926 zone will increase.
BTCUSD forecast
Bitcoin ends the week in a recovery phase after the June correction, although the market remains sensitive to macroeconomic events. The main driver of the coming week will be the Federal Reserve meeting, where investors will focus less on any change in the interest rate and more on signals regarding the future path of monetary policy. Any hints of a more dovish stance could support demand for risk assets, including cryptocurrencies, while hawkish comments could renew pressure on the market.
Institutional investors continue to provide additional support for Bitcoin. Spot Bitcoin ETFs in the US have recorded several consecutive trading sessions of positive net capital inflows. Although volumes remain below those seen at the beginning of the year, the return of sustained inflows itself indicates a gradual recovery in interest from major market participants after a prolonged period of outflows.
Market participants are also continuing to monitor discussions on digital asset regulation in the US. Progress on legislative initiatives could reduce uncertainty for institutional capital and maintain a positive long-term outlook for the cryptocurrency sector. Meanwhile, persistent geopolitical tensions and fluctuations in stock indices will remain additional sources of elevated volatility.
BTCUSD technical analysis
On the daily chart, BTCUSD continues to form a recovery correction after a sharp decline that ended near the 57,900–58,000 area. This zone remains the main long-term support for the entire current structure.
The price is currently trading near 65,600, gradually developing an upward movement within a local channel. According to the labelling shown on the chart, the market has completed the first phase of the recovery and moved into the formation of another corrective wave. The nearest target for buyers lies in the 65,990–67,640 resistance area, which is the first important profit-taking zone.
If the positive momentum persists, the market may proceed to test 68,900. This is the next strong resistance area, coinciding with the upper boundary of the local wave structure. A firm hold above this zone will confirm the development of a medium-term upward wave, with the prospect of a move towards 73,445.
At the same time, the chart shows that the current rise is predominantly corrective. Once the local upward structure is complete, a new downward wave towards the 63,000–63,100 area cannot be ruled out, where an important pivot point of the current matrix is located. This zone will determine the market's subsequent direction.
If sellers establish a foothold below 63,056, pressure will increase significantly, and the next downside target will be the 57,887 area, which acts as the key support for the entire medium-term structure. As long as this level holds, the probability of a new growth phase remains high.
Overall, the technical picture is gradually improving: a series of higher local lows indicates weakening bearish momentum, although buyers need to establish a foothold above the 67,600–68,900 range to confirm a definitive trend reversal.
BTCUSD forecast scenarios
Bearish (base case): the market continues to consolidate above 63,000, followed by growth towards 67,600–68,900. A firm hold above this zone will open the potential for a move towards 73,445.
Bullish (alternative): if selling resumes and 63,056 is breached, the likelihood of a decline towards 60,100–57,887 will increase, where long-term demand may become active again.
Editors’ picks
 EURUSD forecast 2026–2027: technical analysis, price levels & predictions
EURUSD has pulled back from the 2026 high of 1.1915 and is now trading near 1.1450 — below both EMA65 and EMA200 — with the active scenario shifting from bullish to bearish. The ECB raised rates to 2.40%, but the Fed holds at 3.75%, and US inflation (3.5%) continues to outpace the eurozone (2.8%). A confirmed break below 1.1280 opens the next downward wave toward 1.1080. We break down the key levels, three trading scenarios with entry triggers, and what Deutsche Bank, Morgan Stanley and UBS are forecasting for EURUSD in 2026.
 Gold (XAUUSD) forecast 2026: predictions based on fundamental and technical analysis
Gold has corrected over 25% from its all-time high of 5,597 USD and is now trading near 4,100 USD — testing a critical support zone. Is this the bottom, or will the downtrend continue? We break down the key levels (support 3,920 USD, breakout trigger 4,500 USD), three trading scenarios with entry levels, and what J.P. Morgan, Goldman Sachs and Deutsche Bank are forecasting for gold in 2026.
Forecasts presented in this section only reflect the author’s private opinion and should not be considered as guidance for trading. RoboForex bears no responsibility for trading results based on trading recommendations described in these analytical reviews.