
Weekly technical analysis and forecast (3–7 August 2026)
In this weekly technical analysis, we examine the key chart patterns and price levels for EURUSD, USDJPY, GBPUSD, AUDUSD, USDCAD, Gold (XAUUSD), US 500, and Bitcoin (BTCUSD) to forecast market developments for the week ahead (3–7 August 2026).
Major technical levels to watch this week
- EURUSD: Support: 1.1432, 1.1308. Resistance: 1.1543, 1.1669
- USDJPY: Support: 161.82, 160.65. Resistance: 164.15, 164.80
- GBPUSD: Support: 1.3273, 1.3097. Resistance: 1.3429, 1.3557
- AUDUSD: Support: 0.6851, 0.6774. Resistance: 0.6998, 0.7025
- USDCAD: Support: 1.4007, 1.3896. Resistance: 1.4069, 1.4247
- Gold: Support: 3,945, 3,903. Resistance: 4,150, 4,400
- US 500: Support: 7,304, 7,242. Resistance: 7,458, 7,595
- BTCUSD: Support: 63,433; 57,843. Resistance: 64,452; 66,162
EURUSD forecast
The coming week for the EURUSD pair begins after meetings of two key regulators: the US Federal Reserve and the European Central Bank, both of which kept interest rates unchanged. The rhetoric from both sides nevertheless remains fairly cautious. The Fed again noted the resilience of the US economy and persistently elevated inflation, supporting expectations that tight monetary conditions will remain in place over the coming months. The ECB also left rates unchanged, emphasising that the impact of rising energy prices and persistent geopolitical risks requires a cautious approach to future decisions.
The energy market situation remains an additional factor. Despite some signs of stabilisation, uncertainty surrounding the Middle East continues to keep oil market volatility elevated. Rising energy costs put pressure on eurozone inflation while also worsening the region's economic-growth outlook. In the US, macroeconomic data remain relatively resilient, allowing the dollar to continue receiving support from investors.
The fundamental backdrop at the beginning of August therefore remains moderately favourable for the US currency. In the absence of new negative factors for the dollar, the market will continue to assess the outlook for the next Fed meeting and incoming inflation and labour market data closely.
EURUSD technical analysis
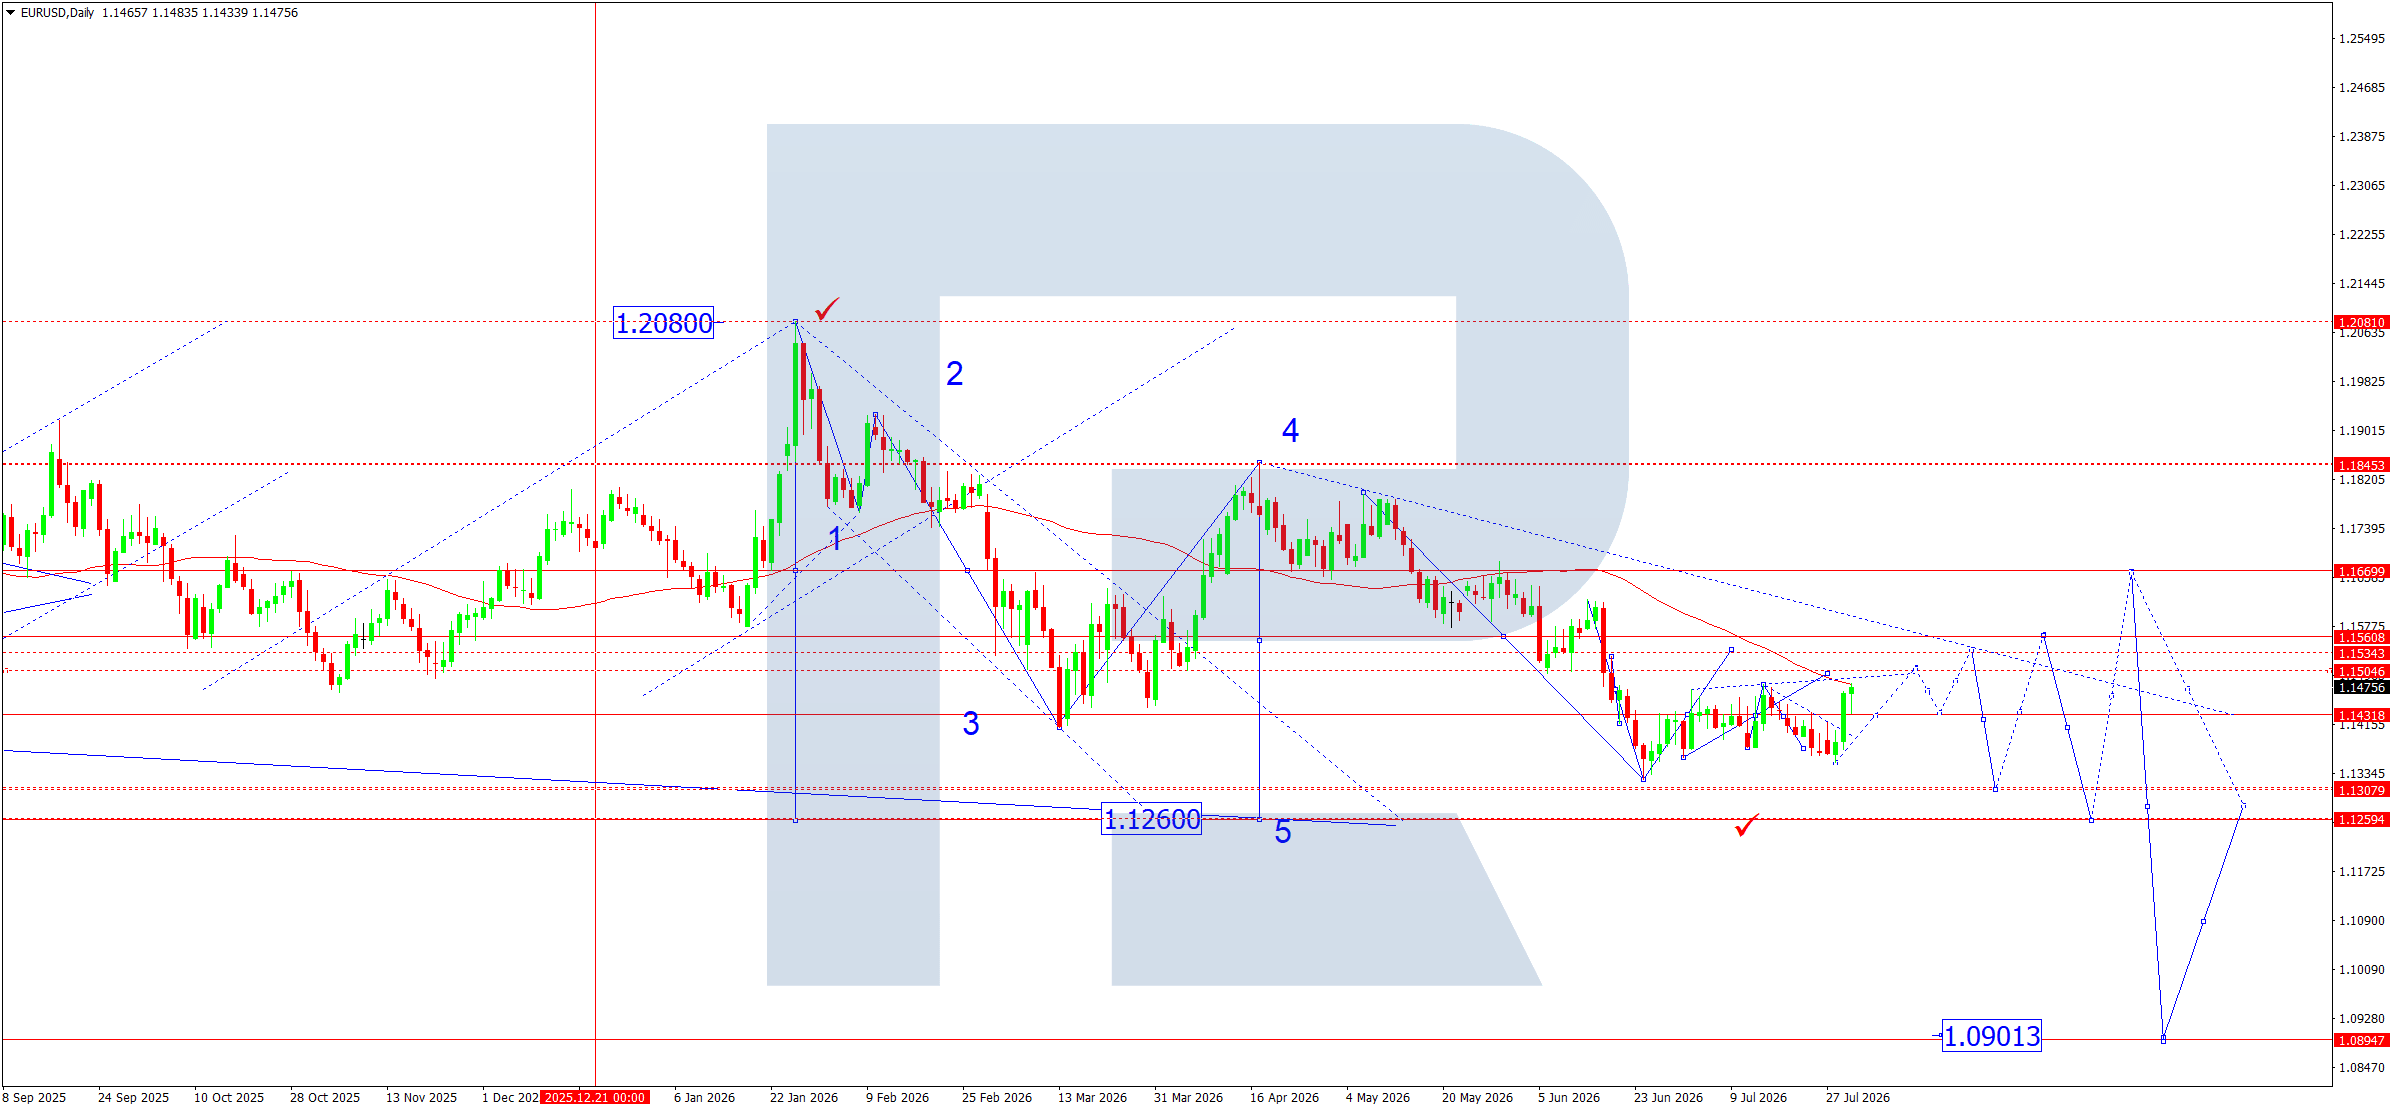
On the daily chart, the EURUSD pair maintains the bearish structure formed after the completion of a major top near 1.2080. The long-term fifth wave continues to develop, while the current rise appears to be a corrective recovery within the main downtrend.
After forming a local low near 1.1308, the market entered a consolidation phase. The price is gradually approaching the first resistance zone at 1.1505–1.1543, where the upper boundary of the local descending channel is also located. The SMA50 area provides additional resistance, as the moving average continues to decline and confirms persistent selling pressure.
From the Elliott wave perspective, the current rise can be viewed as a corrective wave within the continuing downward impulse. As long as the market remains below the 1.1560 area, the likelihood that the correction is nearing completion remains fairly high.
The nearest target for buyers is a test of the 1.1535–1.1543 zone. However, the technical picture does not yet confirm a firm hold above this area. Stronger resistance is located at 1.1669, where the previous reversal area and the upper boundary of the long-term descending channel begin.
If sellers emerge within the 1.1535–1.1560 area, the main downtrend may resume. The first downside target will be 1.1432, after which attention will shift back to support at 1.1308. A firm hold below this level will open the way towards the main downside target near 1.1259. In the longer term, the chart pattern allows for a decline towards the 1.0901 area, although this remains a strategic scenario for now.
Overall, the technical picture remains predominantly bearish despite the continuing local correction.
EURUSD forecast scenarios
Bearish (base case): the market may complete its corrective rise within the 1.1505–1.1543 range and resume its decline towards 1.1432. A break below 1.1308 will open the potential for a move towards 1.1259.
Bullish (alternative): if buyers establish a foothold above 1.1543, the likelihood of the correction continuing towards 1.1560 and then 1.1669 will increase.
USDJPY forecast
The coming week for USDJPY begins after one of the most eventful periods of the summer. The main market drivers were the decisions of the Federal Reserve and the Bank of Japan, as well as a sharp increase in yen volatility. The Fed kept the interest rate unchanged, although its rhetoric remained fairly hawkish as inflation risks associated with high energy prices and geopolitical tensions persist. This supports expectations that US interest rates may remain high for longer than the market had anticipated.
Investors also paid close attention to the actions of the Japanese authorities. At the end of the week, the yen strengthened sharply, prompting market participants to speculate that Japan's Ministry of Finance had intervened in the currency market amid the weakness of the national currency. Even if intervention did take place, the yield differential between the US and Japan continues to support demand for the dollar fundamentally, so a sustainable trend reversal has not yet been confirmed. In the coming days, investors will closely analyse comments from the Bank of Japan regarding the future path of monetary policy and the inflation outlook.
USDJPY technical analysis
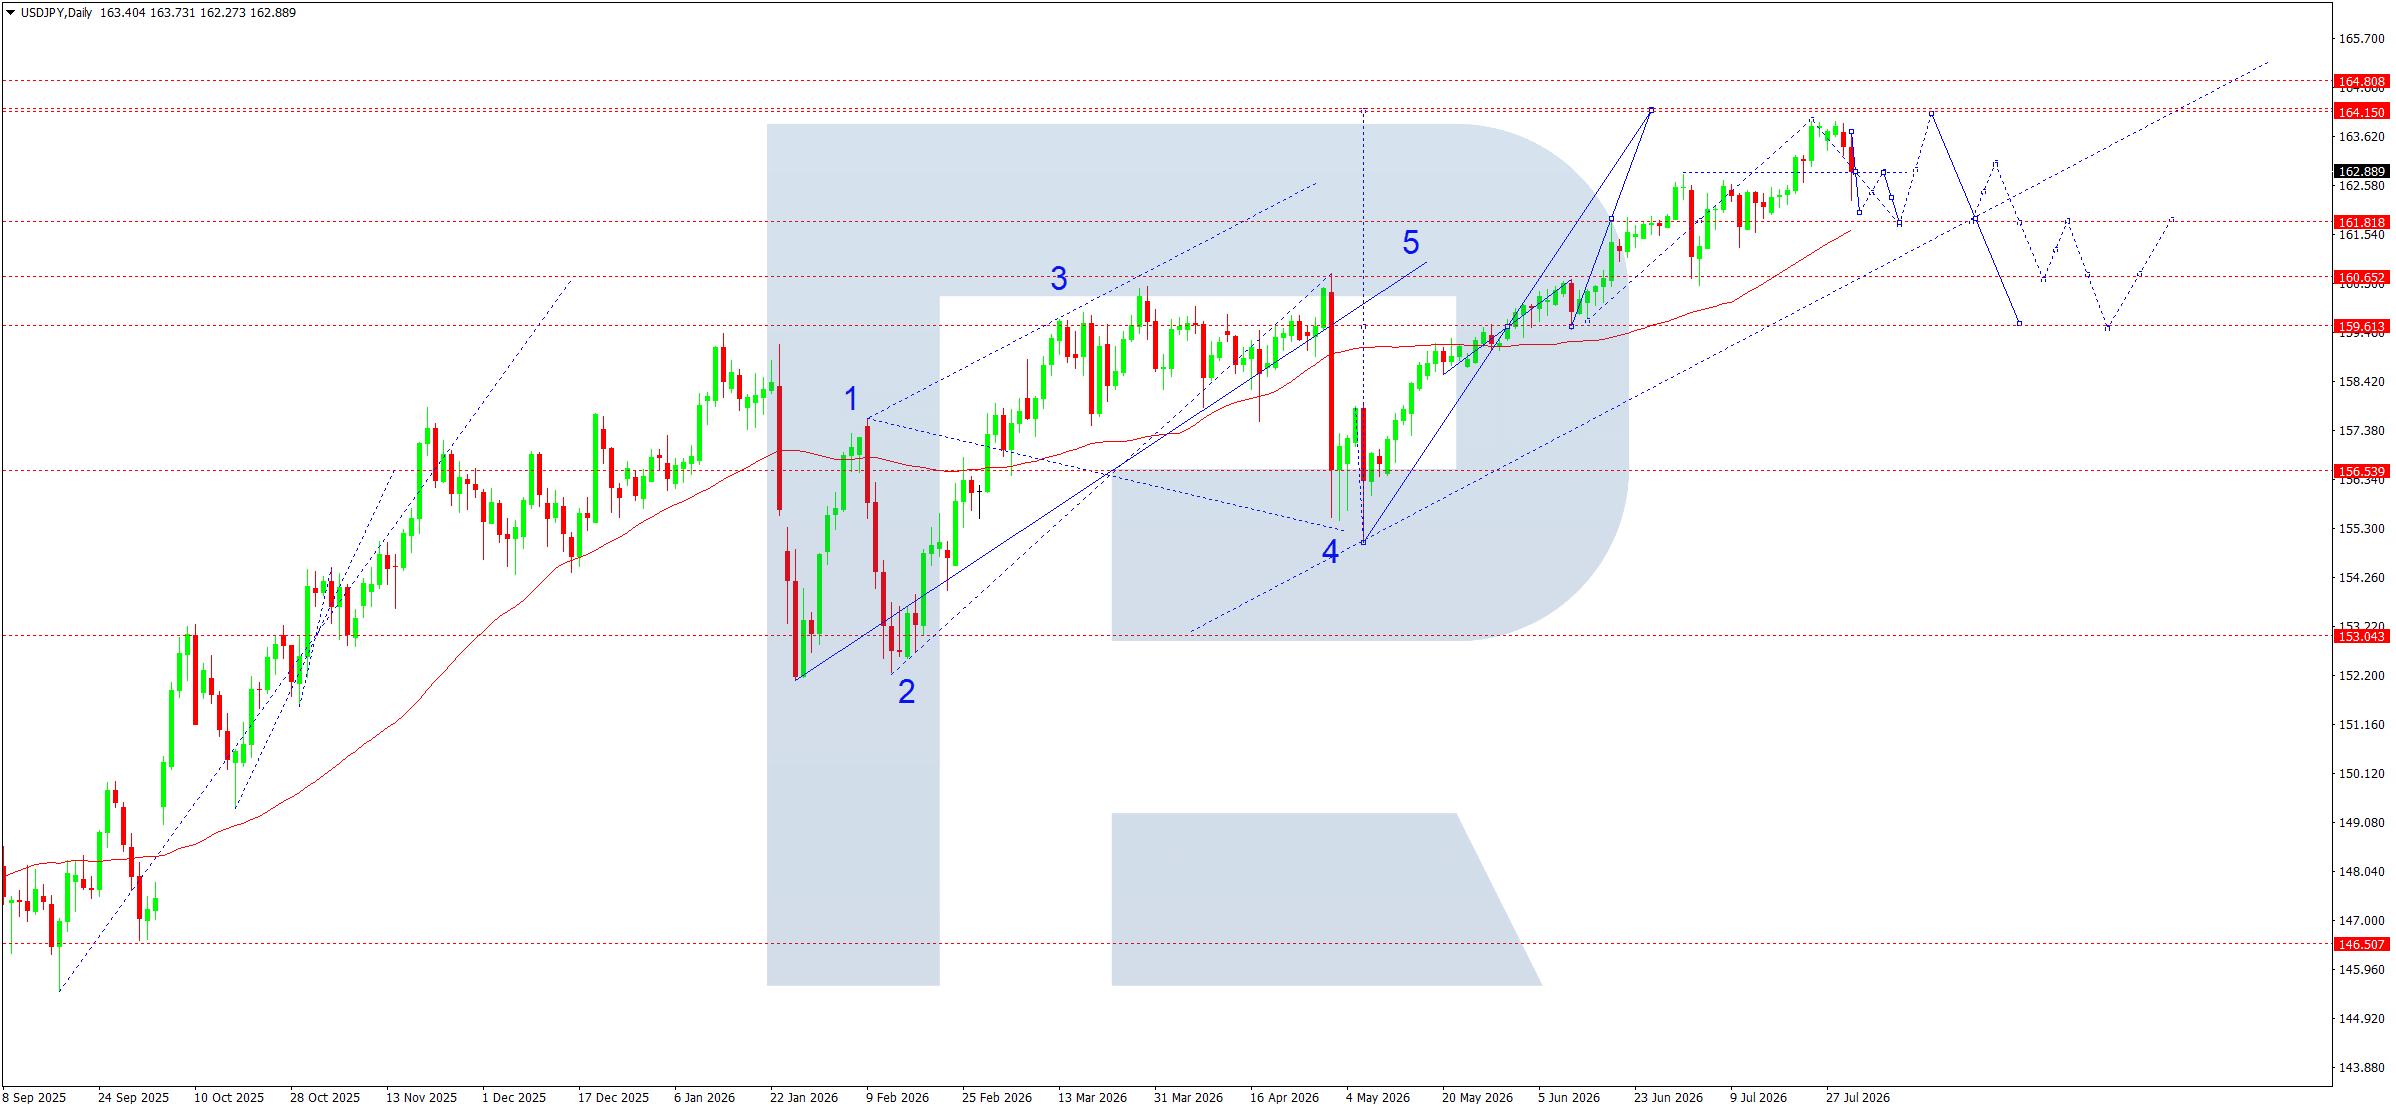
The daily chart maintains a long-term bullish structure. The price remains well above the SMA50, confirming that the strategic uptrend remains intact. However, after reaching the 163.90–164.15 area, the market encountered active profit-taking.
According to the Elliott wave structure, an impulsive upward wave has been completed, forming a peak near 163.96. A corrective phase is developing after the price broke out of the local ascending channel. The break below the channel boundary is the first technical signal that buyers are weakening.
The chart clearly shows the beginning of a downward correction towards the first target at 161.82. This level coincides with the nearest support area and may become an intermediate point for market stabilisation. If the price establishes a firm foothold below 161.82, sellers will be able to test the next area at 160.65, where an important previous consolidation zone is located.
If pressure persists, the next downside target will be around 159.61. This area appears to be the main target of the current corrective wave and is also located near the middle line of the long-term ascending channel. Increased buyer activity may be expected here.
Despite the current correction, the global picture remains constructive for the dollar. The long-term ascending channel remains intact, and the price is still well above its lower boundary. This means that the current decline should still be viewed as a correction within the main uptrend.
If a sustainable reversal signal forms within the 160.65–159.61 area, the market may resume its upward movement. The first target would then again be 164.15, and a firm break above it would open the way towards the strategic target near 164.80, marked by the upper boundary of the long-term channel.
Overall, the technical picture indicates a short-term advantage for sellers while the long-term uptrend remains intact.
USDJPY forecast scenarios
Bearish (base case): the market has broken below the ascending channel after completing an impulsive upward wave near 163.96. The base case remains a correction towards 161.82, then 160.65 and, if pressure intensifies, 159.61.
Bullish (alternative): if buyers manage to return the price above 164.15 and establish a foothold there amid rising volumes, the upward move may continue towards 164.80.
GBPUSD forecast
The coming week for GBPUSD begins after an eventful period in which several key factors shaped market sentiment. The main event was the Bank of England meeting. The BoE kept the interest rate unchanged at 3.7500%, although the distribution of votes showed growing disagreement within the Monetary Policy Committee. Some policymakers already favour further tightening due to persistent inflation risks and rising energy prices. At the same time, the BoE leadership continues to take a cautious approach, noting a deterioration in the UK's economic growth outlook.
On the US dollar side, market attention focused on the outcome of the Federal Reserve meeting and the release of US GDP and inflation data. Despite persistently high US Treasury yields, investors continue to assess the likelihood of the Fed's next steps closely. Geopolitical tensions in the Middle East remain an additional source of uncertainty, affecting oil prices and inflation expectations across the world's leading economies. All of this is maintaining elevated volatility in the major currency pairs and limiting the development of a sustainable trend.
GBPUSD technical analysis
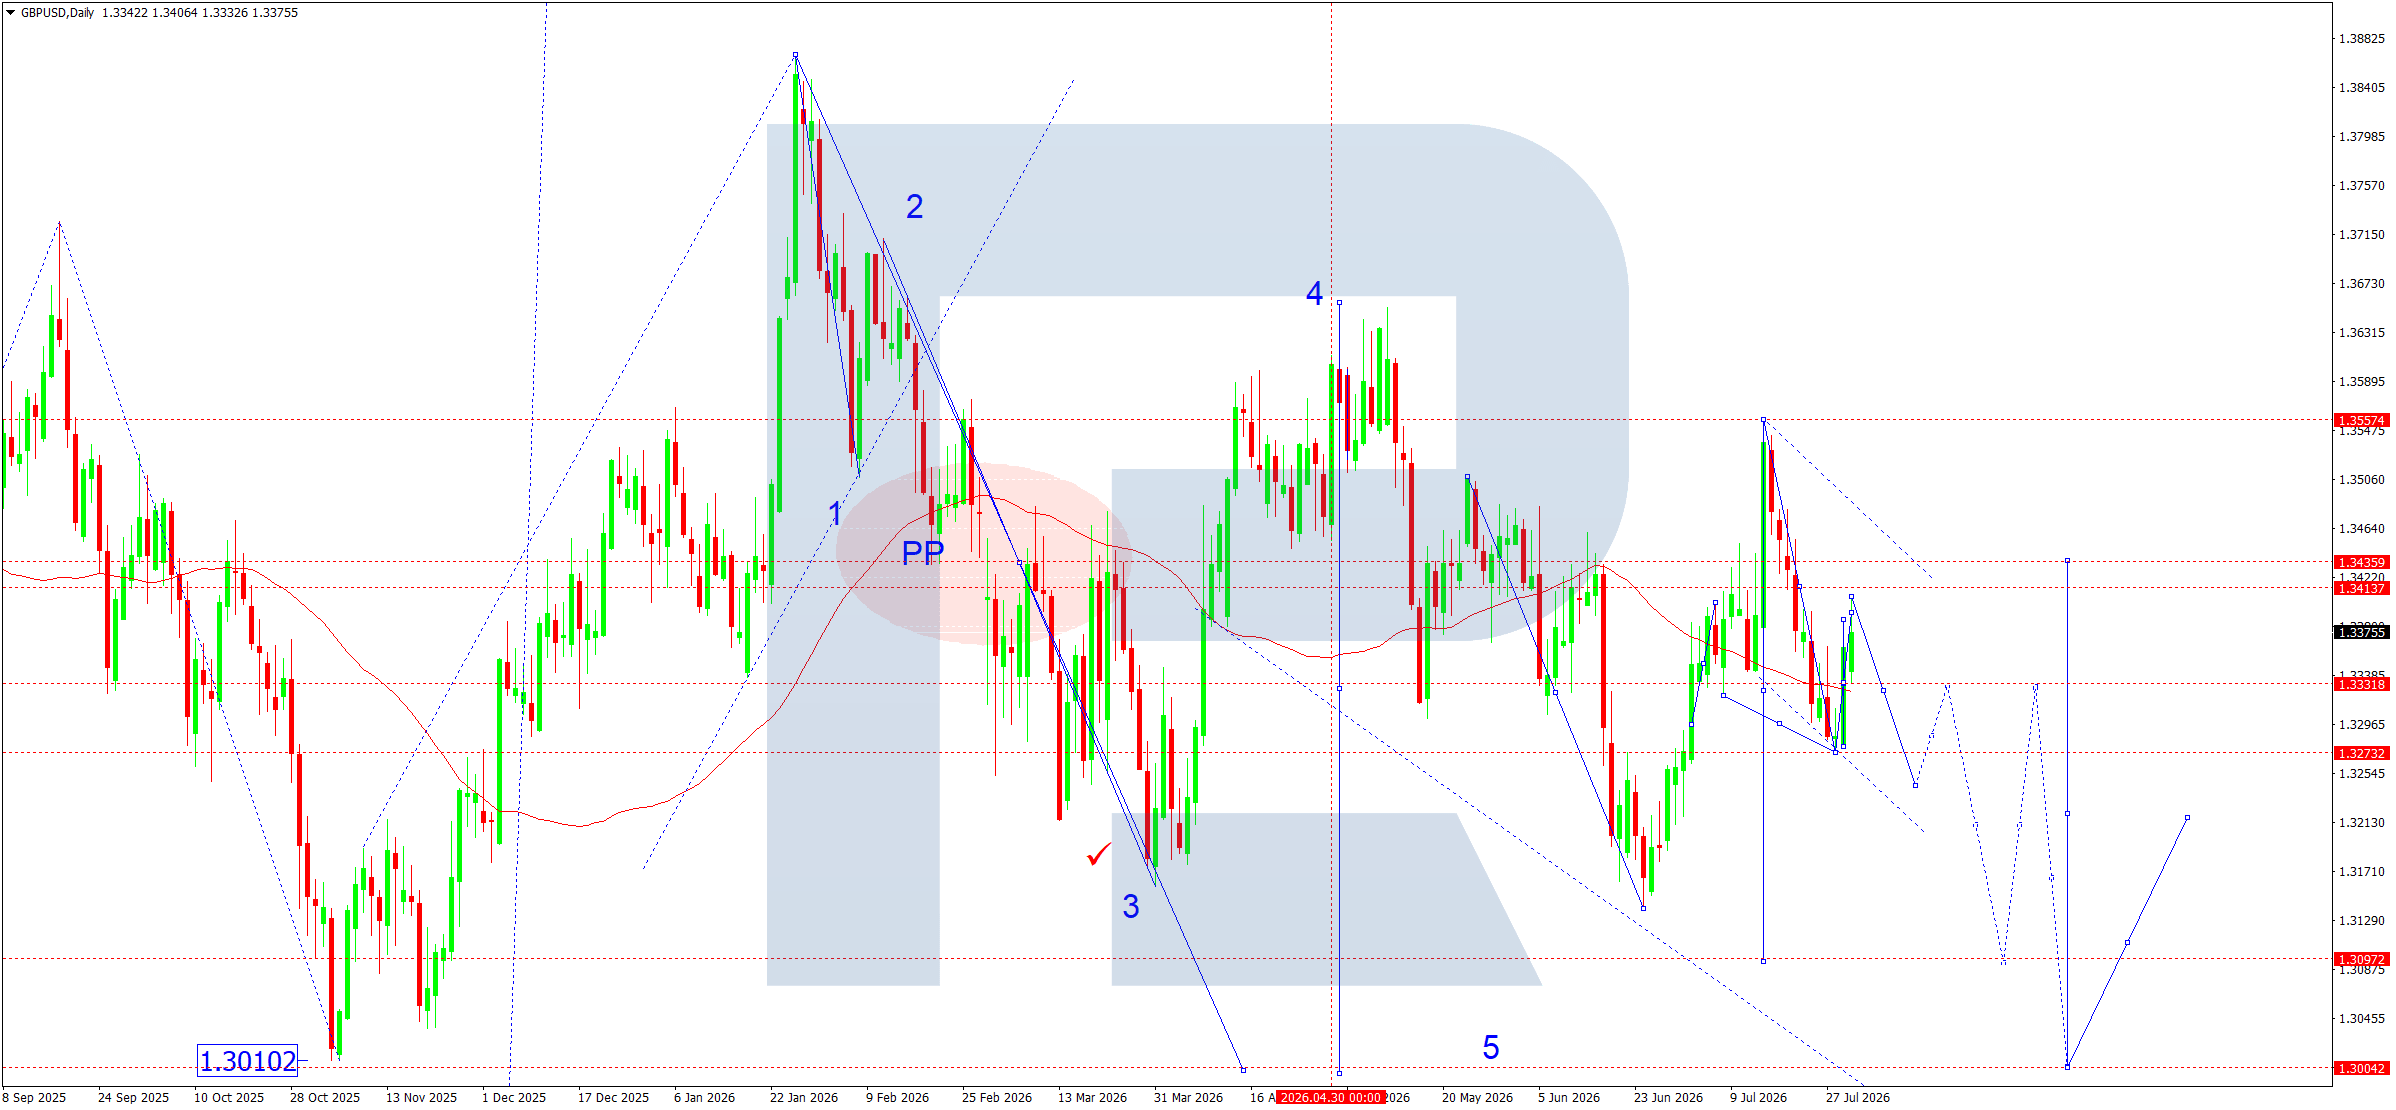
On the daily chart, GBPUSD continues to develop a corrective structure after the July decline ended. The price is holding near the pivot point (PP) area at 1.3429–1.3436. This zone remains the key reference point for market participants and determines the subsequent direction.
According to the Elliott wave structure, the market has completed the previous downward impulse and is now forming a corrective phase within the descending channel. The latest local rise met resistance below the upper boundary of the channel, followed by a pullback towards support at 1.3273. As long as the price remains below the PP area and the SMA50, sellers retain the advantage.
The SMA50 continues to slope downwards and runs directly above current prices, reinforcing resistance within the 1.3429–1.3436 range. A break above this zone will be the first technical confirmation of a change in short-term sentiment.
The chart also suggests the possibility of another corrective wave upwards, followed by a renewed decline. The main descending channel remains valid, while the nearest target for sellers is the 1.3097 area. If a deeper correction develops, buyers may test 1.3436, although without a firm hold above this level it remains premature to speak of a full reversal.
Overall, the technical picture continues to indicate persistent medium-term bearish pressure, while short-term performance may remain sideways with elevated volatility around the pivot point.
GBPUSD forecast scenarios
Bearish scenario (base case): consolidation is expected to remain below 1.3429. Once the correction is complete, a decline towards 1.3273 is likely, followed by a continued move towards 1.3097.
Bullish scenario (alternative): if the market establishes a foothold above 1.3436, the recovery may continue towards 1.3557, with the possibility of testing the upper boundary of the corrective channel.
AUDUSD forecast
AUDUSD ends the week near the psychologically important 0.7000 area after a period of elevated volatility caused by the US Federal Reserve meeting and the release of key macroeconomic data. The Fed kept the interest rate unchanged, although mixed comments from its leadership increased uncertainty over the future path of US monetary policy. This led to fluctuations in US Treasury yields and a temporary weakening of the dollar, although demand for safe-haven assets remains high.
Recent Australian inflation data provided additional support for the Australian dollar. Despite a slight slowdown in consumer price growth, inflation remains above the target range, preserving the likelihood that the Reserve Bank of Australia will maintain a hawkish stance ahead of its August meeting. The market continues to assess the possibility that the RBA will keep the interest rate high for longer than previously expected.
This week, the focus will be on US labour market data, business activity indices, and other macroeconomic indicators capable of changing expectations regarding the Fed's next steps. At the same time, commodity price movements and overall investor sentiment will remain important drivers for the Australian currency.
AUDUSD technical analysis
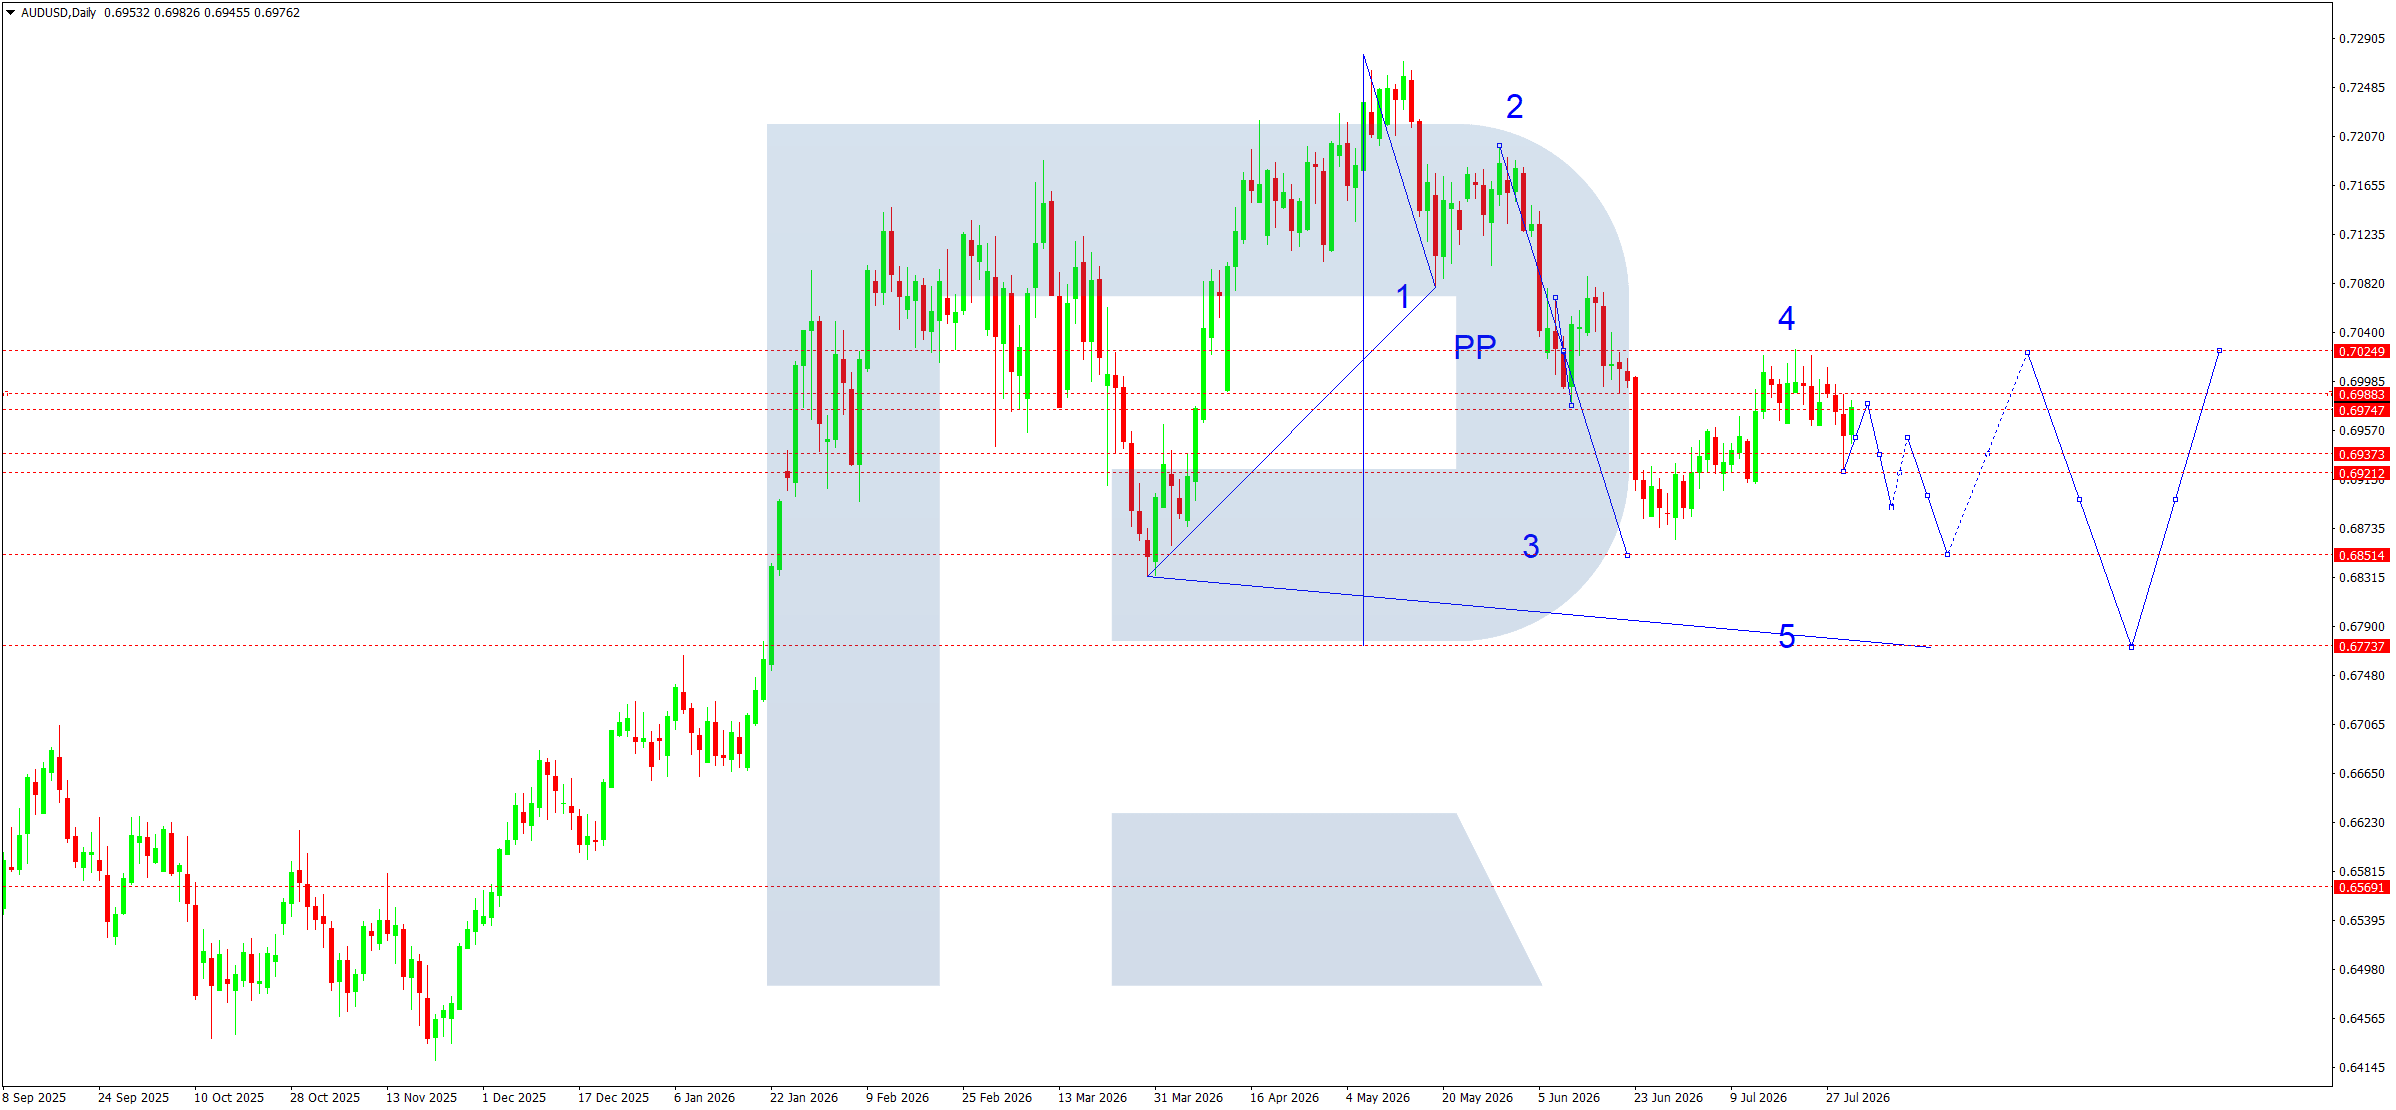
On the daily chart, AUDUSD maintains a medium-term bearish structure after the completion of an upward wave. An impulsive downward wave formed from the high near 0.7240, bringing the market to support at 0.6851. A corrective recovery is developing from this level.
According to the current wave structure, the market is forming corrective wave 4. The price continues to trade below the main pivot point (PP) at 0.7025, preserving sellers' medium-term advantage. As long as the quotes remain below this level, the current recovery should be viewed as a correction within a larger bearish structure.
The nearest resistance area is located within the 0.6998–0.7025 range. This is where sellers may become active again. A failure to establish a foothold above this area will increase the likelihood of another downward wave, initially targeting 0.6851.
The chart also suggests that corrective wave 4 may end around current levels, followed by the development of wave 5. The main downside target is near 0.6774, coinciding with the long-term objective shown on the chart. This area may become the final target of the current bearish cycle.
If buyers manage to establish a foothold above the 0.7025 pivot point, the bearish structure will temporarily lose relevance. In this case, the market could develop a deeper correction towards the next resistance areas, although this scenario remains alternative for now.
The indicator picture also supports a cautious approach. After a strong decline, the market is in a corrective recovery phase, but there are still insufficient signs of a new sustainable uptrend. Until the price moves above the PP, selling into strength remains the priority.
AUDUSD forecast scenarios
Bearish (base case): the corrective wave is expected to end in the 0.6998–0.7025 area, followed by a renewed decline towards 0.6851. A break below this support will increase the likelihood of a continued move towards 0.6774.
Bullish (alternative): if the price establishes a firm foothold above 0.7025 amid stronger demand, the corrective rise may continue towards 0.7080.
USDCAD forecast
USDCAD enters the first week of August under the continuing influence of several fundamental factors. Following the US Federal Reserve meeting, the market received a signal that a tight monetary policy approach would be maintained. The regulator left the interest rate unchanged, while divisions within the Federal Open Market Committee strengthened expectations that rate cuts remain unlikely in the near term. This continues to support the US dollar.
In Canada, investors remain focused on the domestic economic outlook following the publication of the Bank of Canada meeting minutes. The BoC confirmed its cautious stance, noting signs of economic recovery but emphasising persistent risks related to trade restrictions, weak investment, and uncertainty over external demand. High oil prices continue to provide additional support for the Canadian dollar, although this effect is partly offset by expectations of new trade restrictions between the US and Canada.
During the new week, market participants will therefore assess the resilience of the US economy, expectations regarding future Fed policy, oil market conditions, and developments in US-Canada trade relations. The combination of these factors could determine USDCAD's next direction.
USDCAD technical analysis
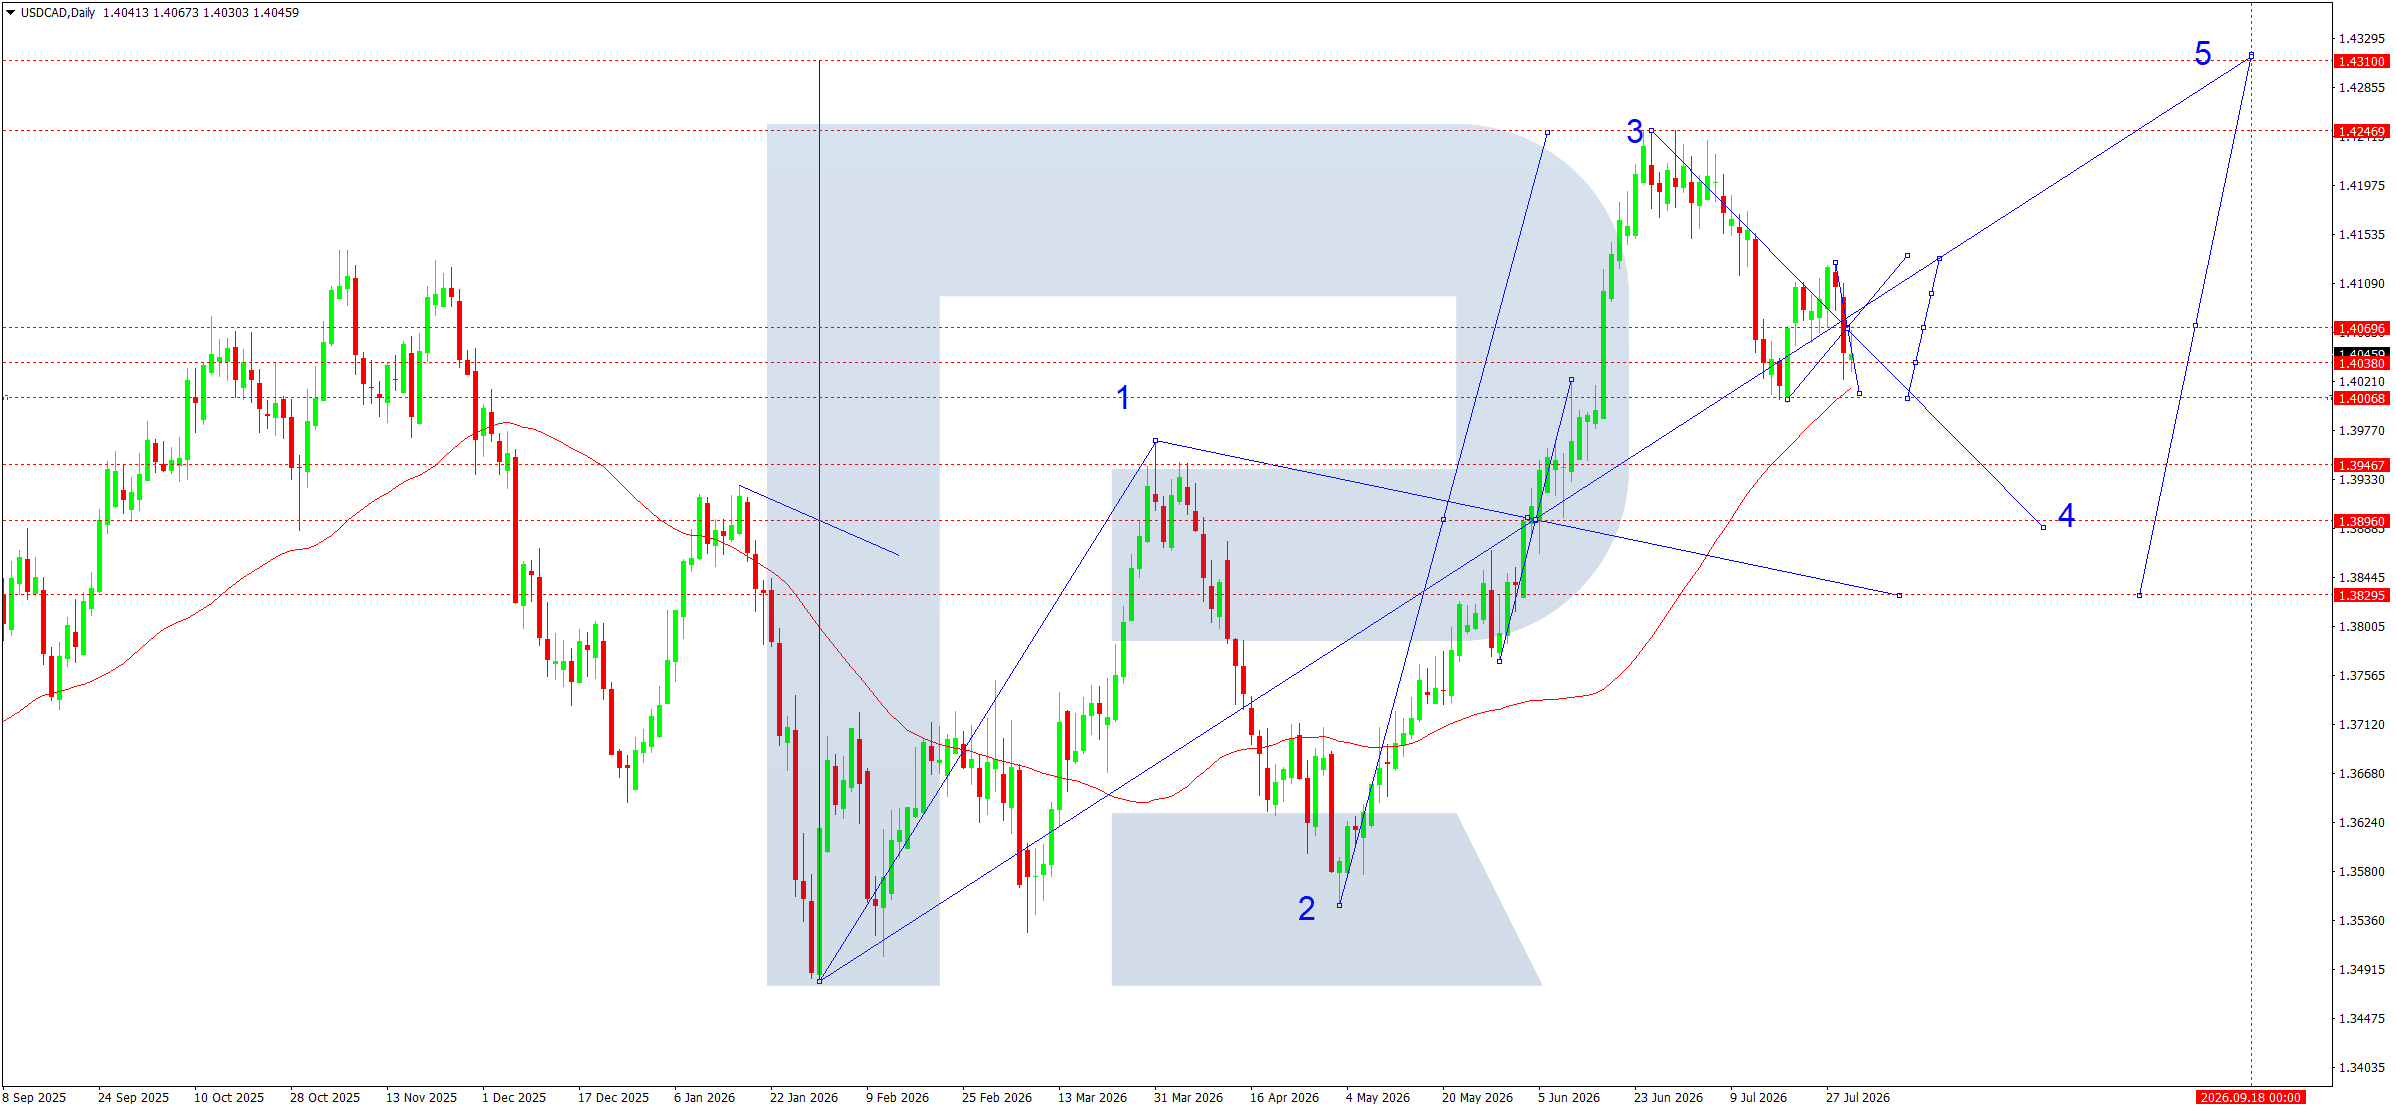
On the daily chart, the pair continues to form an upward structure after completing a major corrective wave. According to the Elliott wave labelling, the market completed the third impulsive wave near 1.4247, and corrective wave 4 is now developing.
The correction is unfolding within a descending channel, while the price remains above the long-term ascending trend line and the SMA50, which continues to act as dynamic support. This positioning preserves buyers' medium-term advantage.
The nearest support area is 1.4007–1.4038. This is where the local trend line intersects with previous reversal highs, making the range crucial for maintaining the bullish structure. As long as the market remains above this area, the current correction can be viewed as preparation for further growth.
The main target for the correction to end remains around 1.3896. A deeper decline could test the 1.3829 area, where the next strong support zone is located. However, the current wave structure does not yet confirm a transition to a full downtrend.
Once corrective wave 4 is complete, the final impulsive wave 5 is expected to form. According to the model shown, the main medium-term target is near 1.4310. This level coincides with the upper boundary of the long-term ascending channel and is the main target of the current bullish cycle.
Overall, the technical picture remains predominantly positive. As long as the price stays above the 1.4007 area, the preferred scenario is for the correction to end and a new upward wave to develop.
USDCAD forecast scenarios
Bullish (base case): the market completes its correction near 1.4007, with a possible retest of this level from above. A new upward wave is then expected to form, targeting 1.4069 and subsequently 1.4247.
Bearish (alternative): if the market establishes a foothold below 1.4007, the likelihood of a continued decline towards 1.3896 and 1.3829 will increase.
XAUUSD forecast
Gold ends the week amid elevated uncertainty while retaining strong investor interest. The main event was the US Federal Reserve's decision to leave the interest rate unchanged. At the same time, the published US inflation data came in below expectations, which reduced dollar yields and supported the precious metal. The market is gradually scaling back expectations of further monetary tightening, although Fed officials continue to maintain a cautious stance.
Geopolitical tensions in the Middle East remain an additional source of support for gold. Risks to global energy supplies are keeping oil market volatility elevated, increasing demand for safe-haven assets. At the same time, rising oil prices support inflation expectations and limit the potential for rapid Fed easing. At the beginning of the new week, the gold market will therefore remain influenced by two opposing factors: a weaker dollar and persistent inflation risks.
XAUUSD technical analysis
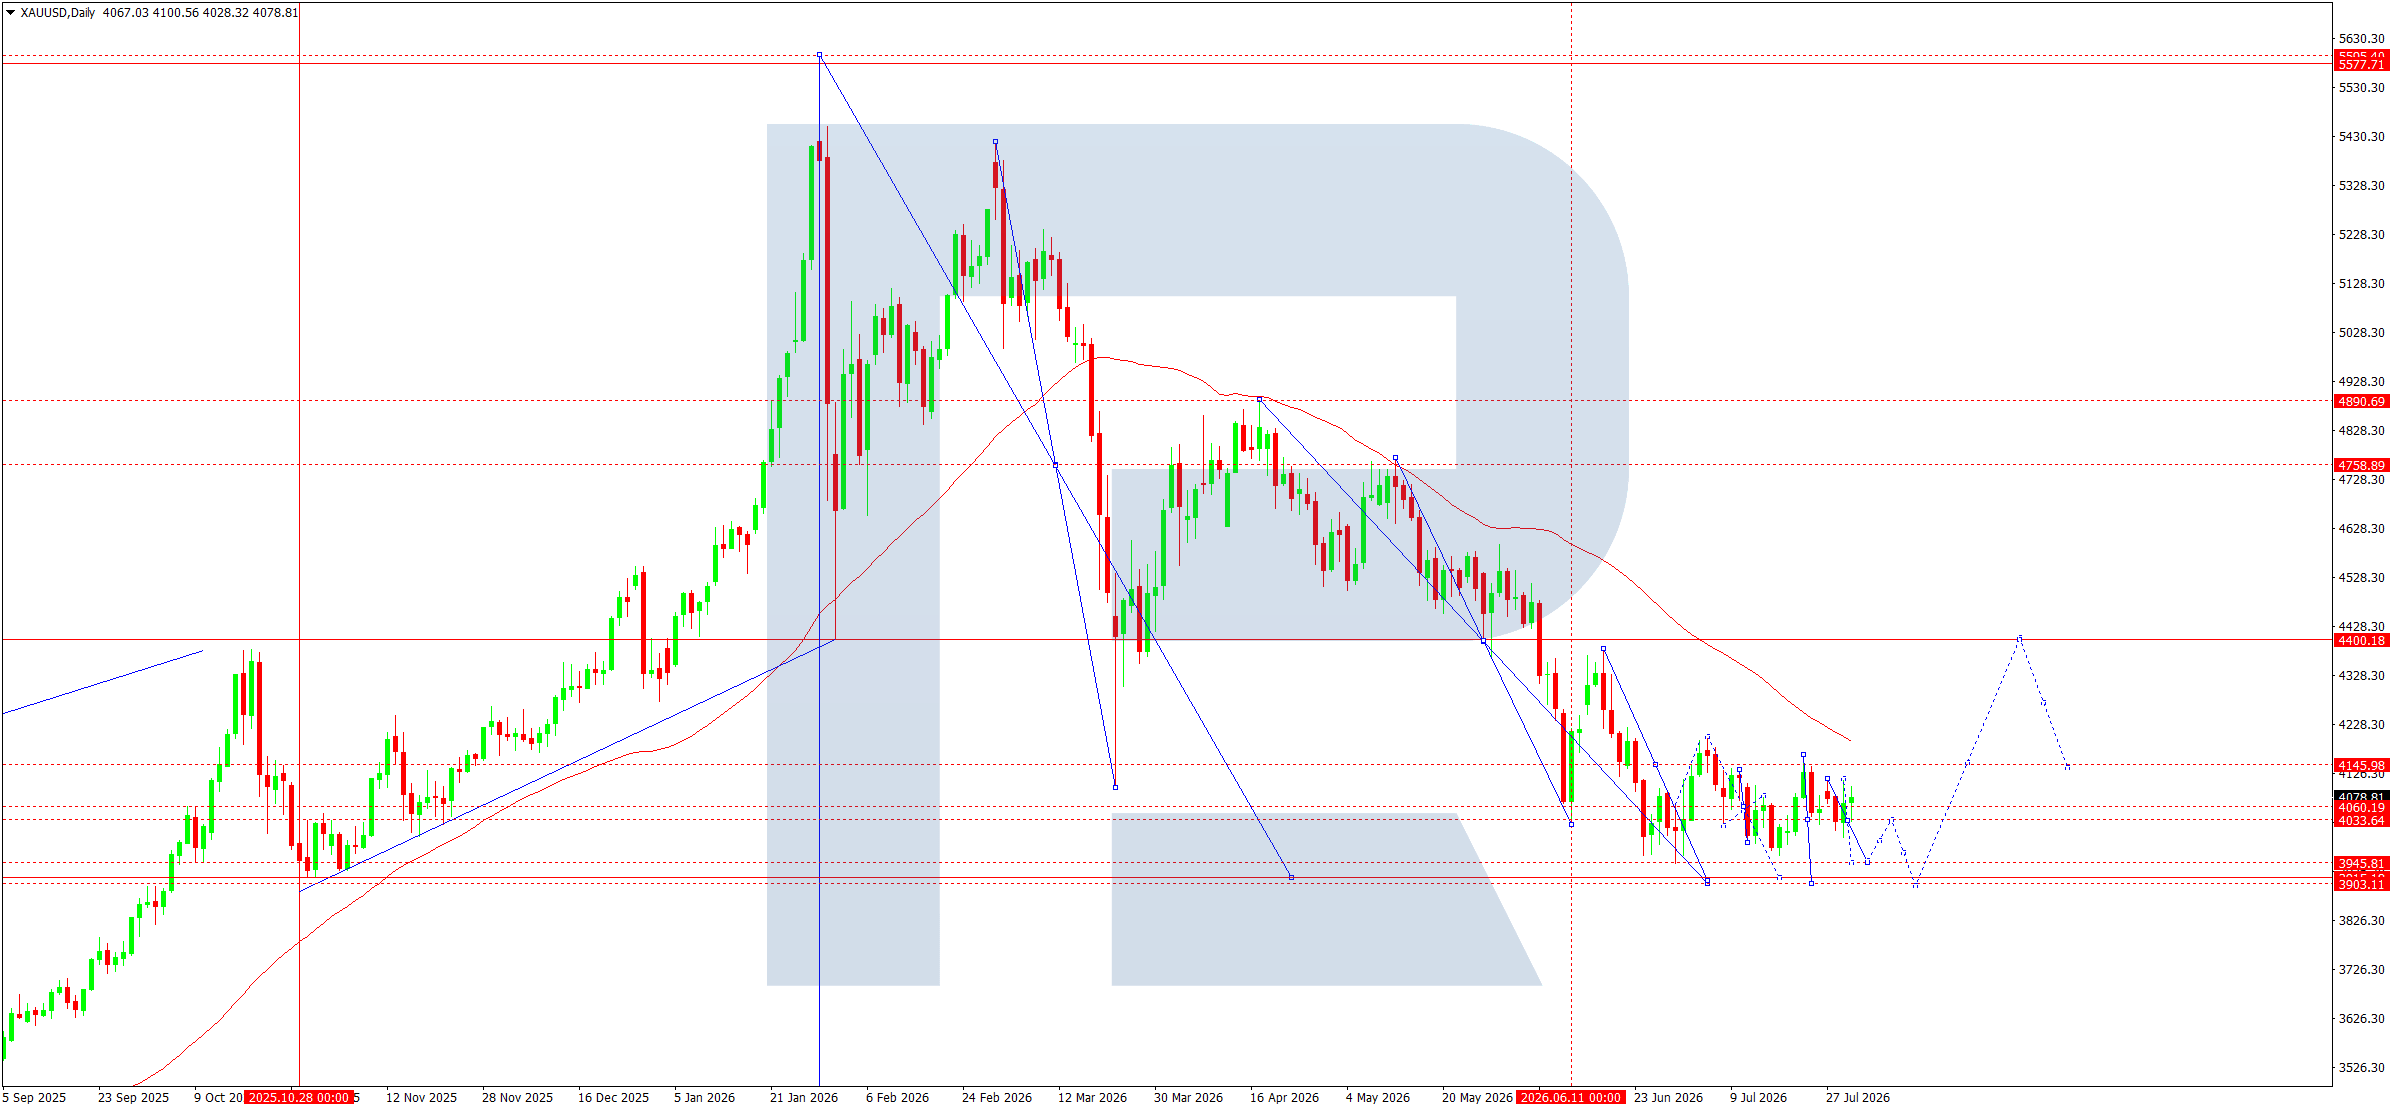
The daily chart maintains a pronounced downward structure. After forming a major peak near 5,577, the market continues to develop a sequence of lower highs and lower lows. The price remains firmly below the SMA50, which continues to decline and acts as dynamic resistance, confirming the medium-term bearish trend.
The quotes are currently consolidating within the 3,945–4,060 range. This area can be viewed as an accumulation zone ahead of the next impulsive move. According to the Elliott wave structure, the decline is developing within the final downward wave, after which a deeper correction may form.
The 4,060 level remains the nearest market pivot point. As long as the price stays below it, sellers retain the advantage. The 4,150 area provides additional resistance, coinciding with previous local highs and the start of the descending channel. Only a firm hold above this zone would indicate that the current decline is ending.
Support is located around 3,945–3,903. This area has repeatedly halted sellers and remains the key target of the current downward move. The wave labelling shown on the chart also suggests the possibility of another test of the 3,900 zone before a larger upward correction begins.
If sellers establish a foothold below 3,900, the downward impulse may accelerate. However, signs of a slowing decline, a narrowing range of fluctuations, and the formation of a sideways structure indicate that the market is gradually approaching the end of the current bearish phase.
Once a base is formed, a corrective rise is expected first towards 4,150 and then towards 4,400, where the next strong resistance and the descending SMA50 are located. This zone will become the main target for buyers if a reversal is confirmed.
XAUUSD forecast scenarios
Bearish (base case): a consolidation range has formed around 4,060. A downside breakout with a retest of the 3,945–3,900 area remains the most likely outcome. Once the downward wave is complete, a corrective rise towards 4,150 and then 4,400 may develop.
Bullish (alternative): if the price establishes a firm foothold above 4,150 amid rising volumes, the likelihood of a full upward correction towards 4,400 will increase.
US 500 forecast
The US stock market ends the final week of July amid elevated volatility. The main event was the Federal Reserve meeting, at which the regulator kept the interest rate unchanged but made it clear that the fight against inflation is not yet over. The regulator's more hawkish rhetoric pushed up US Treasury yields and increased investor caution towards risk assets.
The busy corporate earnings season also affected the index's performance. Strong results from Microsoft supported the technology sector, while the market's weak reaction to Meta's report triggered local profit-taking among the largest companies. Market participants are also focused on the quarterly results of Apple and Amazon, which could shape investor sentiment at the beginning of the new week.
The macroeconomic backdrop remains mixed. Despite signs that inflation is gradually slowing, high energy prices caused by persistent geopolitical tensions continue to create inflation risks. As a result, investors are assessing the likelihood that the Fed will maintain tight monetary policy for longer than expected, limiting the potential for further gains in US indices.
US 500 technical analysis
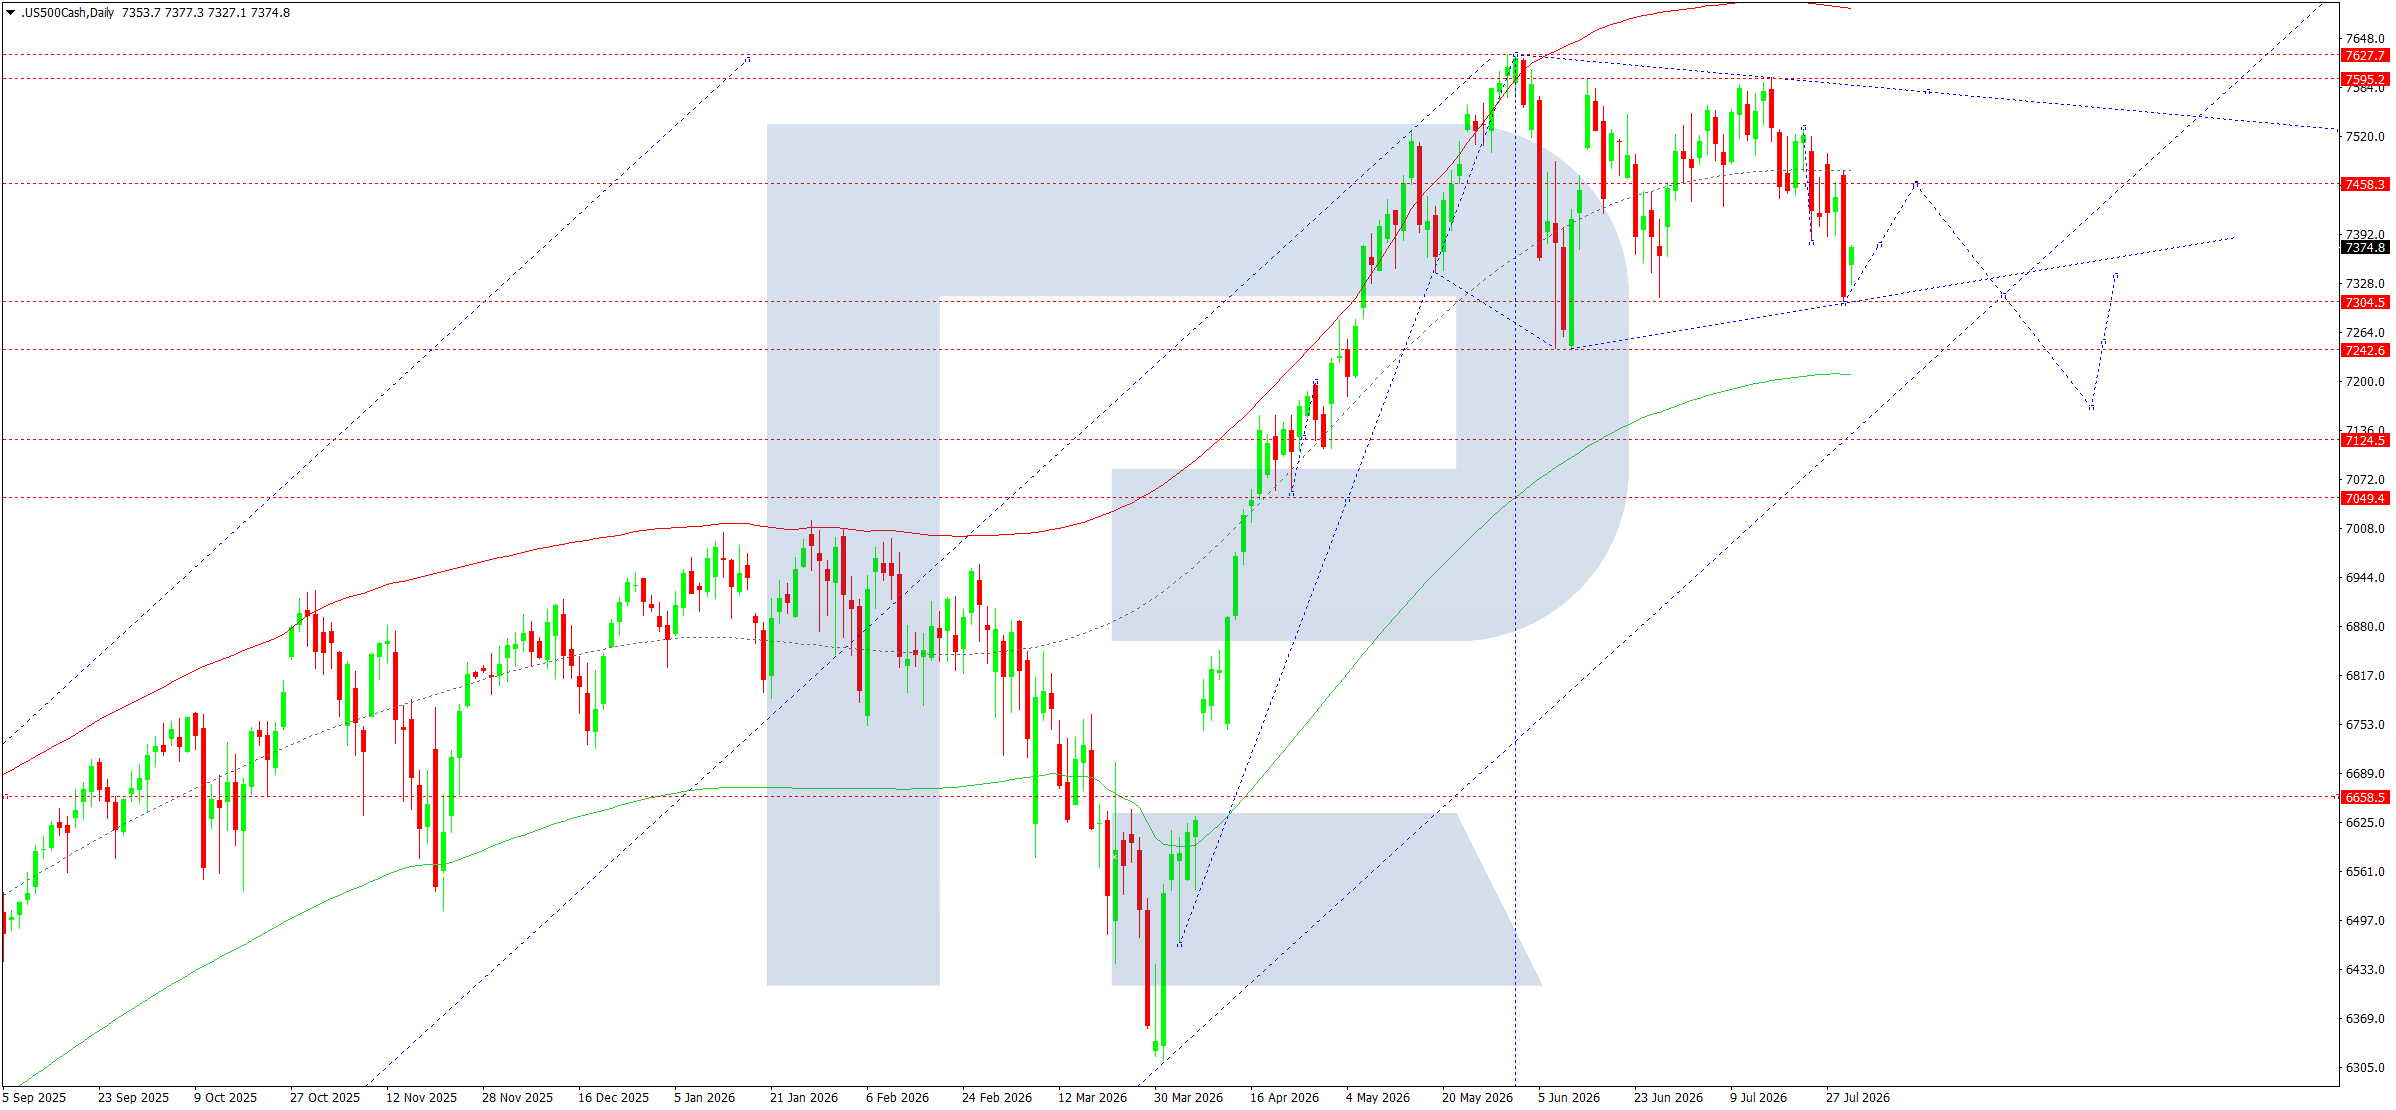
The US 500 daily chart shows that after setting a new all-time high near 7,628, the market entered a correction and consolidation phase. Buyers are still holding the price above the strategic support at 7,304, indicating that the medium-term uptrend remains intact.
According to the wave structure shown, the decline of recent days can be viewed as a corrective wave within a larger bullish cycle. The chart clearly shows a broad consolidation zone forming between 7,304 and 7,458. This area is becoming the key pivot zone for the coming week.
The red long-term moving average continues to rise and is located well below current prices, confirming that the main bullish trend remains in place. The green medium-term moving average is also pointing upwards and runs around 7,240–7,260, reinforcing support at 7,242.
From the wave-model perspective, holding above 7,304 will allow the current correction to end and a new upward wave to form, with resistance at 7,458 retested. A firm hold above this level will open the way towards 7,595 and then the all-time resistance at 7,628.
If sellers manage to establish a foothold below 7,304, the likelihood of a deeper corrective wave will increase. The next technical target will be support at 7,242, where an important intersection of dynamic support and the local ascending channel is located. A break below it will open the way towards the next strong level at 7,124.
Overall, the chart structure remains constructive for buyers. As long as the index stays above the 7,242–7,304 area, the decline should be viewed as a correction within the long-term uptrend rather than the beginning of a full reversal.
US 500 forecast scenarios
Bearish (base case): the market completes its correction near 7,304, after which a recovery towards 7,458 develops. A firm break above this resistance could allow growth to continue towards 7,595.
Bullish (alternative): if sellers establish a foothold below 7,304, the correction may deepen, followed by a decline towards 7,242. A break below this support will make the 7,124 area the next target.
BTCUSD forecast
Bitcoin ends July in a consolidation phase after high volatility caused by the US Federal Reserve meeting. The regulator kept the interest rate unchanged, although its rhetoric remained fairly hawkish as inflation risks are still assessed as elevated. This limits demand for risk assets, including cryptocurrencies, although the absence of further monetary tightening was viewed by the market as neutral to positive.
The earnings reports of major US technology companies remain an additional factor. Strong results from some sector representatives are supporting investor interest in high-risk assets, although the overall stock market performance remains mixed. Market participants are also continuing to monitor geopolitical developments in the Middle East closely, as oil price fluctuations directly affect inflation expectations and the Fed's future decisions.
Institutional investor activity remains high in the cryptocurrency sector. After significant outflows from spot Bitcoin ETFs in June, July saw individual days of sustained capital inflows, indicating continued long-term interest from major market participants. At the same time, open interest in the futures market reached its highest levels in recent months, suggesting that traders are preparing for a new impulsive move.
BTCUSD technical analysis
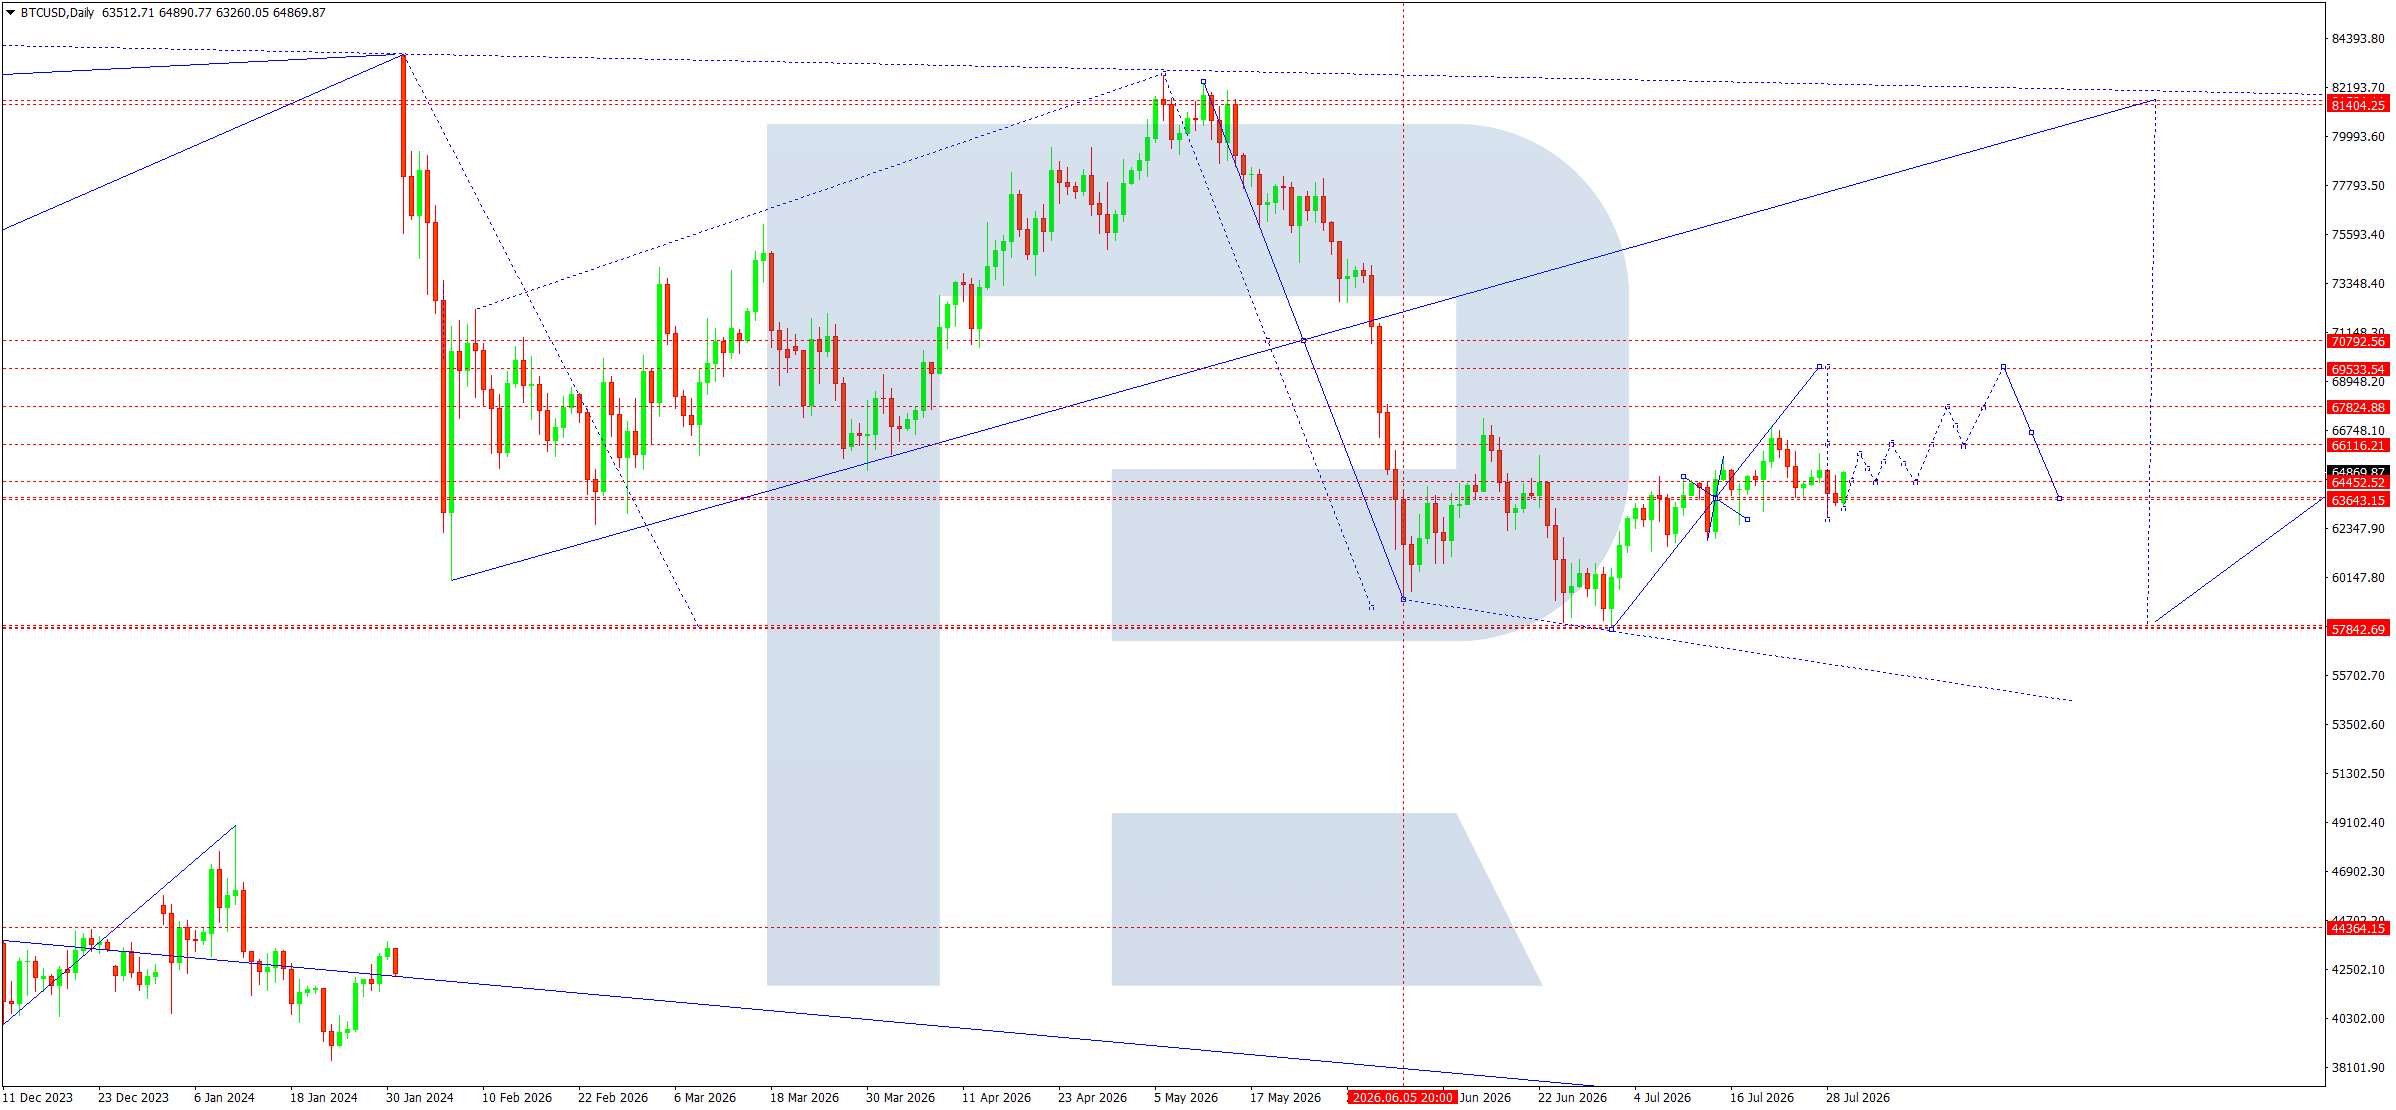
On the daily chart, BTCUSD continues to form a recovery wave after the June decline towards the 57,840 area. Buyers managed to defend the strategic support, after which the price began forming a sequence of higher lows. This confirms a gradual recovery in the medium-term structure.
The market is currently trading around 63,500–64,500, where the key matrix pivot point is located. This range will determine the direction of movement in the first week of August. The chart shows that the price has tested the 64,350–64,450 area several times but has so far failed to establish a foothold above it. This makes the level the most important short-term resistance.
As long as support at 63,430 holds, buyers retain the initiative. In this case, the first target is resistance at 66,160, which coincides with the upper boundary of the local wave structure. A firm hold above this level will allow the upward movement to extend towards the 67,820–69,330 zone, where the next strong supply area is located. According to the Elliott wave labelling, this area is viewed as the main target of the current upward wave.
The formation of an ascending channel is an additional positive factor, with the price continuing to move within it after the June reversal. As long as the quotes remain above the lower boundary of the channel, the structure remains favourable for gradual growth.
However, the alternative scenario cannot yet be completely ruled out. A failed attempt to establish a foothold above 64,450 may trigger another wave of profit-taking. In this case, the first target for sellers will be support at 63,430. A break below it will open the way towards 62,400 and then increase the likelihood of a retest of the strategic support at 57,840, from which the market recovery previously began.
Overall, the technical picture is gradually improving. A series of higher lows indicates that buyers are regaining control, although a definitive confirmation of a change in the medium-term trend will only appear after a firm hold above the 66,160 zone.
BTCUSD forecast scenarios
Bearish (base case): the market holds above 63,430 and establishes a foothold above 64,450. In this case, the likelihood of growth first towards 66,160 and then towards 67,820–69,330 will increase.
Bullish (alternative): if 63,430 is broken to the downside, selling pressure will intensify, opening the potential for a decline first towards 62,400 and then towards the strategic support at 57,840.
Editors’ picks
 EURUSD forecast 2026–2027: technical analysis, price levels & predictions
EURUSD has pulled back from the 2026 high of 1.1915 and is now trading near 1.1450 — below both EMA65 and EMA200 — with the active scenario shifting from bullish to bearish. The ECB raised rates to 2.40%, but the Fed holds at 3.75%, and US inflation (3.5%) continues to outpace the eurozone (2.8%). A confirmed break below 1.1280 opens the next downward wave toward 1.1080. We break down the key levels, three trading scenarios with entry triggers, and what Deutsche Bank, Morgan Stanley and UBS are forecasting for EURUSD in 2026.
 Gold (XAUUSD) forecast 2026: predictions based on fundamental and technical analysis
Gold has corrected over 25% from its all-time high of 5,597 USD and is now trading near 4,100 USD — testing a critical support zone. Is this the bottom, or will the downtrend continue? We break down the key levels (support 3,920 USD, breakout trigger 4,500 USD), three trading scenarios with entry levels, and what J.P. Morgan, Goldman Sachs and Deutsche Bank are forecasting for gold in 2026.
Forecasts presented in this section only reflect the author’s private opinion and should not be considered as guidance for trading. RoboForex bears no responsibility for trading results based on trading recommendations described in these analytical reviews.