
Weekly technical analysis and forecast (17–21 August 2026)
In this weekly technical analysis, we examine the key chart patterns and price levels for EURUSD, USDJPY, GBPUSD, AUDUSD, USDCAD, Gold (XAUUSD), US 500, and Bitcoin (BTCUSD) to forecast market developments for the week ahead (17–21 August 2026).
Major technical levels to watch this week
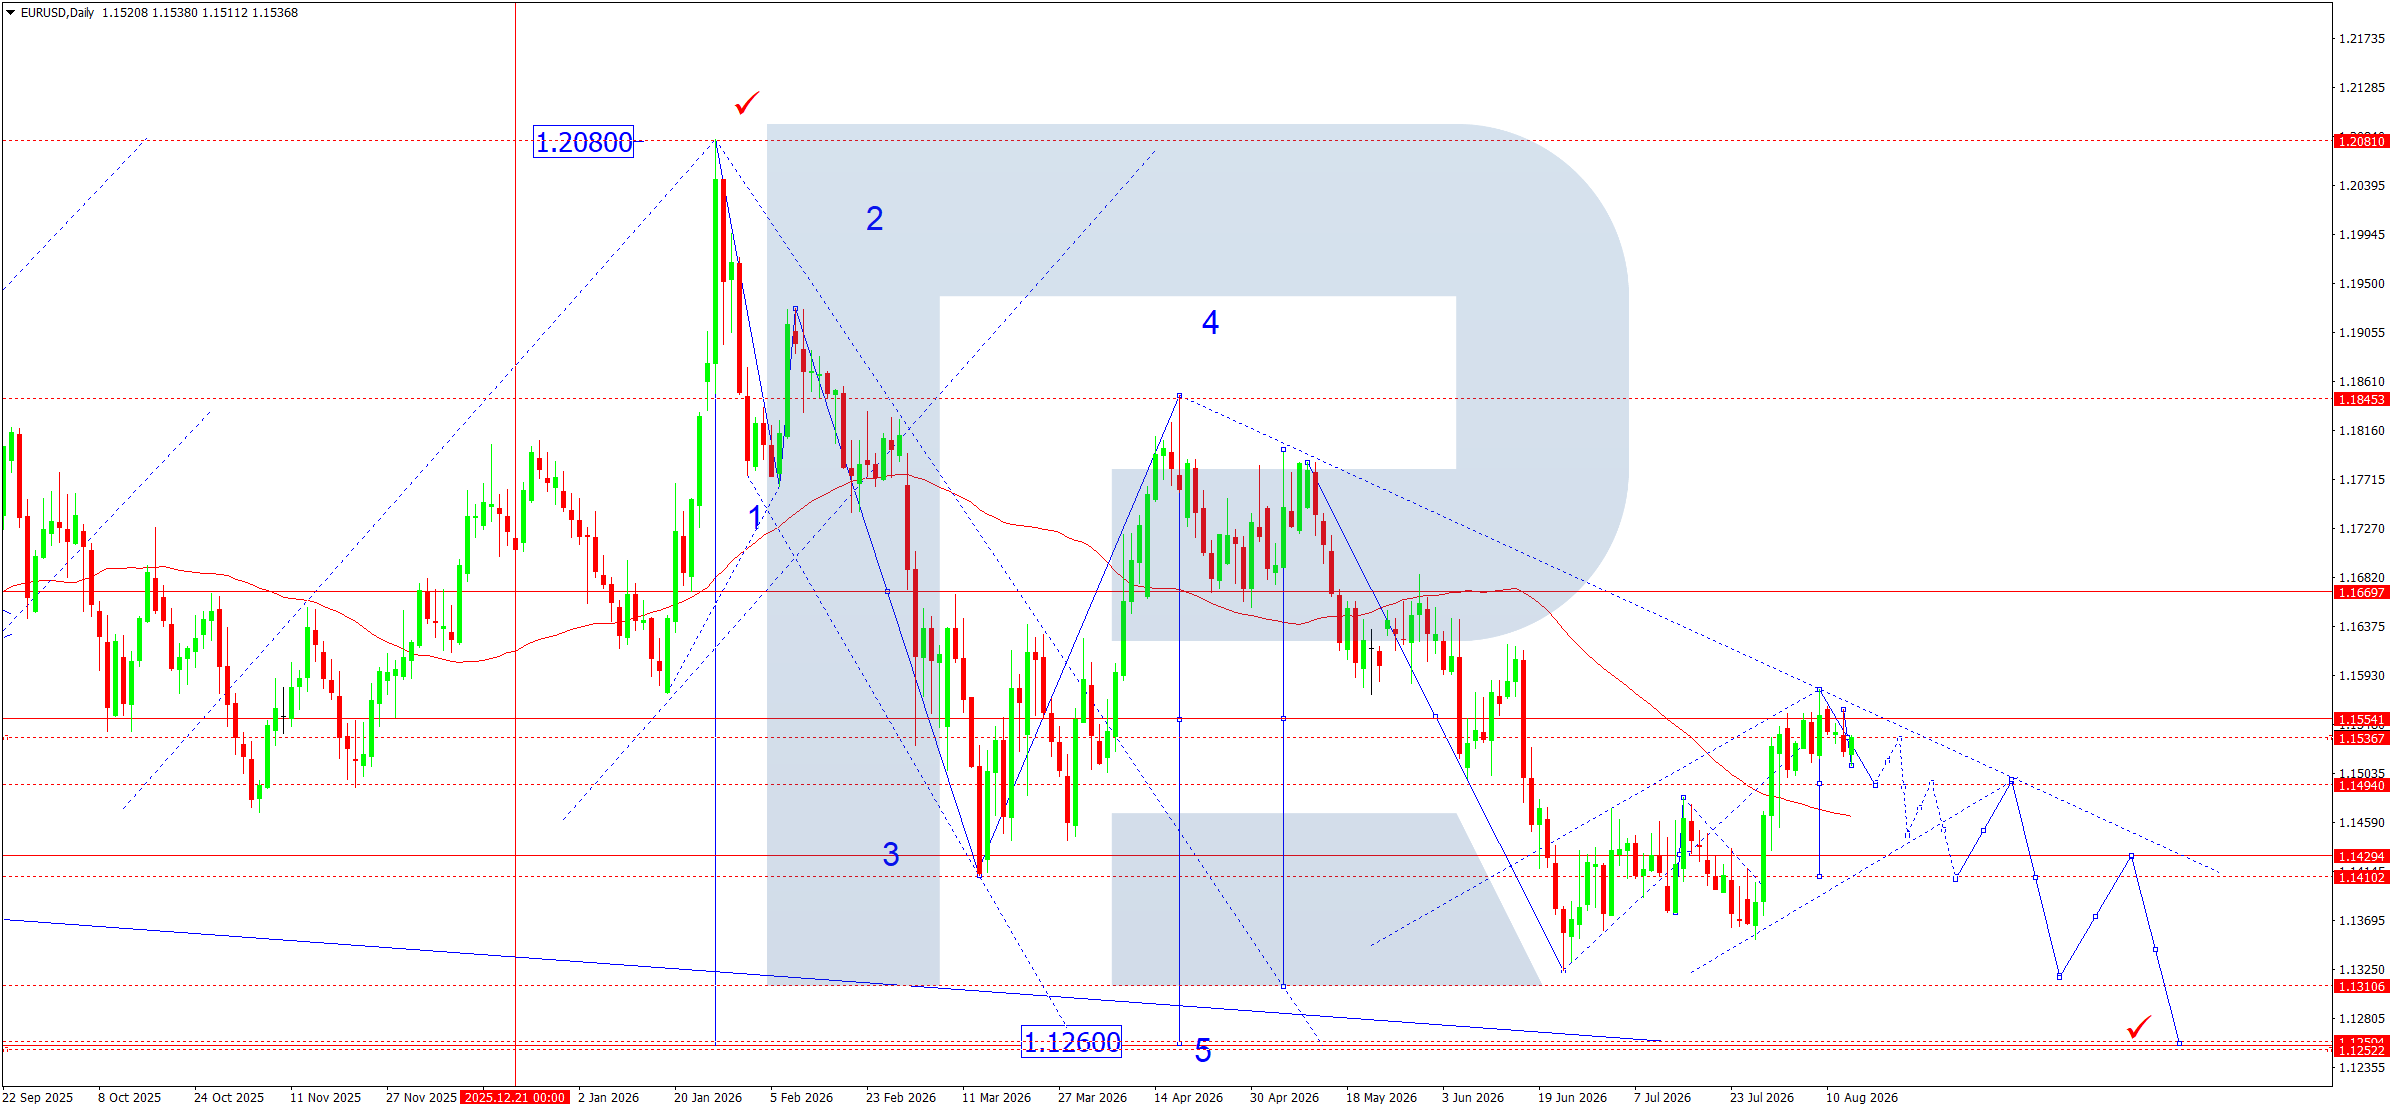
- EURUSD: Support: 1.1494, 1.1429. Resistance: 1.1554, 1.1670
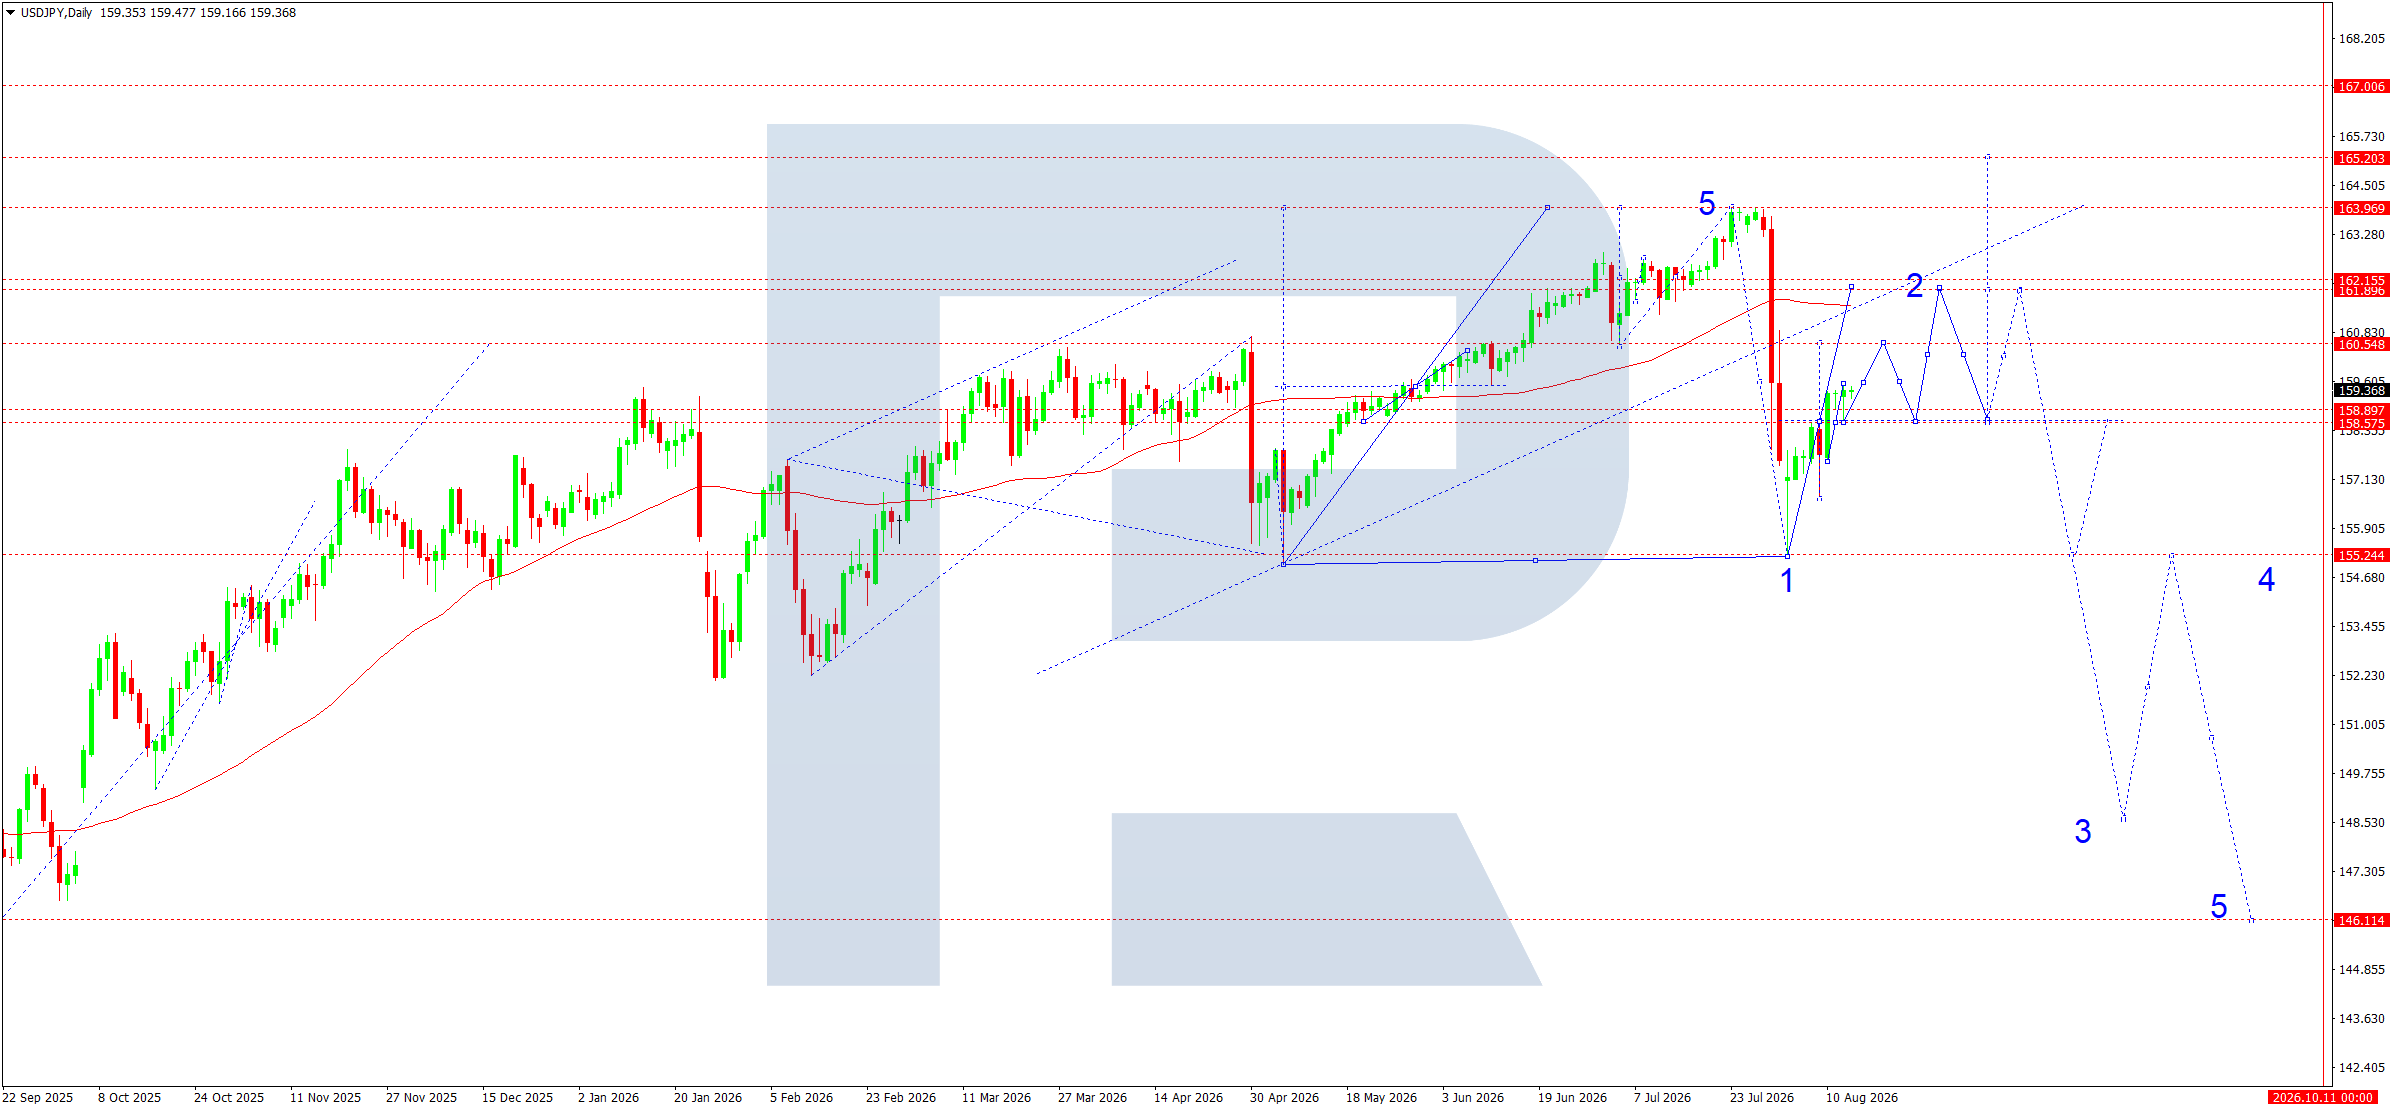
- USDJPY: Support: 158.58, 155.22. Resistance: 160.55, 161.90
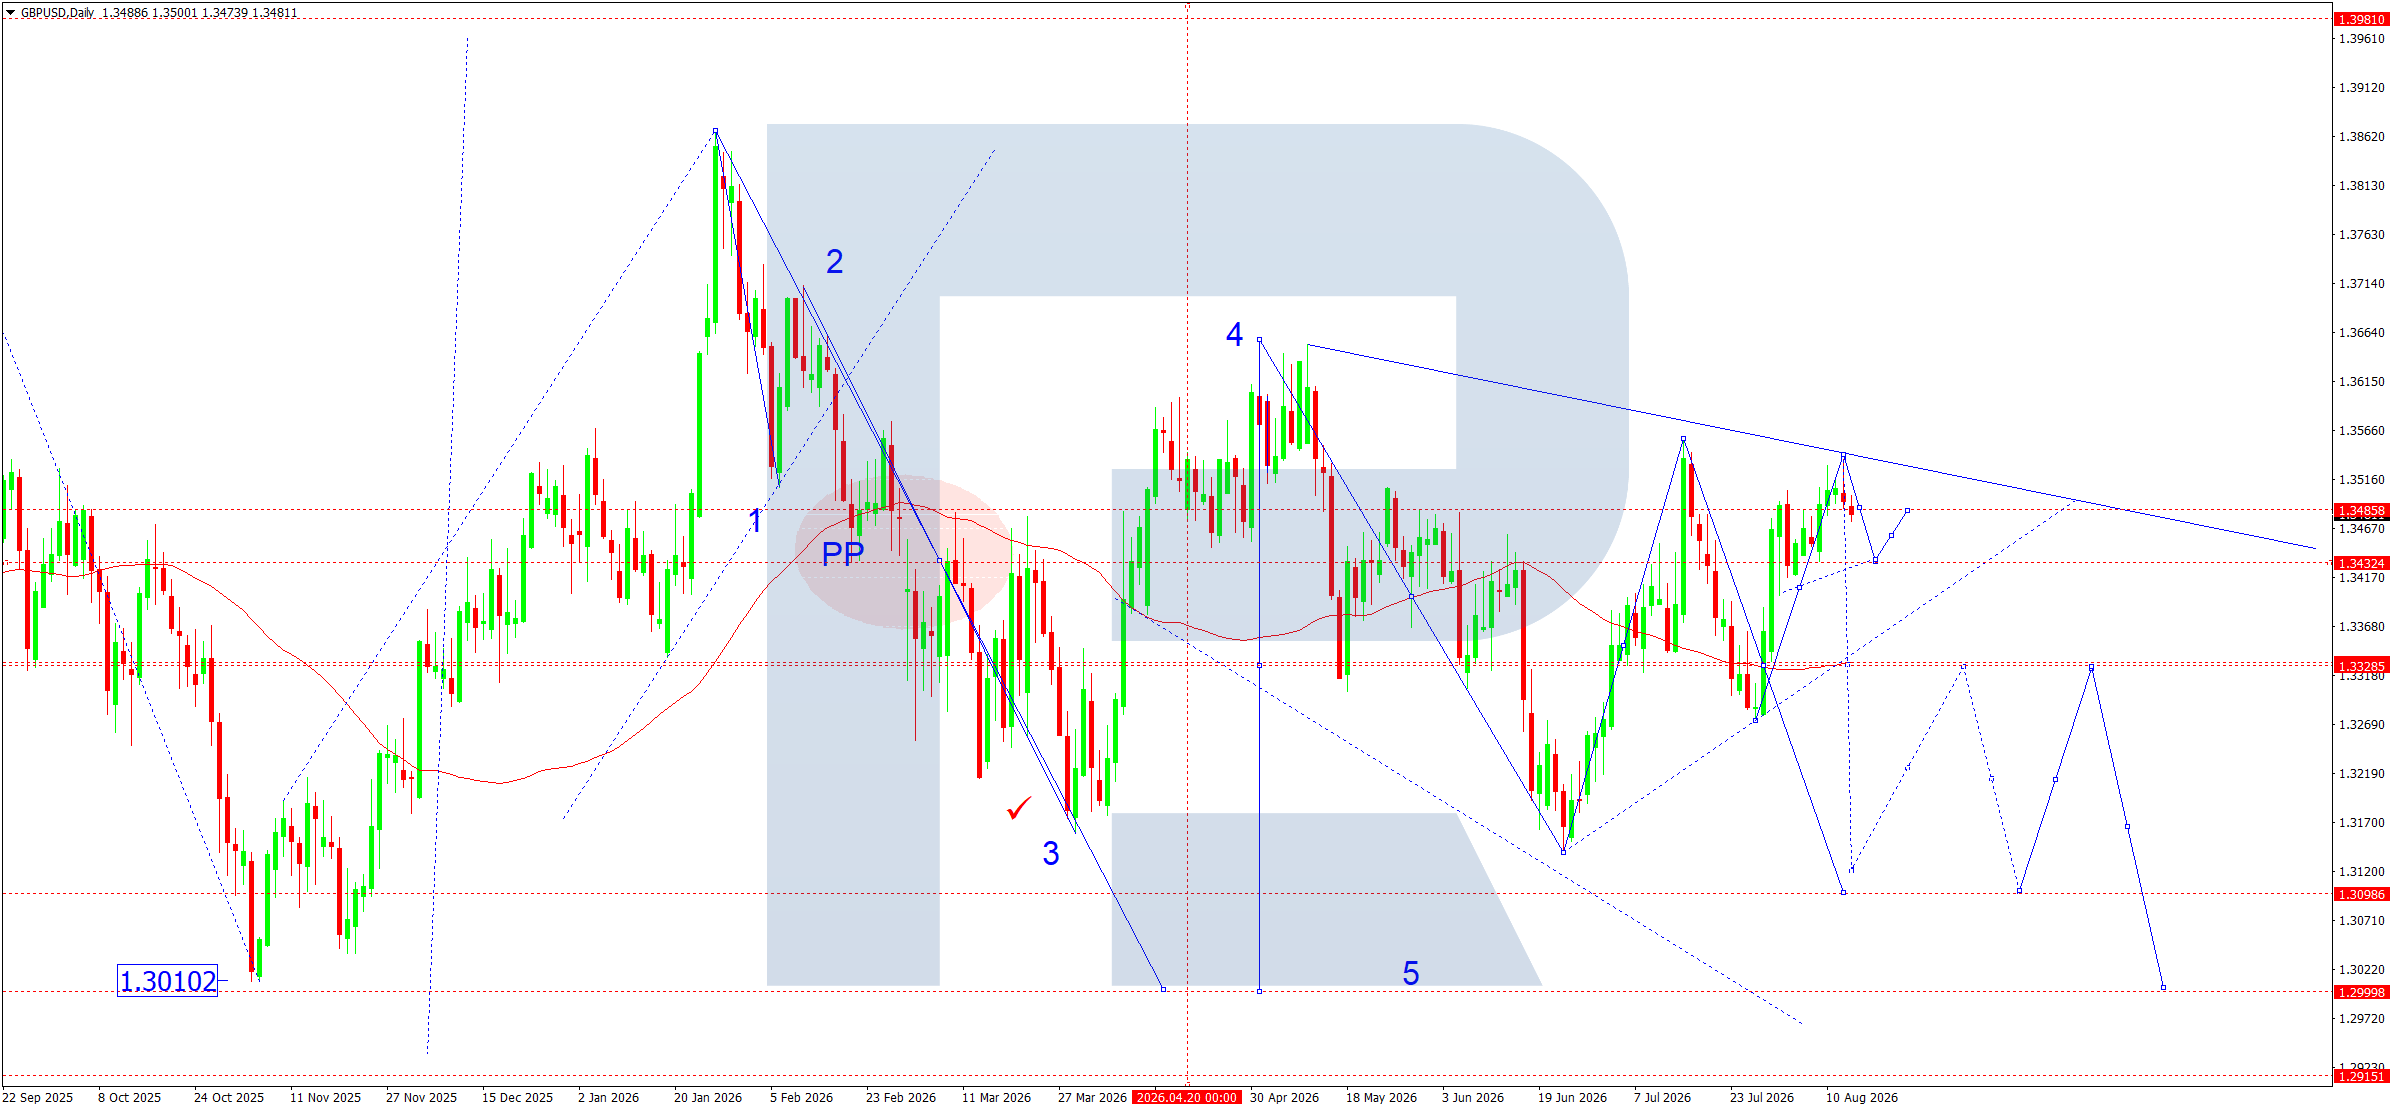
- GBPUSD: Support: 1.3432, 1.3329. Resistance: 1.3485, 1.3560
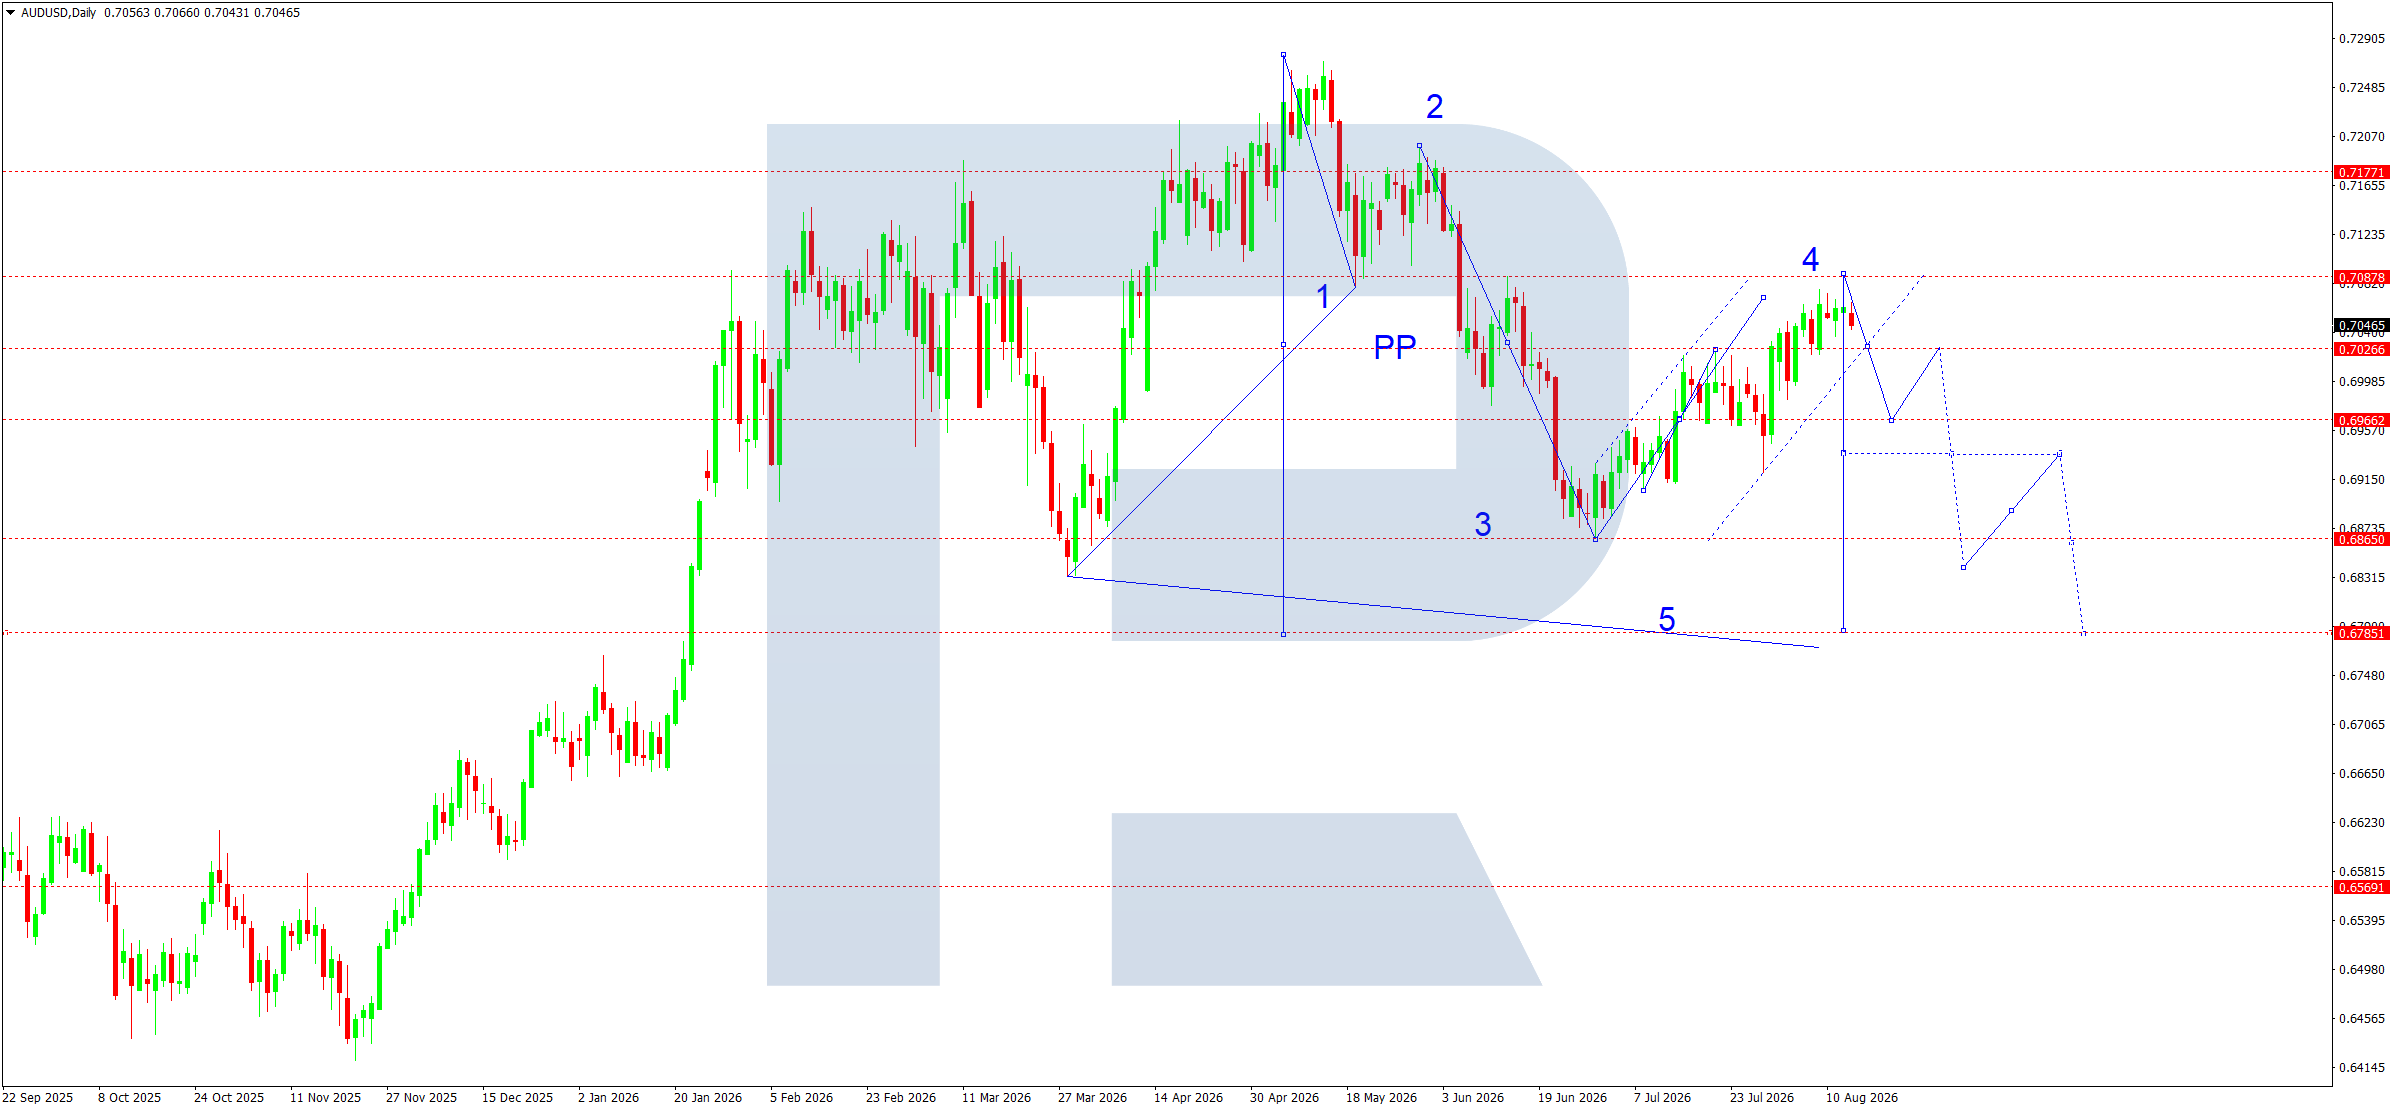
- AUDUSD: Support: 0.7026, 0.6965. Resistance: 0.7088, 0.7140
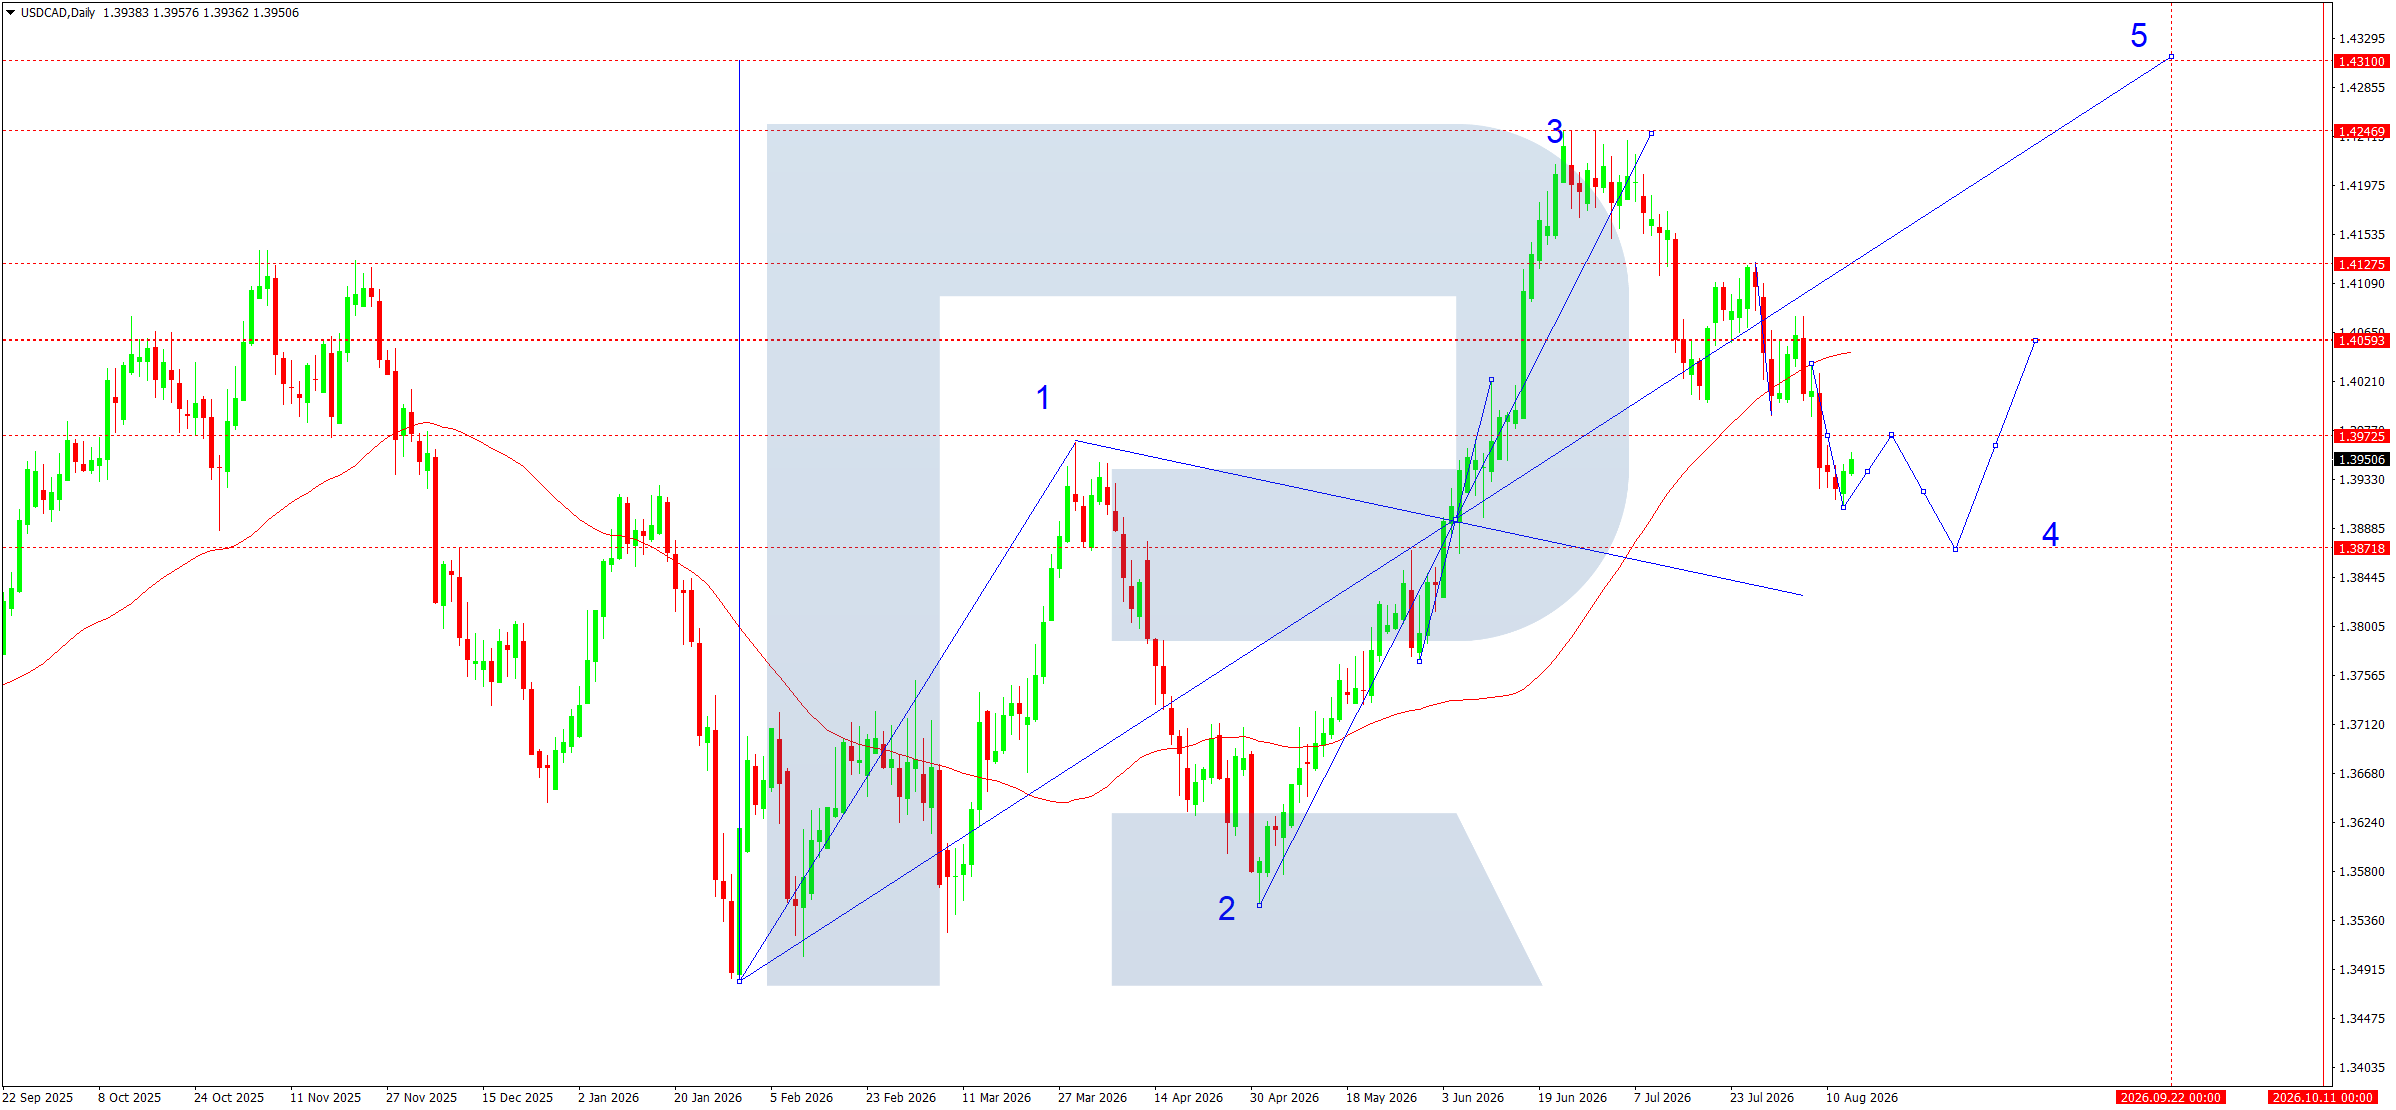
- USDCAD: Support: 1.3872, 1.3825. Resistance: 1.3973, 1.4059
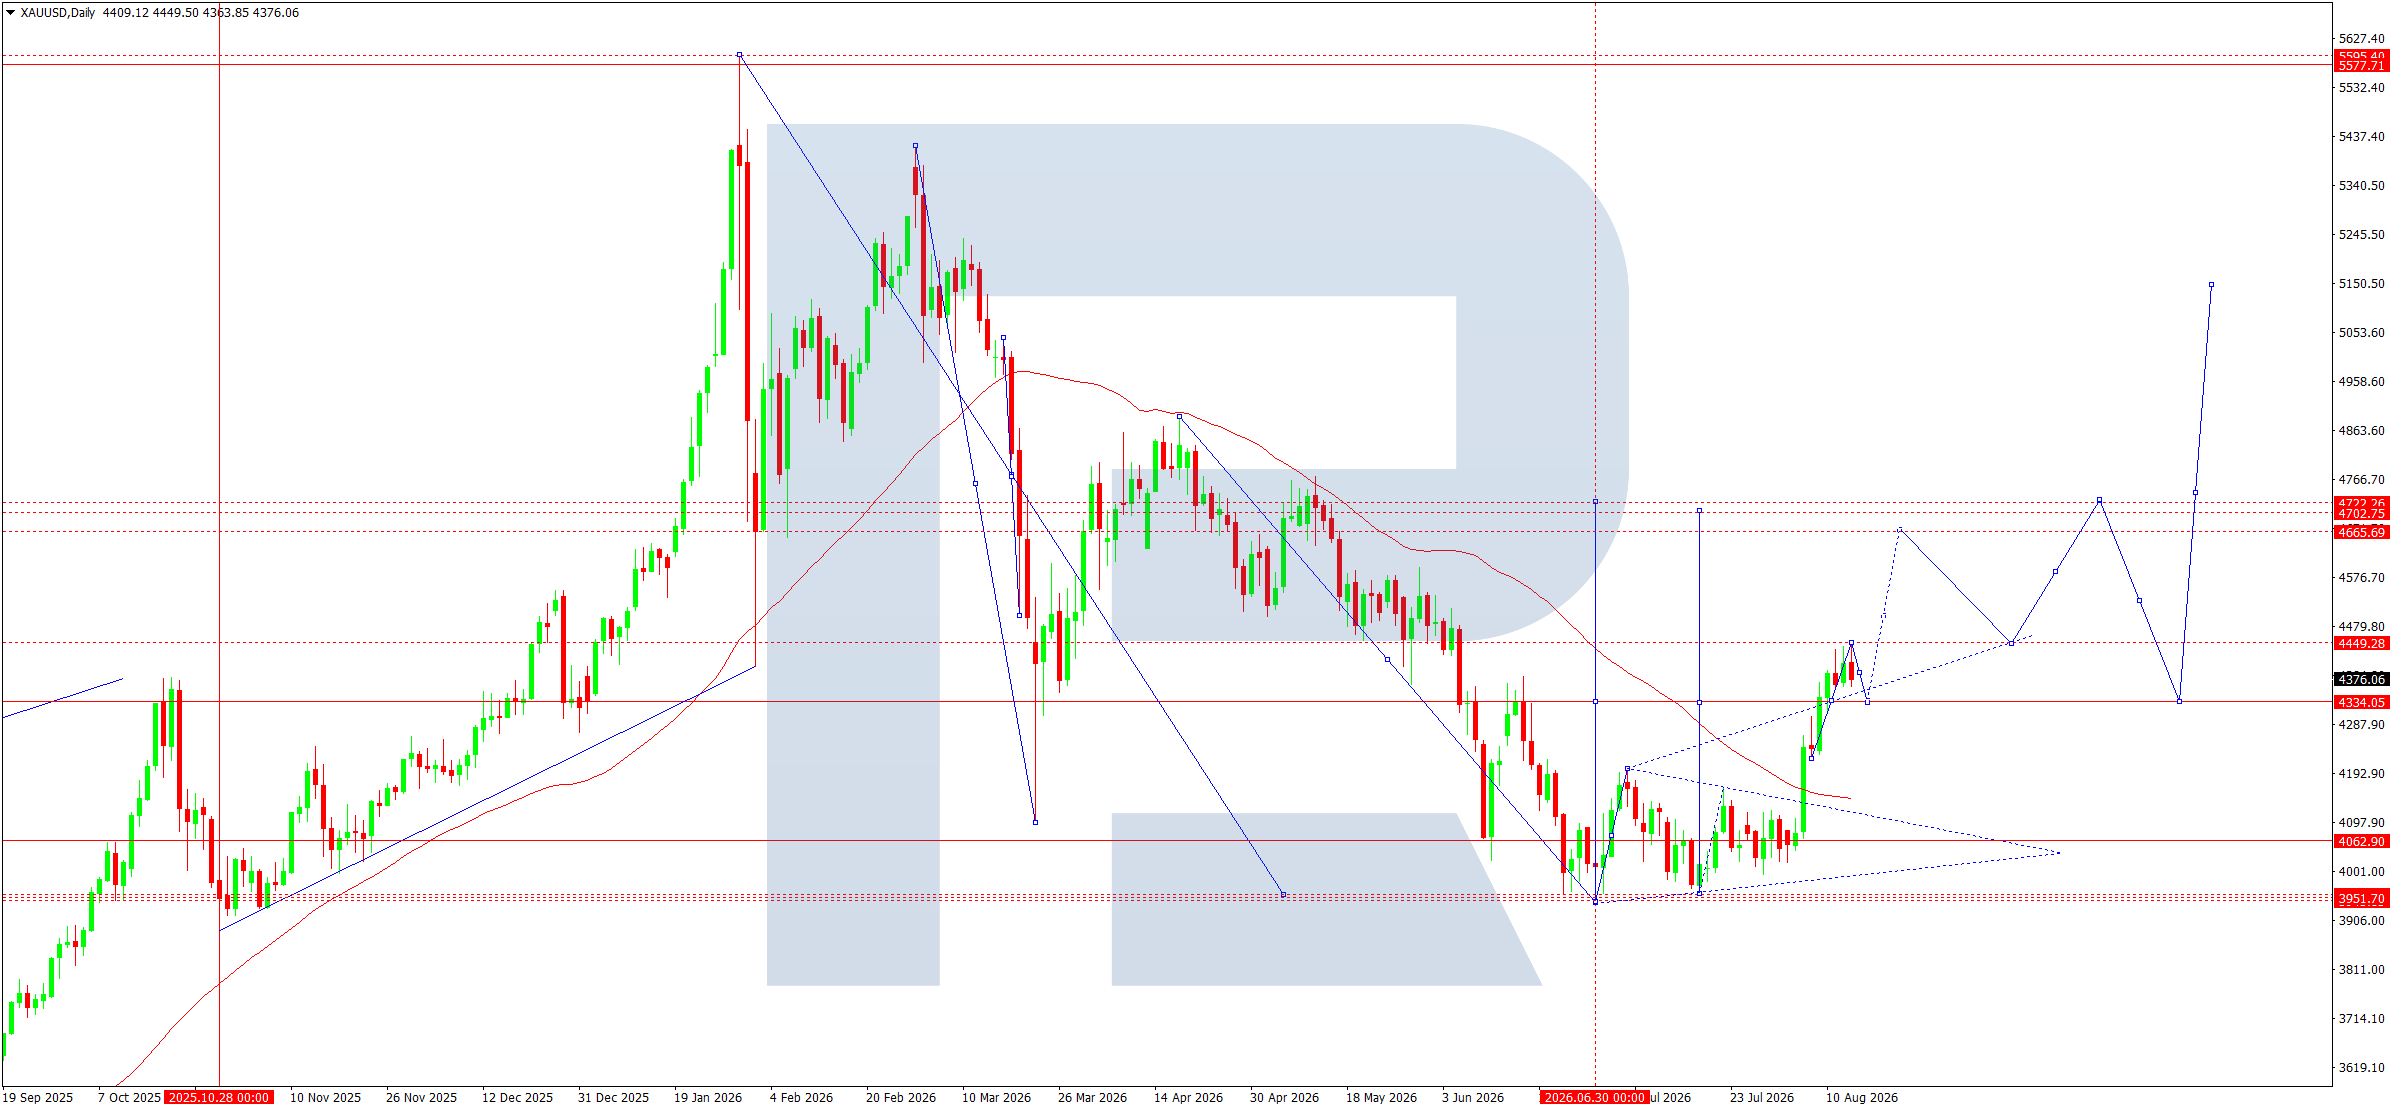
- Gold: Support: 4,334, 4,263. Resistance: 4,449, 4,666
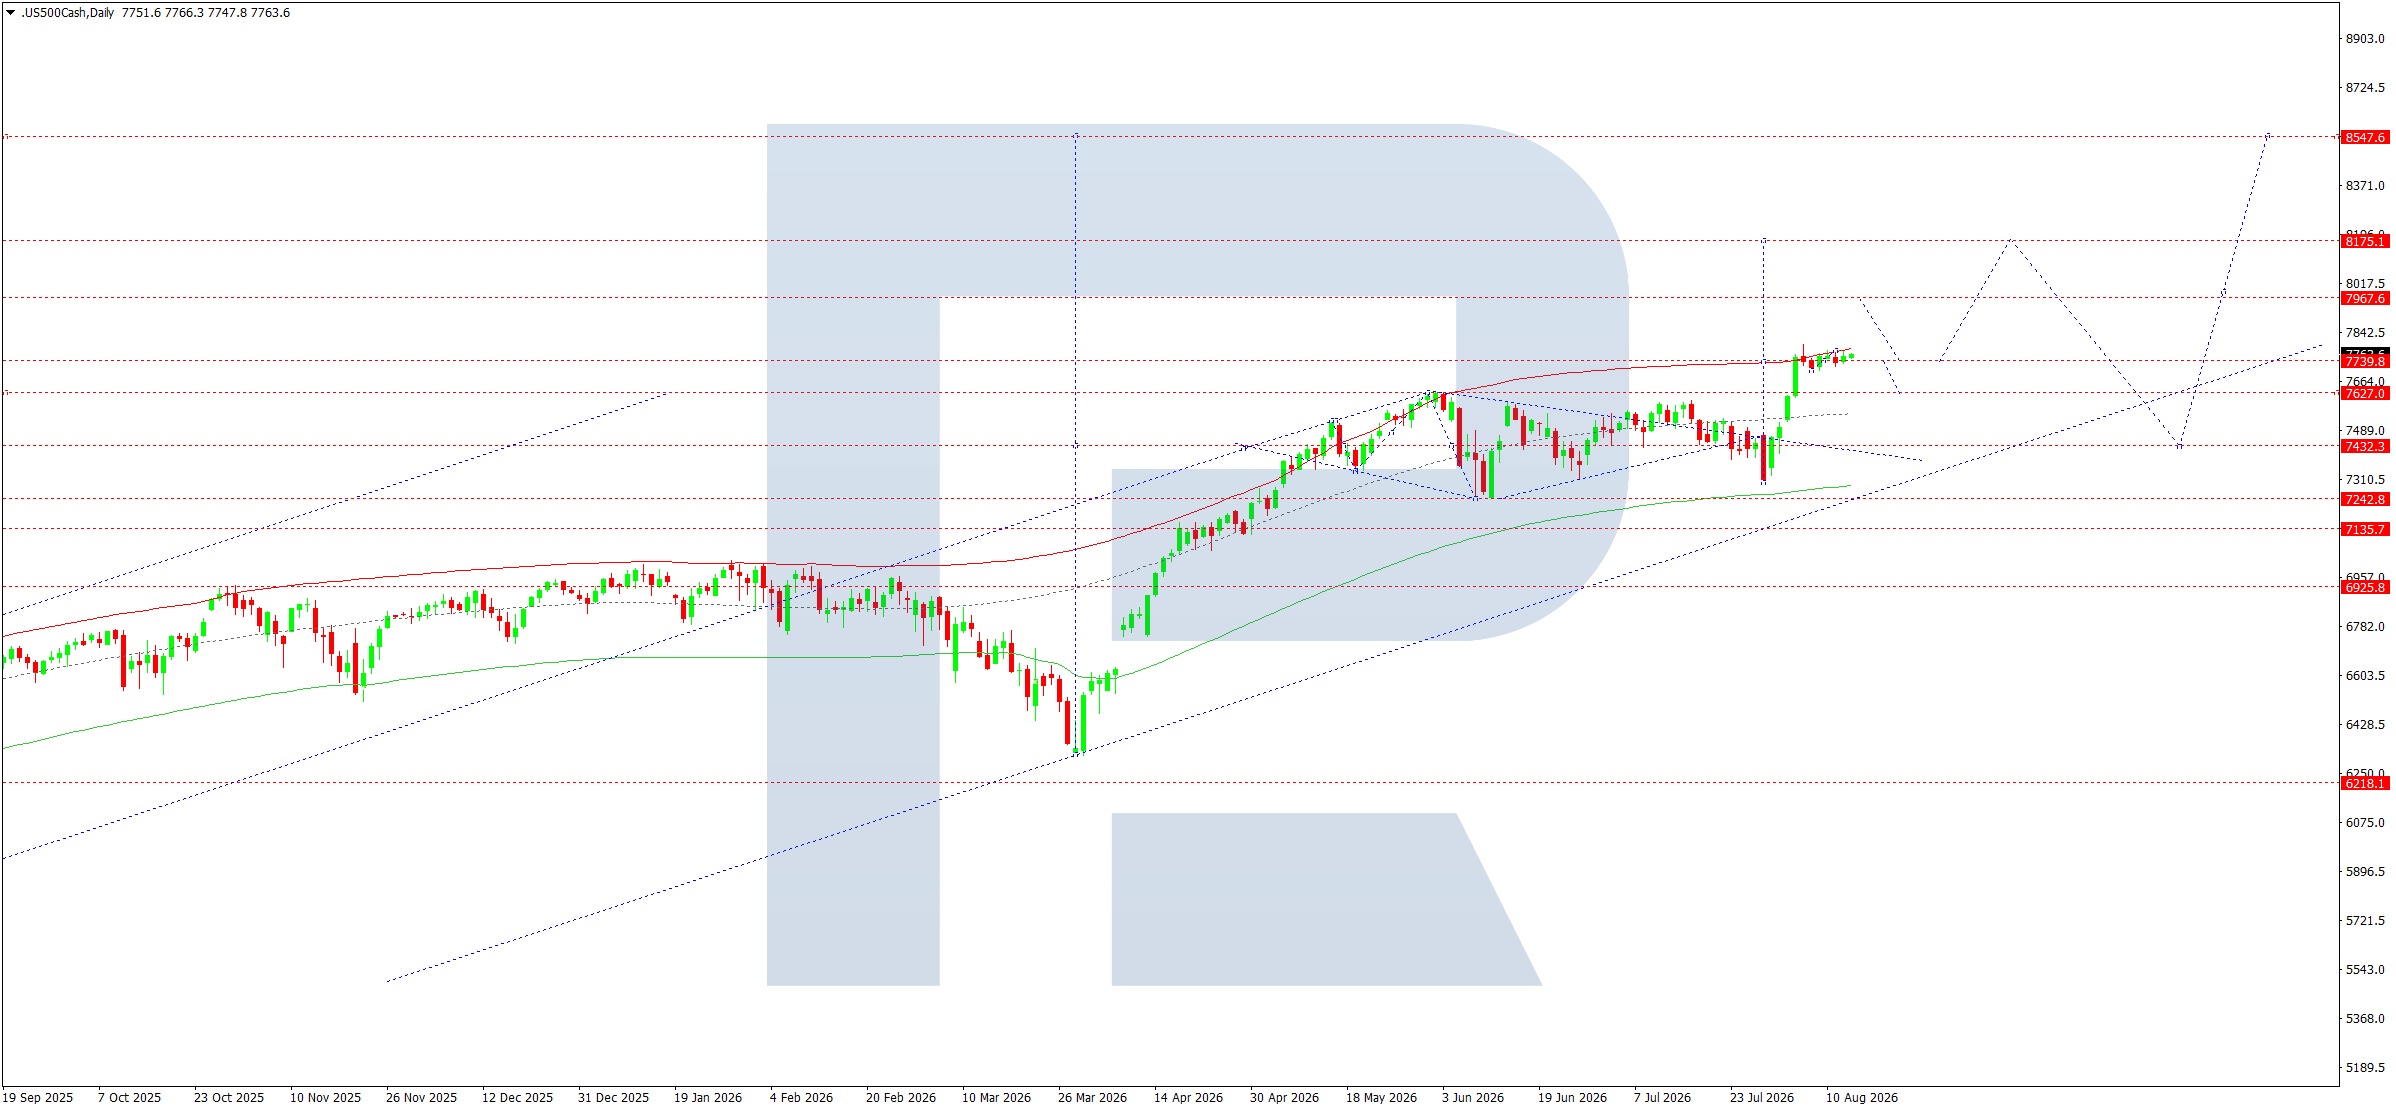
- US 500: Support: 7,739; 7,627. Resistance: 7,967; 8,175
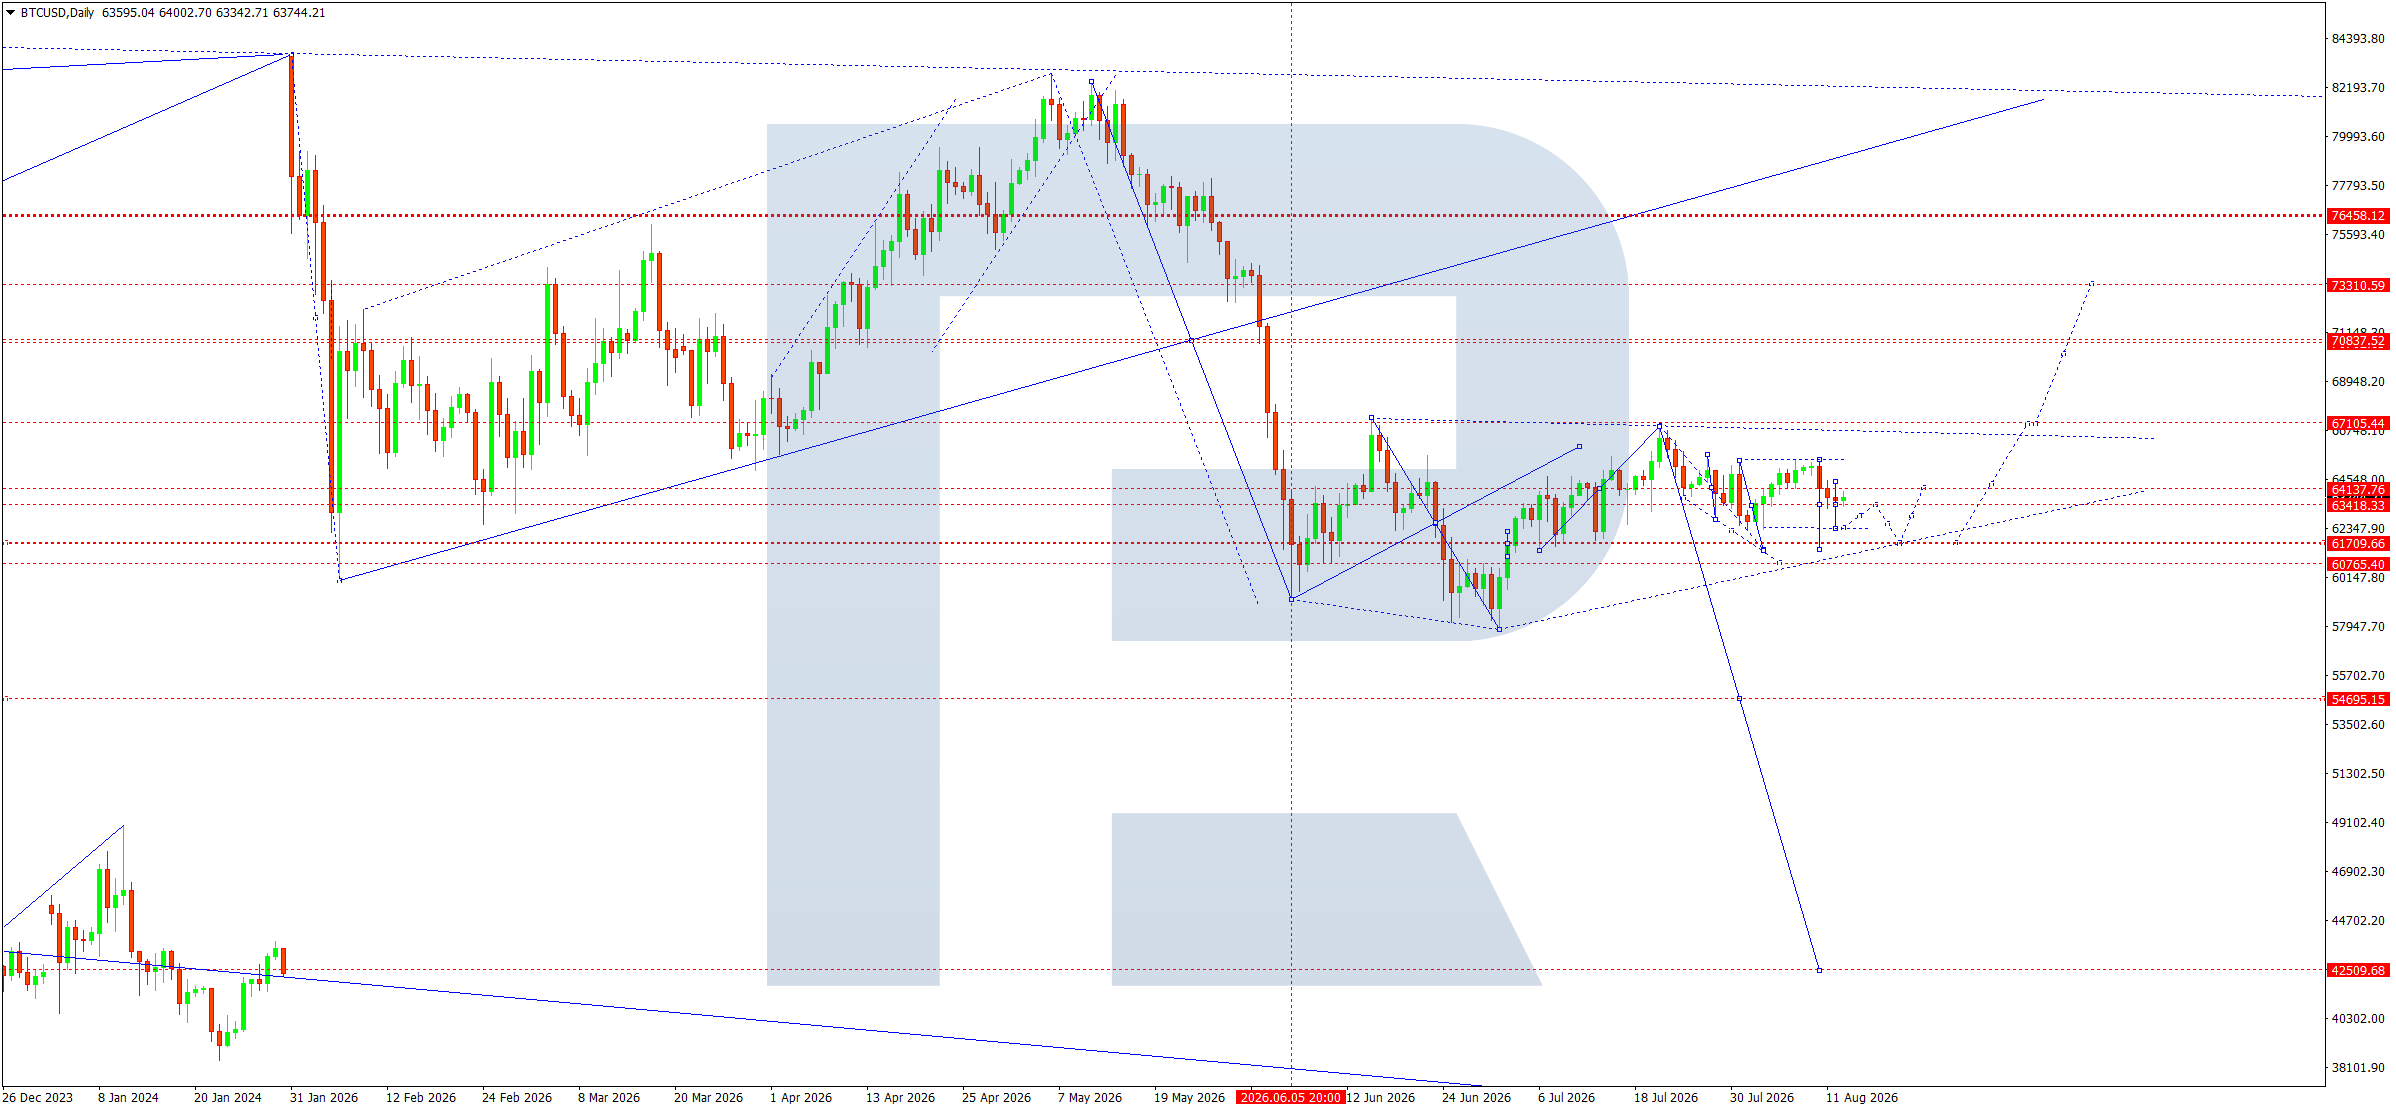
- BTCUSD: Support: 63,418; 61,710. Resistance: 64,318; 67,105
EURUSD forecast
The fundamental backdrop for EURUSD in the coming week remains mixed, although the balance of short-term factors is gradually shifting in favour of the dollar. The Federal Reserve kept its rate in the 3.5000–3.7500% range at its 29 July meeting. The US CPI for July was close to expectations: inflation was 3.4000% y/y, while the core measure was 2.5000%. This reduces the likelihood of a sharp shift in expectations regarding Fed policy but leaves room for more hawkish rhetoric if producer inflation accelerates. The PPI result could alter the market’s assessment of the rate path ahead of the September meeting.
In the eurozone, the situation is the opposite: the European Central Bank kept the deposit rate at 2.2500% in July after raising it in June. A recent Reuters poll shows that most economists expect another 0.2500 percentage point increase in September due to persistent inflationary pressure from energy. The eurozone economy grew by 0.4000% q/q in Q2, beating expectations. Oil remains an important source of risk: higher energy prices may support inflation in Europe while limiting economic activity.
EURUSD technical analysis
On the daily chart, EURUSD retains a corrective downward structure after forming a top at 1.2080. The Elliott wave count indicates the completion of major waves 1–4 and the potential formation of a fifth wave lower. After the wave 4 high around 1.1845, the market moved into decline and is now consolidating around 1.1537–1.1554. This area remains the key pivot point.
The price is below the SMA50, while the average itself is gradually turning lower and forming dynamic resistance. The sequence of local highs also remains descending. As long as the price does not consolidate above 1.1554, sellers retain the advantage. A breakout below 1.1494 would increase the probability of a move towards 1.1429 and 1.1410. The 1.1410 level is particularly important, as a sustained breakout below it would open the way towards the lower part of the current channel and the next strategic target at 1.1260.
The chart also shows a descending channel that limits corrective rises. The upper boundary of the channel runs through the 1.1554–1.1600 area, so any recovery into this zone should still be regarded as corrective. A structural change would require a move above 1.1554 and consolidation above 1.1670. This would allow the market to move into a deeper correction. The price remaining below the local August highs and pressure from the upper boundary of the channel at the start of the period provide further confirmation of the bearish bias.
EURUSD forecast scenarios
Bearish (base case): the market remains below 1.1554 and is consolidating ahead of another decline. A breakout below 1.1494 will open the way towards 1.1429 and then 1.1410. If momentum strengthens, the next target will be 1.1260.
Bullish (alternative): consolidation above 1.1554 will allow for a rise towards 1.1670. A breakout above 1.1670 will change the short-term structure and open the way towards 1.1845.
USDJPY forecast
The fundamental backdrop for USDJPY in the coming week remains mixed. The key factor for the yen following its sharp weakening in July was coordinated currency intervention by Japan and the US, which temporarily strengthened JPY by around 5%. The market is now testing the sustainability of this move again: participants expect intervention to have only a temporary effect without a more hawkish policy from the Bank of Japan. The market currently prices the probability of a BoJ rate hike at the September meeting at around 76%.
At the same time, the US Federal Reserve kept its rate in the 3.50–3.75% range at its 29 July meeting, with three FOMC members voting for a rate hike. However, July inflation was moderate: the CPI rose by 3.4% y/y, while the core measure increased by 2.5%. This reduced expectations of Fed tightening in September and is creating additional pressure on the dollar.
USDJPY technical analysis
On the daily chart, USDJPY has formed a completed five-wave bullish structure with a high around 163.97. After wave 5 was reached, the market formed a sharp downward impulse towards the 155.22 area, marking wave 1 of a larger corrective structure.
An upward wave 2 is currently developing. Its recovery has already reached the 159.50 area, although the chart structure suggests that the correction may continue upwards towards 160.55–161.90. At the same time, 162.15 remains the key resistance area. As long as the market stays below this zone, the current rise should be regarded as corrective rather than the start of a new sustained uptrend.
The 158.58–158.99 area is particularly important. This zone has formed as the nearest support and is also an area around which consolidation may develop. Holding above it would allow the pair to test 160.55 again and then 161.90–162.15.
From a wave perspective, the base case remains bearish. Once wave 2 is complete, wave 3 lower may form. Its local target on the chart is the 148.53 area, after which a corrective wave 4 towards 154.68 is possible. The final wave 5 could potentially take USDJPY towards 146.11.
The fundamental risk to this scenario is linked to possible renewed intervention by the authorities or more hawkish signals from the Bank of Japan. At the same time, the release of the minutes from the latest Fed meeting on 19 August will be an important test for the dollar. During the same week, the market will focus on Japan’s preliminary second-quarter GDP and trade balance.
USDJPY forecast scenarios
Bullish (alternative): consolidation above 160.55 will open the way towards 161.90 and then 162.15. A breakout above 162.15 could return the market towards 163.97.
Bearish (base case): if the rise is capped by the 160.55–162.15 area and USDJPY breaks below 158.58, the decline is expected to continue first towards 155.22 and then 148.53.
GBPUSD forecast
The fundamental backdrop for GBPUSD in the coming week remains mixed. The UK economy showed resilience, with GDP rising by 0.4000% in Q2 and June dynamics also remaining positive. This supports the pound and reduces concerns about a rapid deterioration in domestic demand. At the same time, the Bank of England maintains a cautious stance: the rate remains at 3.7500%, while inflation fell to 2.6000% in June, although the regulator expects it to rise again due to high and volatile energy prices.
The main events next week will be labour market data on 18 August and inflation on 19 August. Wage growth and underlying price pressure will be particularly important for sterling, as they will shape expectations regarding the future rate path. In the US, July inflation was 3.4000% y/y and core inflation was 2.5000%, slightly reducing the likelihood of a hawkish move by the Federal Reserve and supporting demand for GBPUSD. However, US inflation remains above target, so the dollar could recover quickly if the Fed adopts a hawkish tone. Particular attention should be paid to the market’s reaction to the inflation data.
GBPUSD technical analysis
On the daily chart, GBPUSD retains a corrective downward structure after wave 4 formed around 1.3560–1.3600. From an Elliott wave perspective, the current dynamics are viewed as a transition into wave 5 lower. After a local rise from the 1.3260 area, the market formed an impulse towards 1.3560 and then returned to 1.3485. This indicates continued uncertainty, but as long as the price remains below the descending boundary of the main channel, the advantage gradually remains with sellers. The SMA50 is the nearest dynamic support, although a loss of this average would increase pressure on the pair.
The key reference point for the nearest move is 1.3485, which also acts as a local pivot. Consolidation below it would increase the probability of testing 1.3432. A breakout below 1.3432 would signal the development of the next downward leg and open the way towards 1.3329. This area contains important intermediate support from which a technical correction is possible. However, if the bearish structure persists, the subsequent move may continue towards 1.3099, while the strategic target of the fifth wave remains the 1.3000 area.
The bearish scenario is also supported by the price’s position relative to the descending channel line. As long as GBPUSD cannot make a sustained move above 1.3560, any rise should be treated as corrective. At the same time, a return above 1.3485 followed by a breakout above 1.3560 would shift the short-term balance in favour of buyers. The market would then be able to test the upper boundary of the channel around 1.3600–1.3640. A breakout above this area would call the current wave 5 count into question.
GBPUSD forecast scenarios
Bearish scenario (base case): consolidation below 1.3432 will open the way towards 1.3329 and then 1.3099.
Bullish scenario (alternative): a breakout above 1.3560 will allow the rise to continue towards 1.3600–1.3640.
AUDUSD forecast
The fundamental backdrop for AUDUSD in the coming week remains mixed, but with a noticeable advantage for the Australian dollar. The Reserve Bank of Australia kept its rate at 4.3500% on 11 August, while the regulator’s rhetoric remains hawkish: RBA officials indicate that inflation risks are tilted to the upside and that a further rate hike remains possible. Inflation in Q2 was 3.9000%, so the market continues to price in the possibility of further tightening. Softer expectations regarding the Federal Reserve provide additional support for AUD: following the July US CPI data, the likelihood of a Fed rate hike in September declined.
China remains an important factor for AUD. At the start of the coming week, July data on industrial production, retail sales, and investment will be released. Weak figures could limit demand for the Australian dollar through commodity and risk-sensitive channels, while strong data could strengthen demand for AUD. Geopolitical tensions and high energy prices simultaneously support inflation risks and increase volatility. The market will also focus on Australian wage and employment data.
AUDUSD technical analysis
On the daily chart, AUDUSD retains a corrective recovery structure after falling from the 0.7240–0.7260 area. After wave 3 formed around 0.6865, the market moved into an upward phase that is currently viewed as Elliott wave 4. The price rose towards the 0.7040–0.7088 area and is now around 0.7047.
The key reference point is 0.7088, which corresponds to the upper boundary of the current corrective structure and the expected completion area of wave 4. As long as the price remains below this resistance, the main risk is the formation of a reversal pattern and a resumption of the decline. The 0.7026 level acts as the nearest pivot and local support. A decisive loss of this level would increase the probability of a move towards 0.6965 and then 0.6865.
From the matrix structure perspective, once wave 4 is complete, the market may move into a fifth downward wave. Its main local target on the chart is around 0.6785. The move towards 0.6965 and 0.6865 may unfold in stages, with intermediate consolidation phases. Conversely, holding above 0.7026 would leave room for another test of 0.7088.
The alternative scenario is activated if the price consolidates above 0.7088. In that case, corrective wave 4 may become more extended, with the next upside targets at 0.7140 and around 0.7177. However, until a breakout above 0.7088 is confirmed, the upward move should be regarded as corrective.
AUDUSD forecast scenarios
Bearish scenario (base case): the correction towards 0.7088 has been completed. If the price remains below this level, the fifth wave is expected to develop, with targets at 0.6965, 0.6865, and then 0.6785.
Bullish scenario (alternative): a breakout and consolidation above 0.7088 will open the way towards 0.7140, with scope for a further move towards 0.7177.
USDCAD forecast
The fundamental backdrop for USDCAD in the coming week remains mixed. The Bank of Canada keeps its rate at 2.2500%, pointing to a gradual economic recovery and expectations of slowing inflation. The latest labour market data were stronger than expected: employment increased by 75,000 in July, while unemployment fell to 6.4000%. This reduces the likelihood of near-term easing by the BoC and supports the Canadian dollar.
In the US, the Federal Reserve kept its rate range at 3.5000–3.7500%. July inflation slowed to 3.4000% y/y, while the core measure was 2.5000%, reducing pressure for an immediate rate hike. At the same time, three Fed members voted for an increase, so the dollar retains fundamental support. Oil remains another factor: on 13 August, Brent fell to around 87.4400 USD after a sharp rise in US inventories. Weak oil prices may limit demand for CAD, although geopolitical tensions around Iran and the Strait of Hormuz create a risk of renewed price spikes. Key events for the week will be Canadian inflation data on 17 August and retail sales on 21 August.
USDCAD technical analysis
On the daily chart, USDCAD retains a medium-term bullish structure. After wave 1 formed around 1.3973 and wave 2 corrected towards 1.3570, the market moved into impulsive growth. Wave 3 ended around 1.4247, after which the fourth corrective wave began to develop. The current price is around 1.3951, directly within the area between the nearest levels at 1.3973 and 1.3872.
From an Elliott wave perspective, the fourth-wave correction does not yet appear complete. The chart shows an initial downward leg, after which a local rebound towards 1.3973 is expected. A renewed decline towards 1.3872 may then follow. This level is an important support zone and a potential endpoint for wave 4. Holding the 1.3872–1.3880 area would preserve the main bullish structure and create conditions for wave 5 to form.
Once the correction is complete, the main technical target remains 1.4310. On the way there, the market must overcome resistance at 1.4059, then 1.4128, and the wave 3 high around 1.4247. A breakout above 1.4247 would confirm renewed momentum and increase the probability of reaching 1.4310.
At the same time, consolidation below 1.3872 would signal a deeper correction. In that case, the risk of a decline towards 1.3825 and a subsequent revision of the current wave structure should be taken into account. The SMA50 remains above the current price and acts as dynamic resistance, so a sustained return above the average would strengthen the bullish scenario.
USDCAD forecast scenarios
Bullish (base case): after the correction is completed around 1.3872, a recovery towards 1.3973 and 1.4059 is expected, followed by further growth towards 1.4128 and 1.4310.
Bearish (alternative): a breakout below 1.3872 will open the way towards 1.3825 and increase the probability of a deeper correction.
XAUUSD forecast
The fundamental backdrop for gold in the coming week remains moderately positive, although the market enters the period after a strong impulse and with heightened sensitivity to US data. The US consumer price index for July rose by 0.1% m/m, while annual inflation slowed to 3.4%; the core CPI was 2.5% y/y. The data were close to expectations and reduced pressure on the Federal Reserve regarding a possible policy tightening. Another factor was the lack of growth in producer prices in July, while the annual PPI slowed to 4.7%. This limits the potential for dollar appreciation.
At the same time, geopolitical tensions and high energy prices continue to support demand for safe-haven assets. Therefore, the fundamental picture for XAUUSD remains constructive: the combination of calmer inflation, rate expectations, and geopolitical risks creates conditions for gold to continue recovering. However, inflation is still above target, so the market has not received a signal of guaranteed rate cuts. The next Fed meeting will take place on 15–16 September, and until then gold dynamics will be determined by US bond yields and the dollar.
XAUUSD technical analysis
On the daily chart, an upward structure has formed after a significant base developed in the 3,951–4,000 area. The key pivot of the current move is the 4,334 zone. It was above this level that the market managed to form a new local impulse and advance towards 4,449. The price is now around 4,376, meaning that after pulling back from the local high it remains above the main pivot point.
The structure suggests the development of an upward wave after consolidation is completed. The nearest confirmation of buyer strength will be consolidation above 4,449. In this case, room will open towards 4,666, where the next resistance zone is located. A breakout above 4,666 may extend the move towards 4,700–4,725 and then 4,773. After a breakout, the 4,449 area may become support for a corrective pullback.
The broader scenario allows for a move towards 5,150, marked on the chart as the impulse target. However, reaching this area will require the market to pass successively through 4,666, 4,700–4,725, and 4,773. The SMA50 remains an important dynamic reference: keeping the price above the average supports the bullish structure, while a move below it would increase the probability of a correction.
On the downside, the key level remains 4,334. A breakout below it would invalidate the nearest bullish sequence and open the way towards 4,263. Below that, the next support is 4,097, while the strategically important base area is around 3,952. Therefore, as long as XAUUSD remains above 4,334, buyers retain the advantage.
XAUUSD forecast scenarios
Bullish: consolidation above 4,449 will open the way towards 4,666. After a possible correction back to 4,449, prices are expected to rise towards 4,700–4,725 and then 4,773.
Bearish: a breakout below 4,334 will increase the probability of a decline towards 4,263. If sellers gain further momentum, the target will be 4,097.
US 500 forecast
The fundamental backdrop for the US stock market in the coming week remains moderately positive. The main support comes from a combination of resilient corporate earnings, sustained interest in the artificial intelligence sector, and the absence of a new inflation shock. The US 500 index ended 12 August near 7,748 points, remaining close to all-time highs, while lower volatility indicates continued demand for risk. Strong results from companies linked to AI infrastructure provided additional support to the technology sector.
At the same time, the US consumer price index for July, released on 12 August, showed inflation rising by 3.4% y/y, while the core measure increased by 2.5%. The data were broadly in line with expectations and did not create a need for sharp monetary tightening. This is positive for the stock market because it leaves room for the Federal Reserve to ease policy, although inflation still remains well above the 2% target.
US 500 technical analysis
On the daily chart, US 500 retains a pronounced bullish structure. After forming a significant low around 6,218, the market consistently developed a series of higher highs and higher lows. The move is unfolding within an ascending channel, while the current price of 7,763 is directly above the key 7,739 area.
A breakout above 7,739 is an important technical signal for the continuation of the upward wave. If the price consolidates above this level, the nearest target will be 7,967. This level corresponds to local resistance and the upper part of the current range. A decisive breakout above it would open the way towards the next resistance at 8,175.
At the same time, the market is near all-time highs, so the probability of short-term consolidation remains high. The chart shows a potential corrective trajectory after 7,967 is reached. If a reversal wave forms and the price falls below 7,739, attention will shift to support at 7,627. A breakout below this level would strengthen the corrective scenario, with downside potential towards 7,432.
A deeper correction towards 7,242 would be considered only if selling intensifies significantly and the price exits the current ascending channel. There is no such signal yet, so the structure remains bullish. The SMA and the direction of the channel also continue to favour buyers.
US 500 forecast scenarios
Bullish (base case): holding above 7,739 preserves the potential for growth towards 7,967. If this level is broken, the market may continue towards 8,175.
Bearish (alternative): a return below 7,739 will form a corrective signal with an initial target at 7,627. A breakout below this level will open the way towards 7,432.
BTCUSD forecast
The fundamental backdrop for the coming week remains mixed. The latest US CPI for July showed consumer prices rising by 0.1% m/m and 3.4% y/y, while core inflation slowed to 2.5% y/y. This reduces inflationary pressure and supports expectations of a softer policy stance, although inflation remains noticeably above the 2% target. The US Federal Reserve kept its rate at 3.50–3.75% on 29 July, highlighting persistent inflation and uncertainty related to energy and geopolitics. The next important event will be the minutes of the Fed’s July meeting on 19 August, with the market looking for signals regarding the likelihood of policy easing at the September meeting. This is particularly important for BTC, as the cryptocurrency remains sensitive to US bond yields, the dollar, and investors’ overall risk appetite. At current levels, institutional demand looks mixed: after a series of inflows into spot ETFs, signs of position-taking profits have emerged. As a result, the fundamental backdrop currently provides no sustained momentum for either buyers or sellers.
BTCUSD technical analysis
On the daily chart, BTCUSD remains within a broad corrective structure after falling from the 82,000–84,400 area. The current price around 63,607 is within a narrowing range formed between support at 63,418 and 61,710 and resistance at 64,318–67,105. The local wave structure shows alternating upward and downward legs, so the market remains more in an accumulation phase ahead of a breakout from the range.
The key area for buyers remains 63,418–64,318. A return above 64,318 would signal a recovery in short-term bullish momentum and allow the market to retest 67,105. Consolidation above 67,105 would open the way towards the next resistance at 70,837 and then 73,310. In the broader scenario, only a breakout above 73,310 could confirm the end of the current correction and trigger a move towards 75,658.
On the other hand, a loss of 63,418 would increase pressure on the lower boundary of the local channel. A breakout below 61,710 would be a technical signal for the downward wave to continue towards 60,765. If this level also fails to hold, the structure would deteriorate significantly, with the next targets at 54,695 and then 42,510. The chart also retains a long-term downside projection, so the risk of a deeper correction cannot be ruled out. As long as the price remains above 61,710, this scenario stays alternative.
BTCUSD forecast scenarios
Bearish (base case): if the market fails to consolidate above 64,318, it may continue its sideways decline towards 63,418 and, if this level is broken, towards 61,710.
Bullish (alternative): consolidation above 64,318 and a breakout above 67,105 will create scope for the wave to continue towards 70,837 and 73,310.
Editors’ picks
 EURUSD forecast 2026–2027: technical analysis, price levels & predictions
EURUSD has pulled back from the 2026 high of 1.1915 and is now trading near 1.1450 — below both EMA65 and EMA200 — with the active scenario shifting from bullish to bearish. The ECB raised rates to 2.40%, but the Fed holds at 3.75%, and US inflation (3.5%) continues to outpace the eurozone (2.8%). A confirmed break below 1.1280 opens the next downward wave toward 1.1080. We break down the key levels, three trading scenarios with entry triggers, and what Deutsche Bank, Morgan Stanley and UBS are forecasting for EURUSD in 2026.
 Gold (XAUUSD) forecast 2026: predictions based on fundamental and technical analysis
Gold has corrected over 25% from its all-time high of 5,597 USD and is now trading near 4,100 USD — testing a critical support zone. Is this the bottom, or will the downtrend continue? We break down the key levels (support 3,920 USD, breakout trigger 4,500 USD), three trading scenarios with entry levels, and what J.P. Morgan, Goldman Sachs and Deutsche Bank are forecasting for gold in 2026.
Forecasts presented in this section only reflect the author’s private opinion and should not be considered as guidance for trading. RoboForex bears no responsibility for trading results based on trading recommendations described in these analytical reviews.