
Weekly technical analysis and forecast (31 August–4 September 2026)
In this weekly technical analysis, we examine the key chart patterns and price levels for EURUSD, USDJPY, GBPUSD, AUDUSD, USDCAD, Gold (XAUUSD), US 500, and Bitcoin (BTCUSD) to forecast market developments for the week ahead (31 August–4 September 2026).
Major technical levels to watch this week
- EURUSD: Support: 1.1622, 1.1533. Resistance: 1.1703, 1.1730
- USDJPY: Support: 158.20, 155.22. Resistance: 160.48, 161.20
- GBPUSD: Support: 1.3562, 1.3456. Resistance: 1.3675, 1.3755
- AUDUSD: Support: 0.7090, 0.7062. Resistance: 0.7143, 0.7204
- USDCAD: Support: 1.3824, 1.3732. Resistance: 1.3918, 1.3934
- Gold: Support: 4,329, 3,945. Resistance: 4,697, 4,717
- US 500: Support: 7,643, 7,608. Resistance: 7,816, 7,919
- BTCUSD: Support: 77,625; 76,053. Resistance: 81,044; 82,193
EURUSD forecast
The fundamental backdrop for EURUSD in the week ahead remains mixed. The euro is receiving support from stronger economic data and continued expectations of further monetary policy tightening by the European Central Bank. At the July meeting, ECB officials indicated that another rate hike may be necessary, potentially as early as September, if inflation risks do not ease. Eurozone inflation remains above target, while business activity accelerated in August, with the composite PMI rising to 52.1.
At the same time, the US dollar is supported by persistent inflation in the US. The July PCE index rose by 3.7% year-on-year, while the core reading stood at 3.3%, well above the Federal Reserve’s target. Another important factor will be a speech by Federal Reserve Chair Kevin Warsh at the Jackson Hole symposium on 28 August. The market will assess his stance on inflation and the future path of interest rates.
EURUSD technical analysis
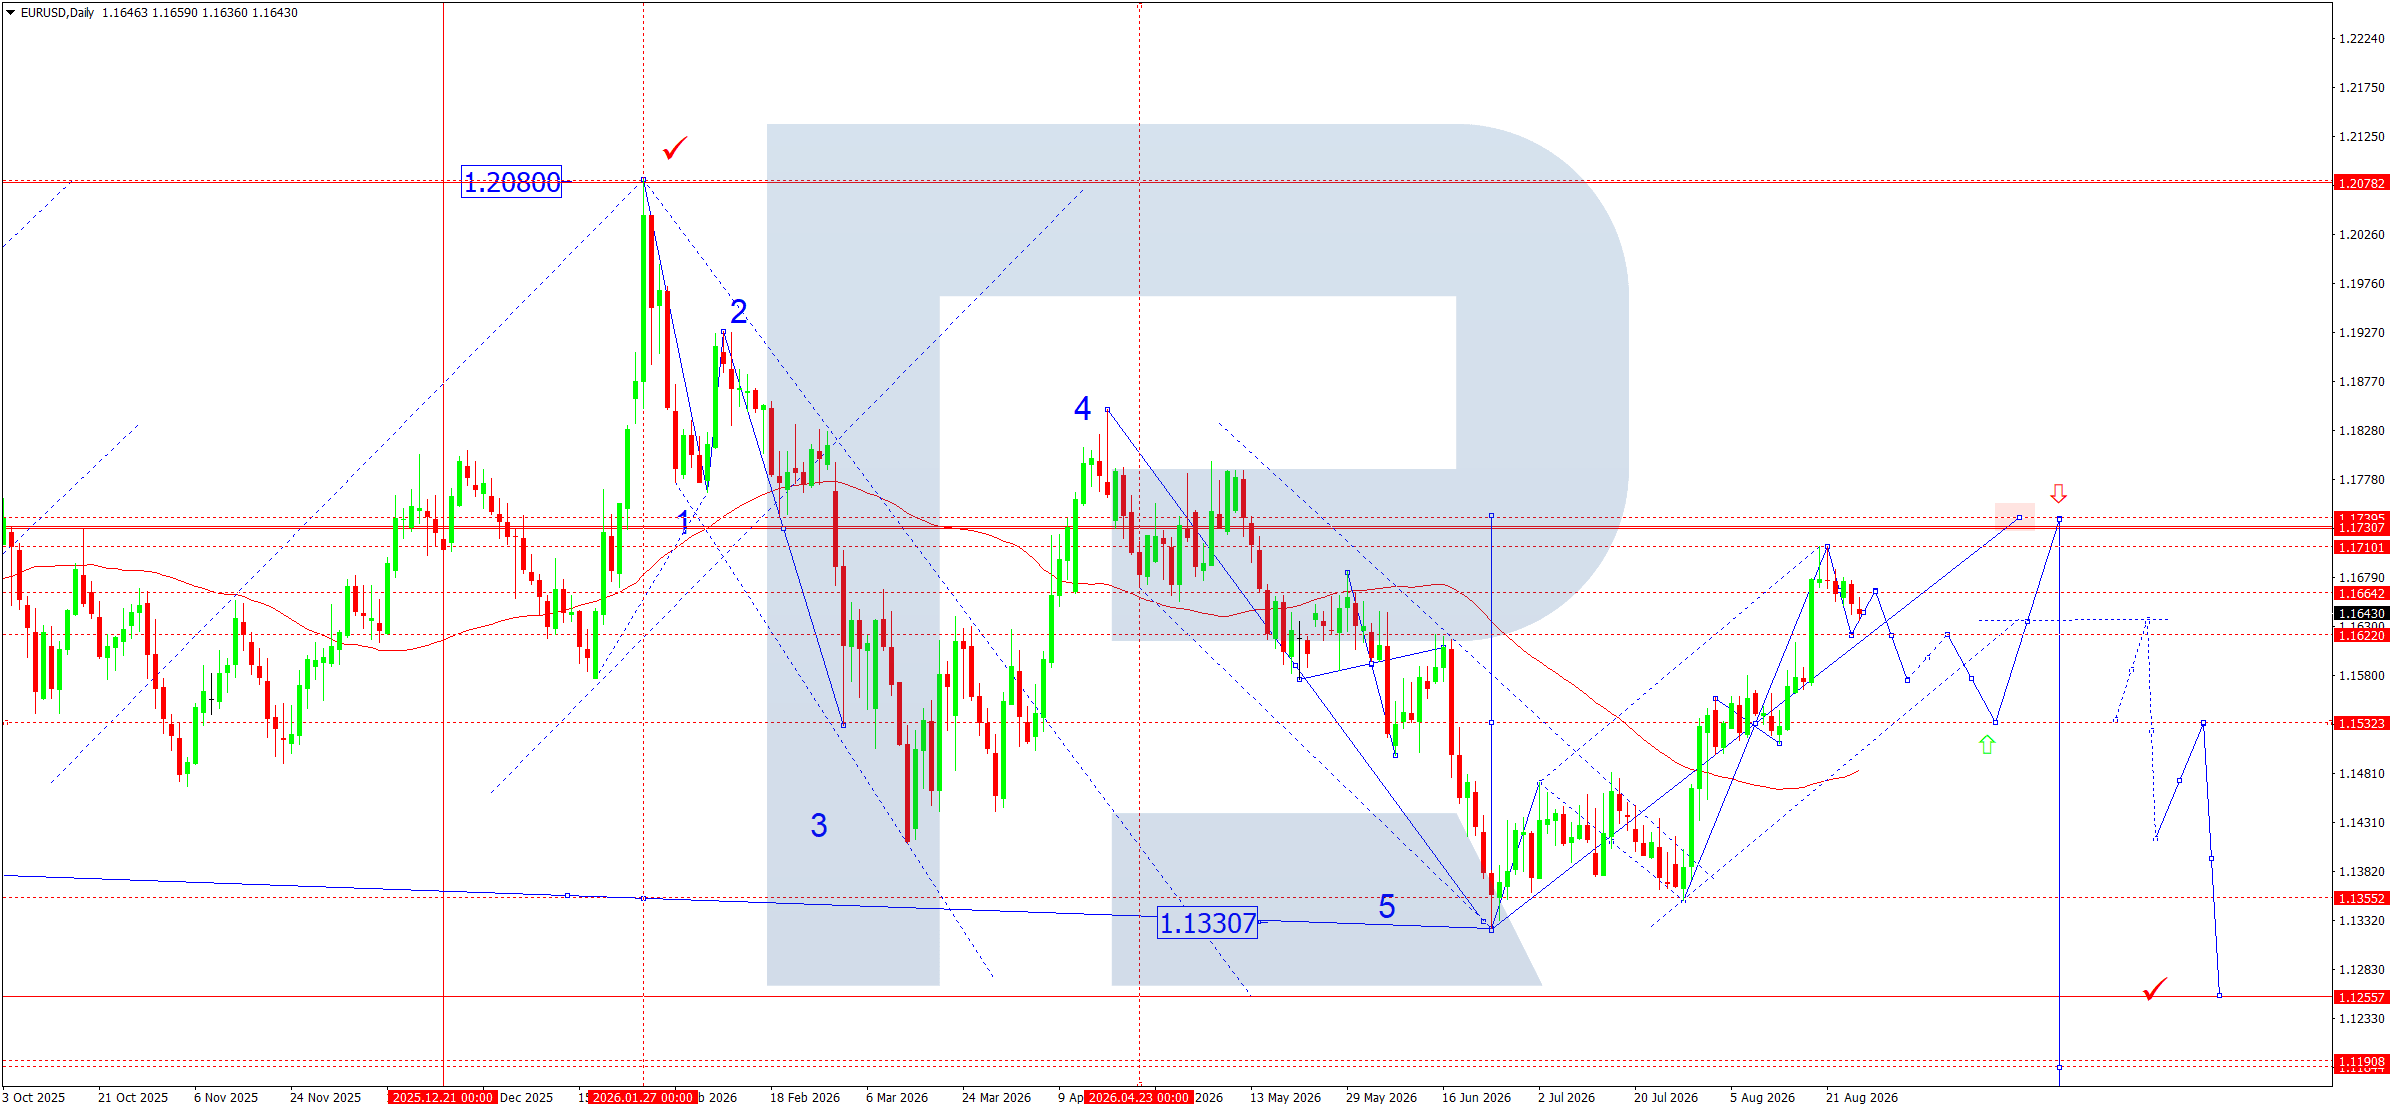
On the daily EURUSD chart, the previous five-wave downward structure was completed with the fifth wave forming in the 1.1331–1.1355 area. From this zone, the market moved into a recovery that reached the 1.1710 area in August. Therefore, after completing the broader downward structure, the price formed an upward move in which the first significant resistance zone emerged around 1.1710.
At the current stage, the price is forming a reversal structure directly below the 1.1703–1.1730 resistance zone. After the upward move ended around 1.1710, the market began to develop a downward wave. An initial downward impulse into the 1.1666–1.1636 area has formed, after which the price moved into local consolidation. The formation of this impulse indicates increased seller activity and creates the conditions for the corrective move to continue.
From a wave-structure perspective, the base case remains the development of the second part of the downward impulse once the current consolidation is complete. The nearest control level is 1.1622. Consolidation below this level would confirm the development of the downward correction and open the way towards the next important target at 1.1533. This level is also a significant technical support area and could become the zone where a new upward move begins.
Therefore, for the week ahead, we expect the downward wave to continue with an initial target at 1.1622 and the main corrective target at 1.1533. Once the corrective move in this area is complete, a new upward wave could form, followed by a return towards 1.1730.
The alternative scenario will become relevant if EURUSD holds above 1.1622 and subsequently returns to the 1.1703–1.1730 area. A decisive breakout above this resistance zone would weaken the deeper-correction scenario and create the conditions for the upward move to continue.
EURUSD forecast scenarios
Trading scenario: SELL
- Price at the time of writing: 1.1643
- Entry price: 1.1643
- Stop loss: 1.1703
- Take profit: 1.1533
- Risk-to-reward ratio: 1:1.83
USDJPY forecast
The fundamental backdrop for USDJPY in the week ahead remains mixed. On the one hand, the US dollar is supported by persistent inflation in the US: the July PCE index rose by 3.7% year-on-year, while the core reading stood at 3.3%, limiting the scope for rapid Federal Reserve policy easing. The key event will be a speech by Federal Reserve Chair Kevin Warsh at the Jackson Hole symposium, with markets looking for signals regarding future policy and the outlook for the September meeting.
On the other hand, pressure on the yen is gradually being countered by the Bank of Japan. Recent comments from BoJ officials indicate a readiness to continue tightening policy, while expectations of a rate hike in September have risen noticeably. Another factor is the risk of renewed currency intervention by the Japanese authorities following the recent joint US-Japan action. Therefore, the fundamental picture no longer gives the US dollar the same clear advantage as before.
USDJPY technical analysis
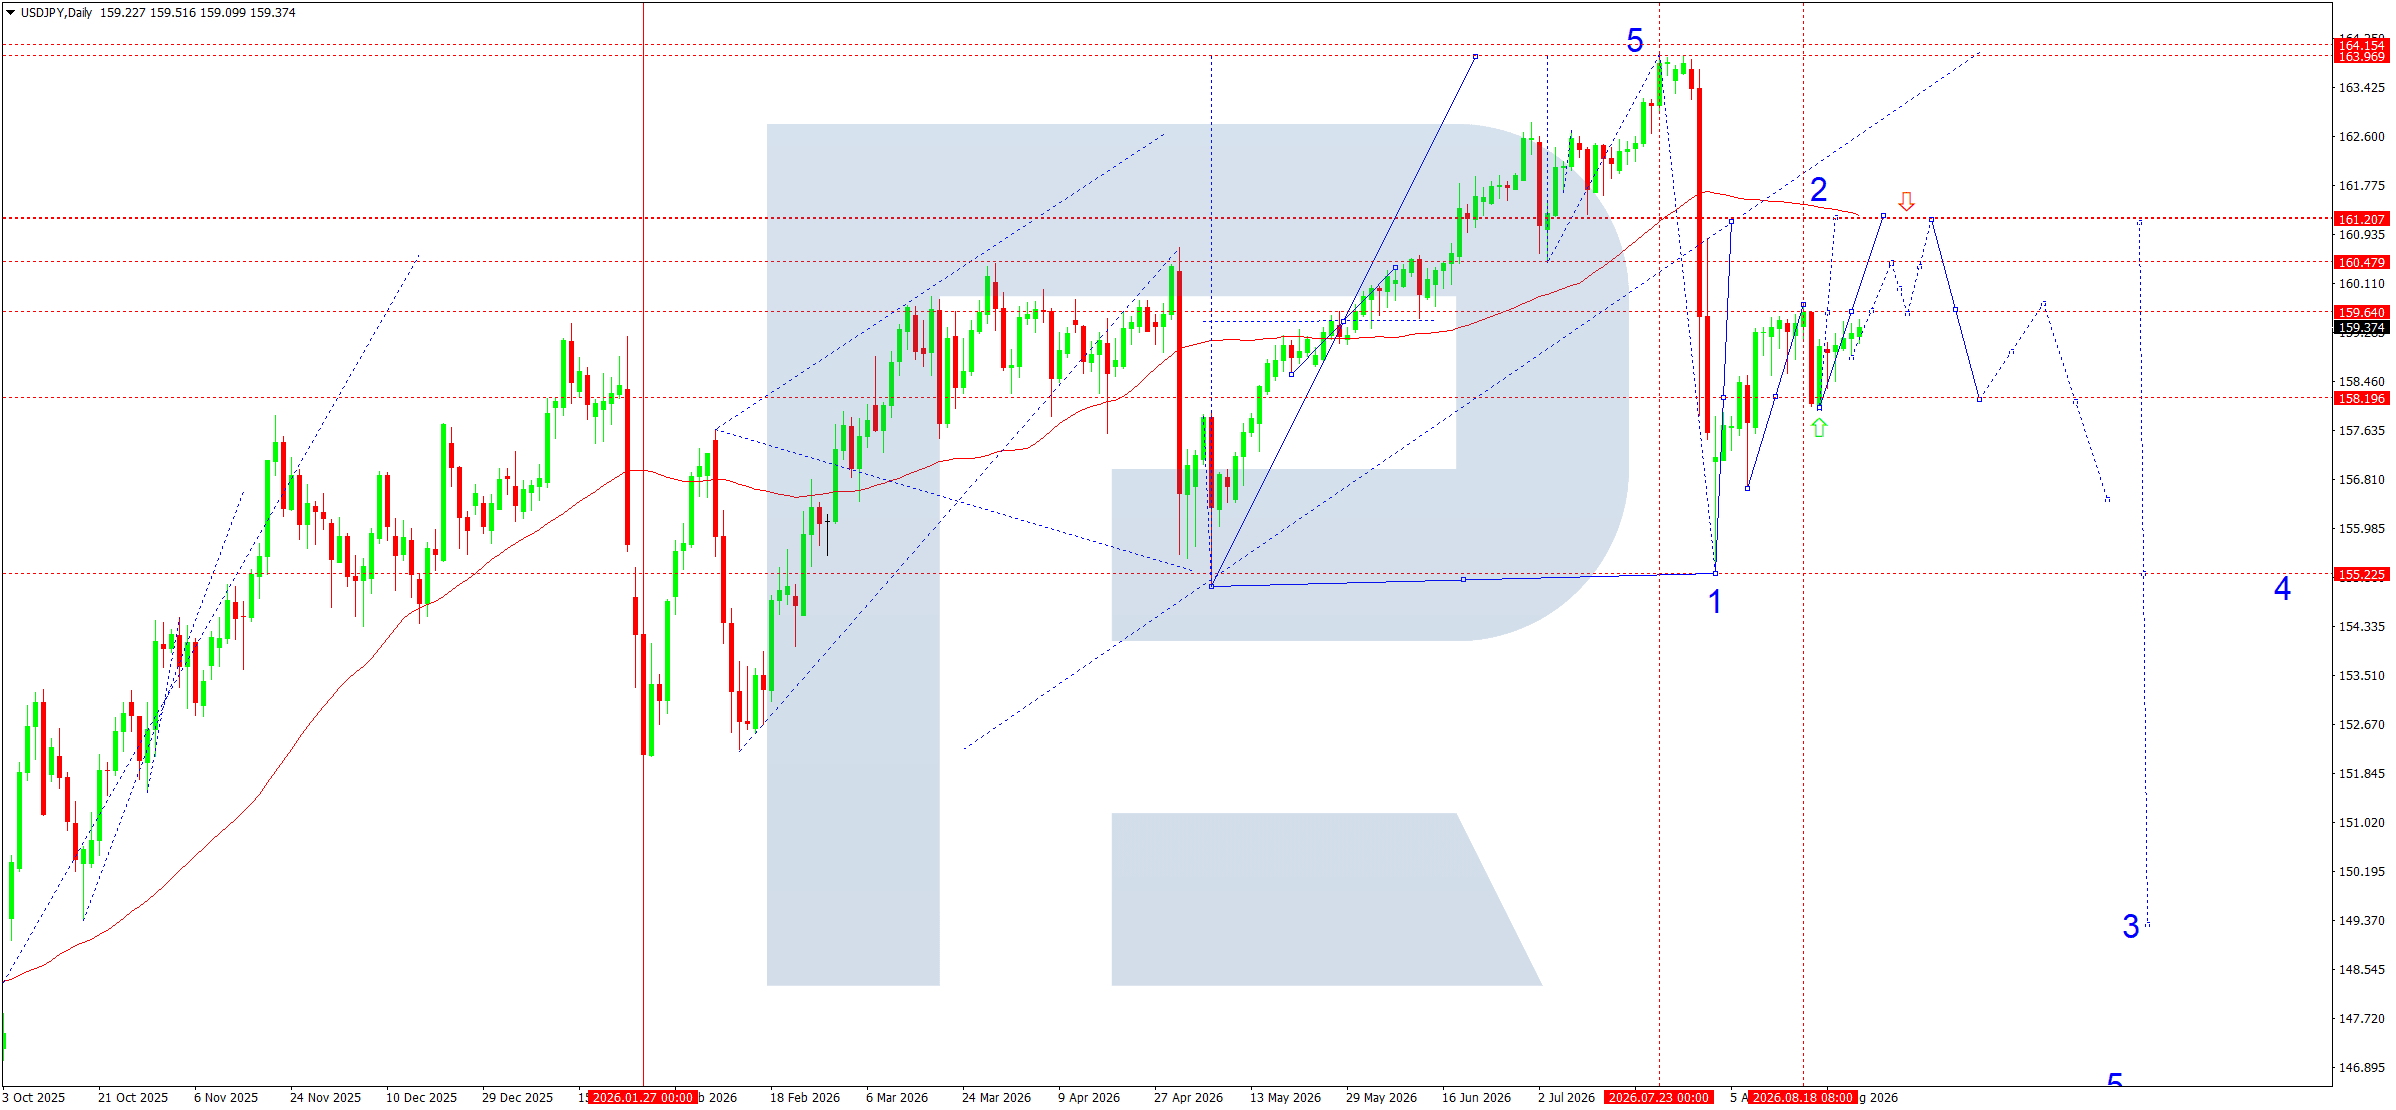
On the daily USDJPY chart, after forming an upward five-wave structure, the market reached the 163.97–164.15 area, after which a sharp corrective decline began. The drop towards 155.22 formed the first corrective wave, after which the pair moved into recovery. The current price is around 159.37, while the nearest upside target is 159.64.
In the week ahead, USDJPY may continue to recover towards 159.64. Consolidation above this resistance would open the potential for a move towards 160.48 and then 161.20. The 161.20 area is viewed as the key resistance zone and a possible point where the current corrective rise may end. If a reversal forms from this area, a renewed decline towards 158.20 is expected initially. A breakout below 158.20 would strengthen the downward structure and open the way towards 155.22. If pressure on the US dollar persists, a deeper correction could eventually take the pair towards the 149.37 area.
Therefore, the near-term dynamics remain bullish up to the 160.48–161.20 resistance area, although the medium-term structure after reaching 164.15 points to a deeper downward correction. A rise above 161.20 would require a revision of the current wave count and create a risk of another test of 163.97–164.15.
USDJPY forecast scenarios
Trading scenario: SELL
- Price at the time of writing: 159.37
- Entry price: 161.20
- Stop loss: 162.20
- Take profit: 158.20
- Risk-to-reward ratio: 1:3
GBPUSD forecast
The fundamental backdrop for GBPUSD at the start of the new week remains mixed. The British pound had previously received support from the resilience of the UK economy and high government bond yields, but pressure on sterling has increased in recent days. The market has reduced expectations of a Bank of England rate hike: a full 0.2500% hike in 2026 is now barely priced in, while expectations for the next tightening move have shifted to early 2027. At the same time, UK inflation remains above target, while households’ inflation expectations rose again in August.
The UK economic situation does not appear critical. GDP growth in the second quarter was 0.4000%, while the August services PMI rose to 52.8000, indicating continued resilience in domestic demand. However, labour-market weakness, declining retail sales, and persistent public-finance problems limit the pound’s potential for further strengthening.
For GBPUSD, the main external factor will remain Federal Reserve policy. At the beginning of September, the market will receive a series of important US indicators, including ISM, ADP, jobless claims, and the Non-Farm Payrolls employment report on 4 September. Strong data could support the US dollar and reinforce the expected downward wave in GBPUSD, while weak figures would create conditions for a recovery in the pound.
GBPUSD technical analysis
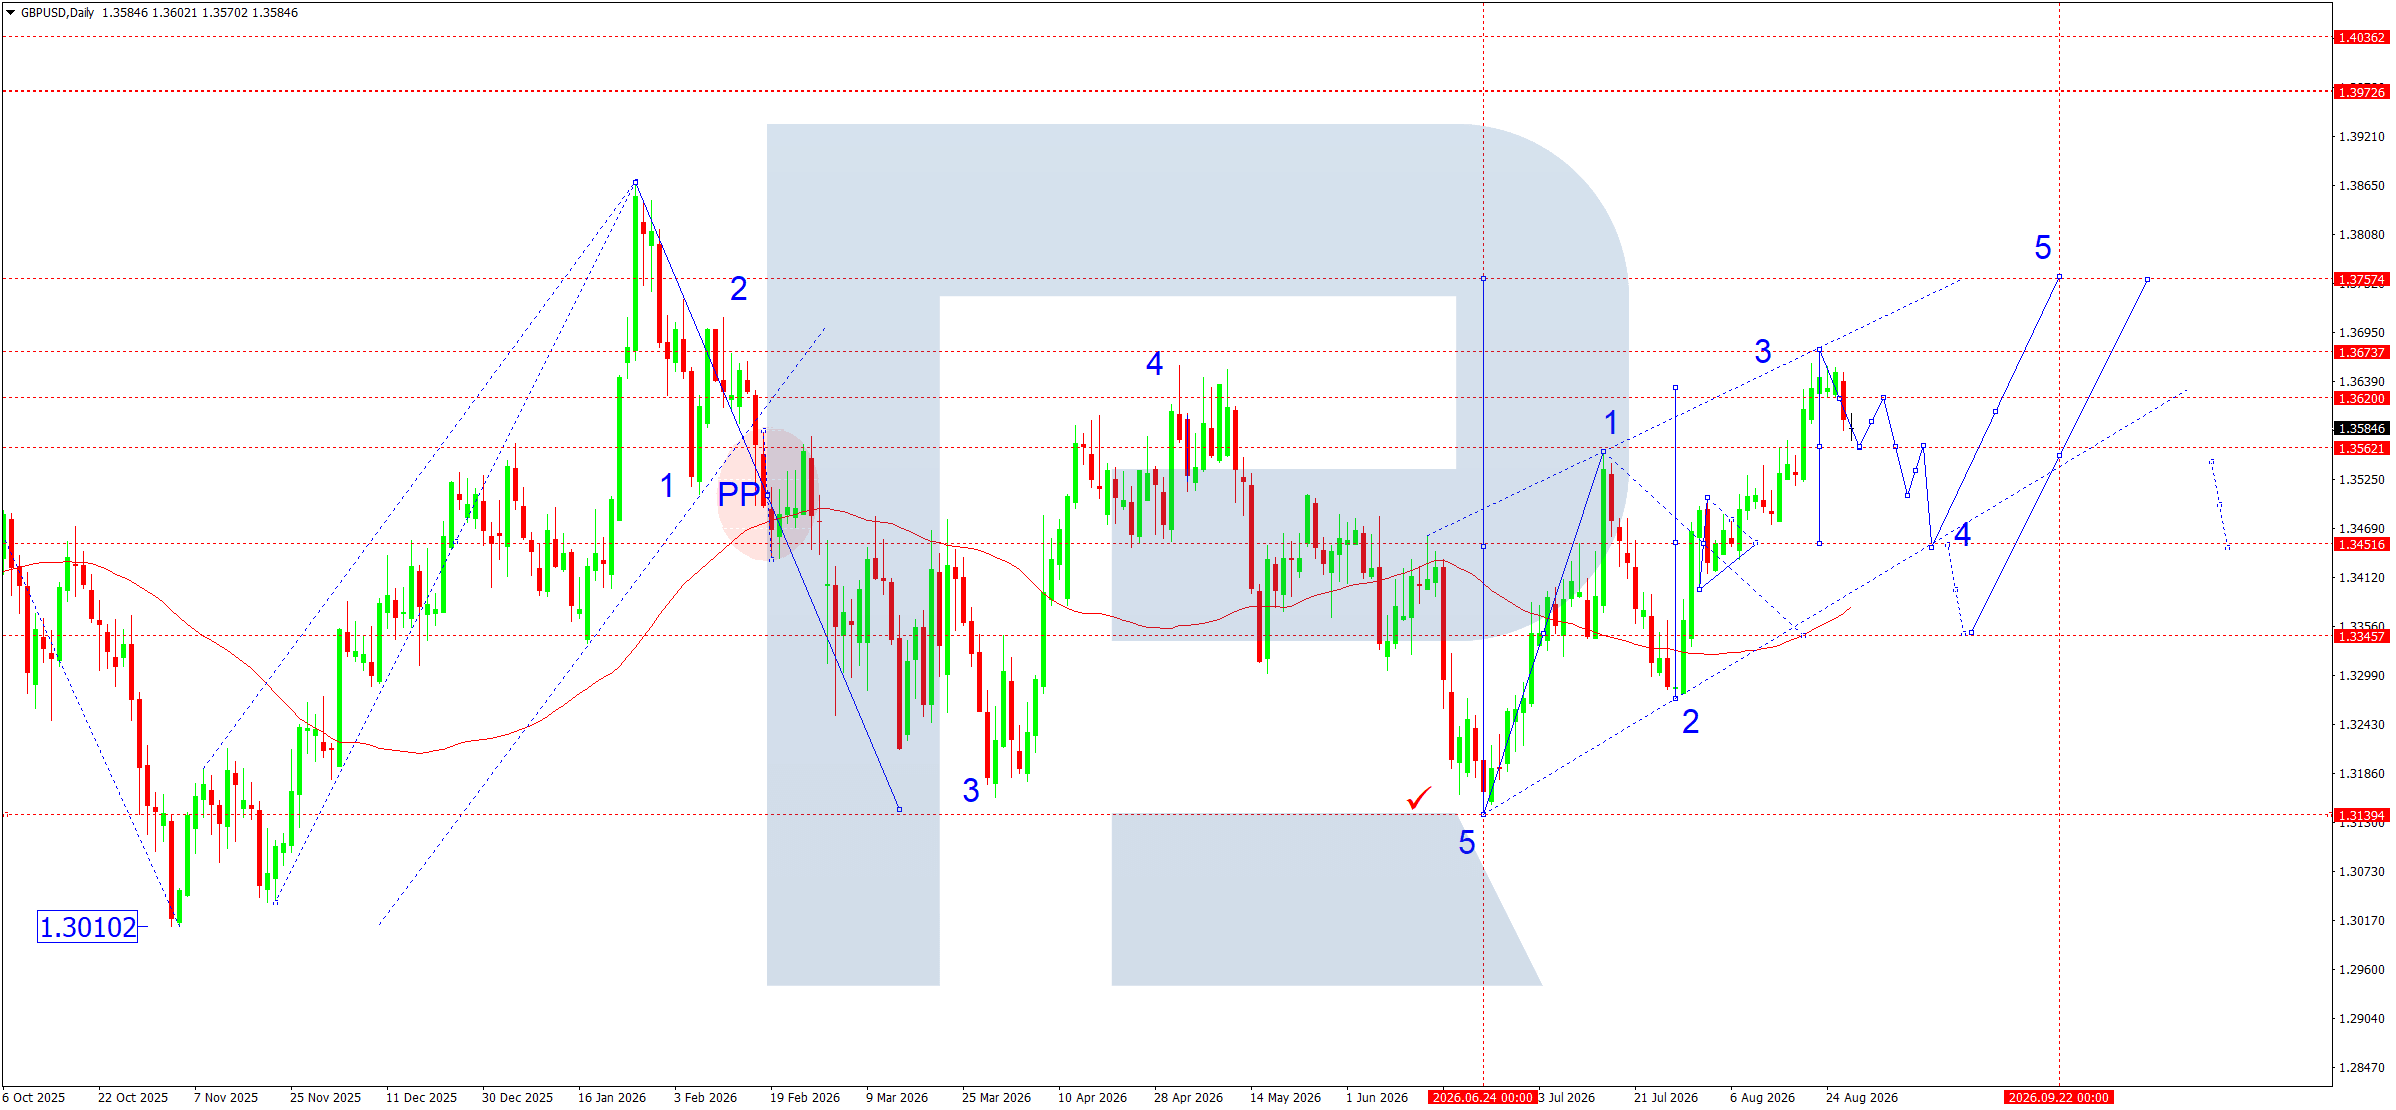
On the daily GBPUSD chart, the upward structure remains intact after the main five-wave downward sequence ended around 1.3140. From this area, the market began to develop a new impulsive upward wave. At the current stage, waves 1 and 2 have formed, after which the market completed the third wave with a rise towards 1.3675. This level is the local target that was reached in August.
After reaching 1.3675, the market began to form a corrective move. From a technical perspective, the most likely scenario for the week ahead is the development of a fourth downward wave towards 1.3456. This area corresponds to the nearest important support and the lower part of the upward structure. Holding above 1.3456 would allow the decline to be viewed as a correction within a broader upward sequence.
Once the corrective wave is complete, growth is expected to resume with the formation of a fifth wave targeting 1.3755.
GBPUSD forecast scenarios
Trading scenario: SELL
- Price at the time of writing: 1.3585
- Entry price: 1.3585
- Stop loss: 1.3675
- Take profit: 1.3456
- Risk-to-reward ratio: 1:1.43
AUDUSD forecast
The fundamental backdrop for AUDUSD in the week ahead remains moderately positive for the Australian dollar, although the probability of a corrective move has increased after the strong rise. The main factor supporting the AUD is the shift in expectations regarding the Reserve Bank of Australia’s monetary policy. July inflation data released on 26 August showed annual consumer price growth slowing to 3.5%, while core inflation remained elevated at 3.6%. This indicates that domestic inflationary pressure persists.
Consumer spending trends provided additional support to the Australian currency. Against this backdrop, market expectations for future RBA policy have become more hawkish, limiting the Australian dollar’s downside potential. At the same time, the main external factor for AUDUSD remains the direction of the US dollar. Next week, market attention will focus on US labour-market and business-activity data, culminating in the employment report on 4 September. Weaker data could increase pressure on the US dollar and provide additional support to AUDUSD.
AUDUSD technical analysis
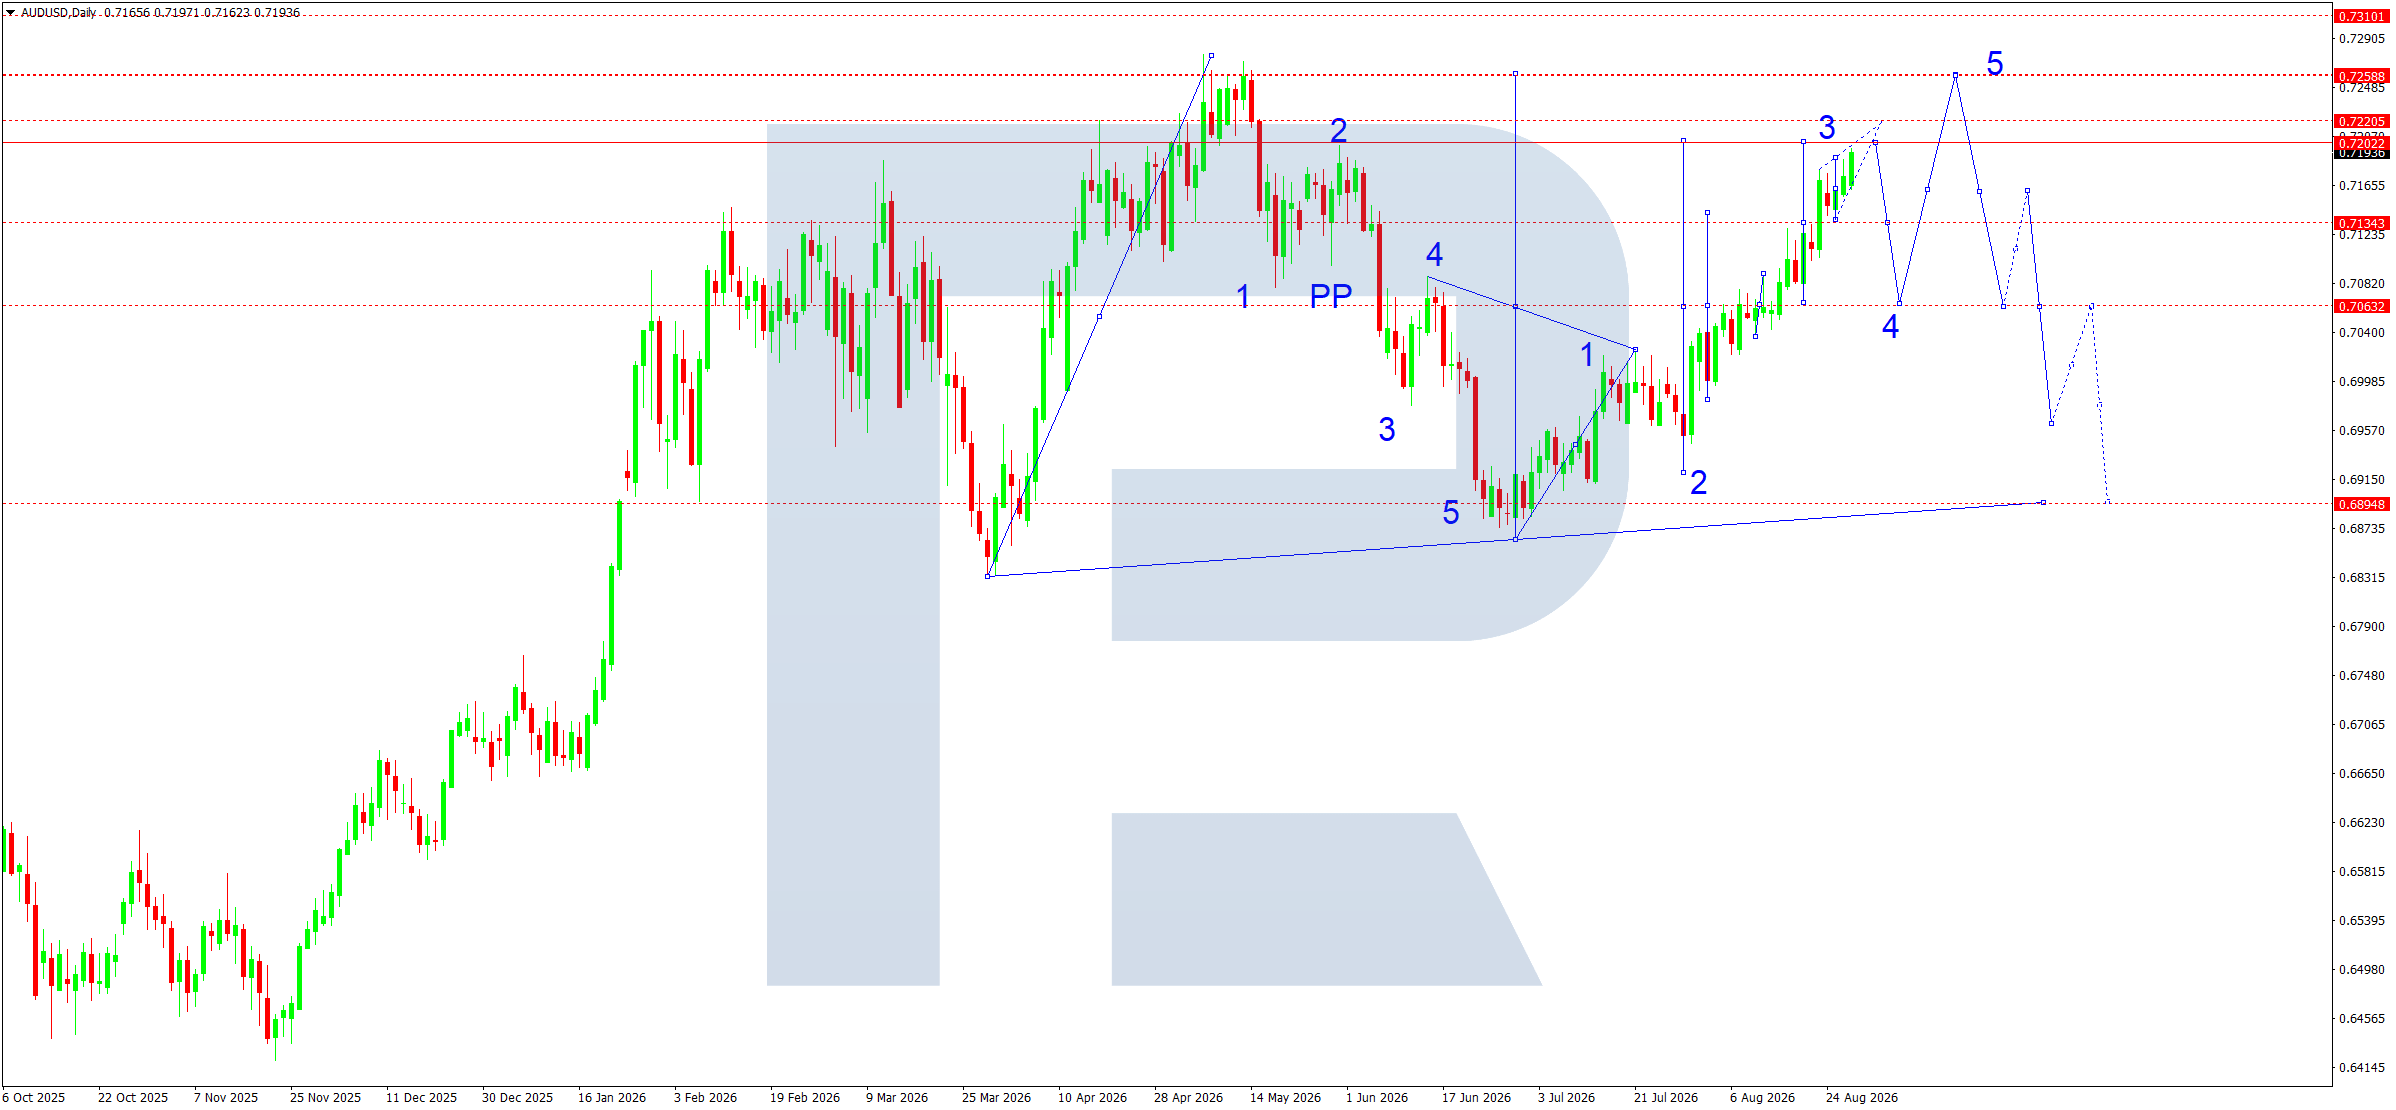
On the daily AUDUSD chart, the upward structure remains intact after the completion of a large corrective wave around 0.6895. From this area, the market formed a sequence of upward waves and has now approached the local resistance zone at 0.7200–0.7221.
From a technical perspective, the market is seeking to reach the local target of the upward wave at 0.7200. On reaching this area, the probability of profit-taking and a local correction increases. For the week ahead, we expect the beginning of a downward wave from around 0.7200, with an initial target at 0.7135.
The 0.7135 level is important for the current structure. A breakout below it would signal a strengthening correction and allow for a continued decline towards 0.7064. The 0.7064 area is the main target of the corrective wave and also an important support zone. A new base for the resumption of the upward movement is expected to form here.
If 0.7064 prevents a further decline, the next phase would be an AUDUSD recovery with the prospect of a return to 0.7200. Once the correction is complete, the main bullish scenario assumes further growth towards 0.7258. A breakout above 0.7258 would open the way for the fifth wave to develop further towards 0.7310.
Therefore, the current structure remains predominantly bullish, but a corrective decline is expected in the short term. The main working scenario for the week is a move to 0.7200, a decline towards 0.7135 and, if this level is broken, a move towards 0.7064. Once the correction is complete, we expect growth to resume towards 0.7258.
AUDUSD forecast scenarios
Trading scenario: SELL
- Price at the time of writing: 0.7194
- Entry price: 0.7200
- Stop loss: 0.7258
- Take profit: 0.7064
- Risk-to-reward ratio: 1:2.3
USDCAD forecast
The fundamental backdrop for USDCAD in the week ahead remains mixed. The main event will be the Bank of Canada meeting on 2 September. The rate currently stands at 2.2500%, and the regulator has previously highlighted the need to balance economic weakness, inflation risks, and the consequences of US trade policy.
Additional pressure on the Canadian dollar comes from the escalation of the trade conflict with the US. Following the breakdown of negotiations, Washington imposed 50% tariffs on a number of Canadian goods, while Canada announced retaliatory measures worth around 20 billion USD, due to take effect on 8 September. At the same time, there have been some signs that further dialogue may still be possible.
The US dollar continues to receive support from persistent inflation. The July PCE reading came in at 3.7000% year-on-year, while the core figure stood at 3.3000%. Against this backdrop, expectations of a possible Federal Reserve rate hike have strengthened.
USDCAD technical analysis
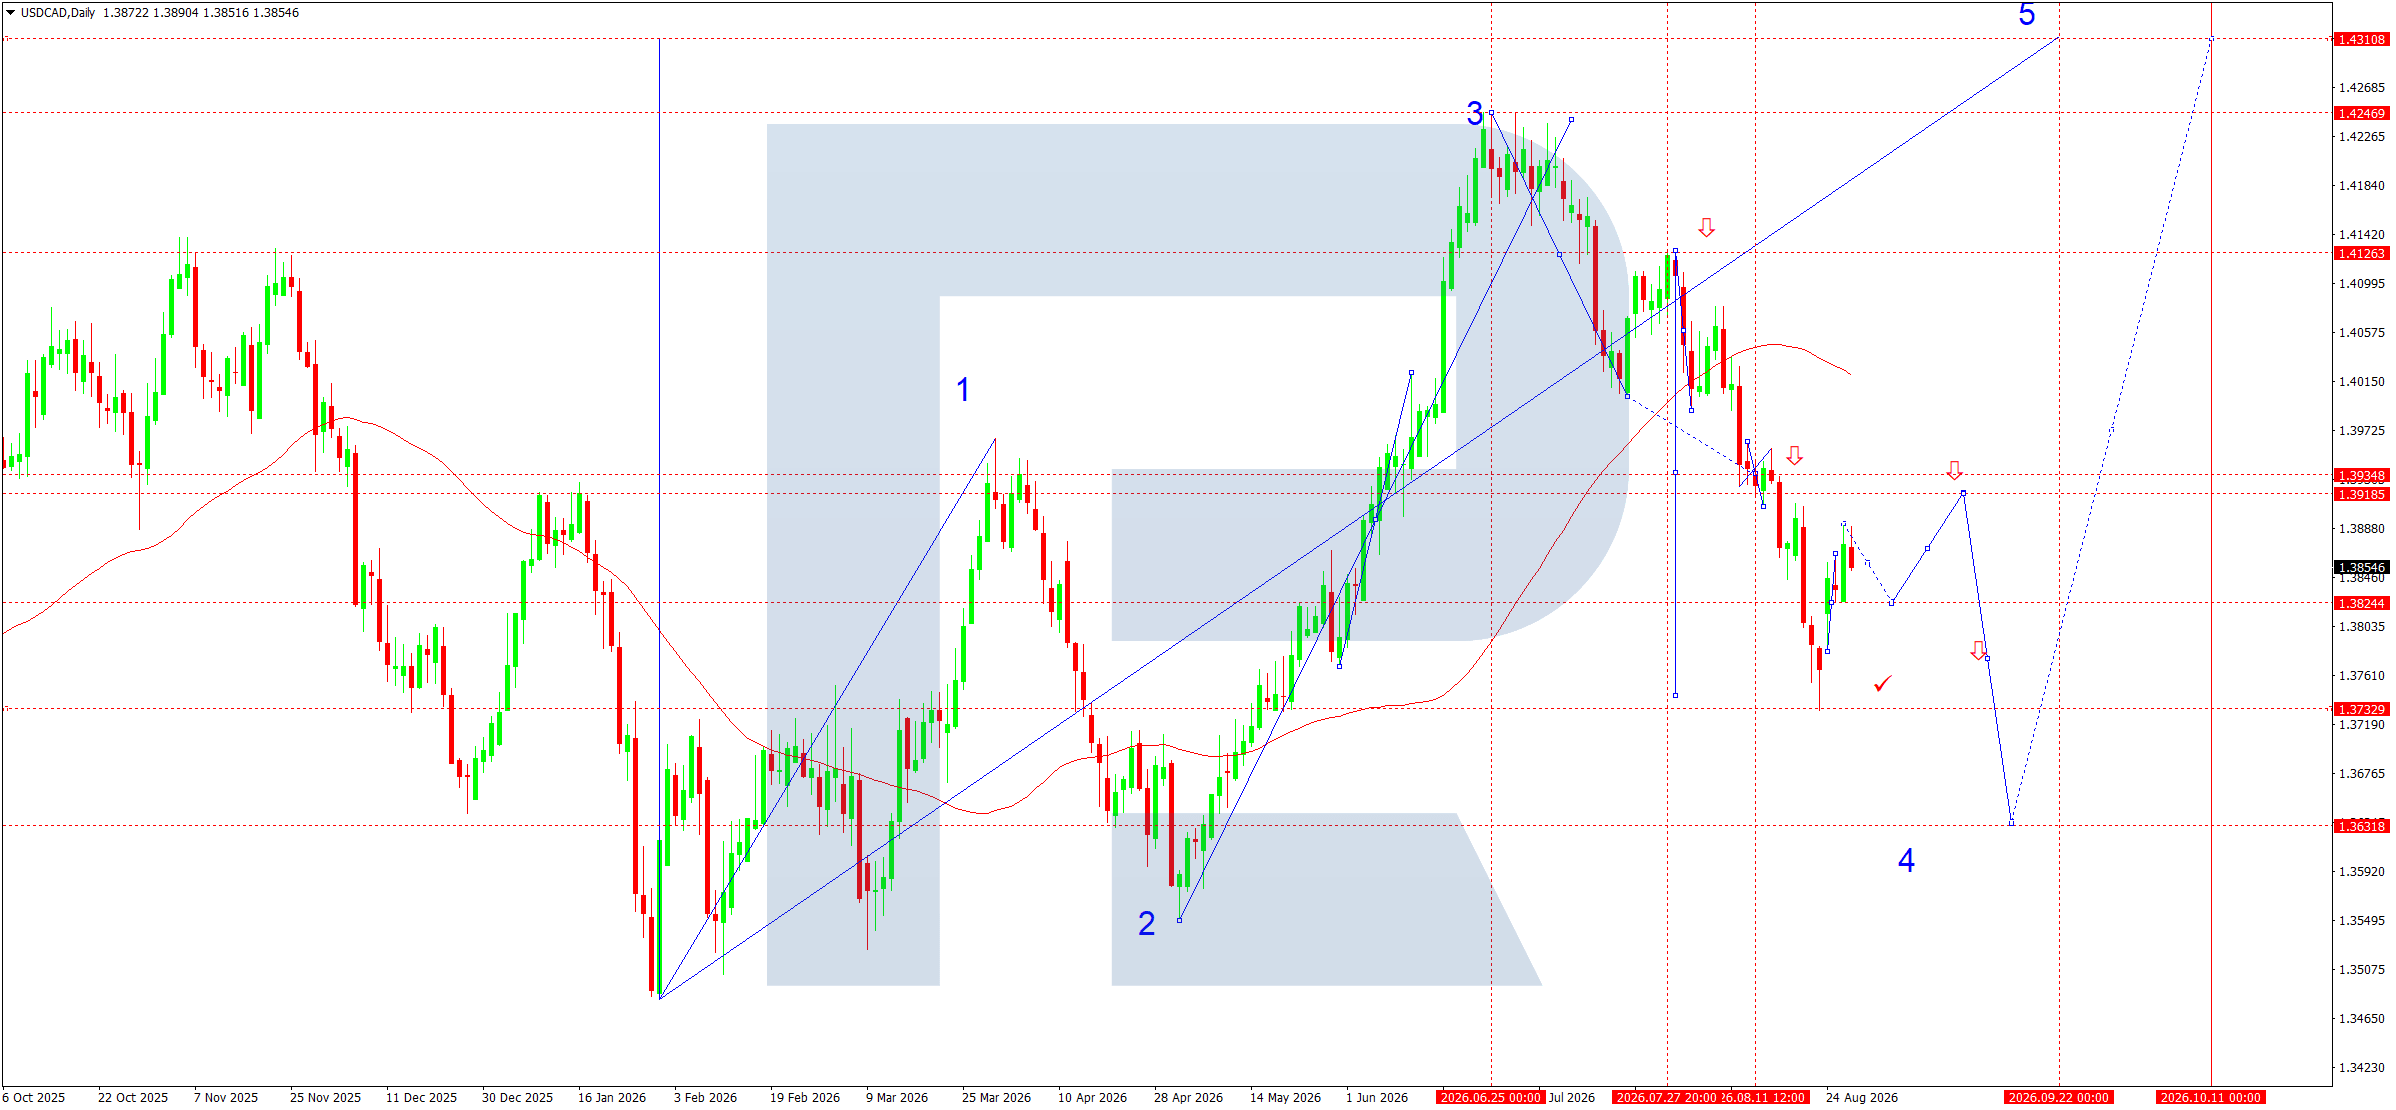
On the daily USDCAD chart, the market previously formed an upward impulse structure with waves 1, 2, and 3. After the third-wave peak formed around 1.4247, a correction began and developed into a pronounced decline. As a result, the market reached the 1.3934 pivot point and the local target of the downward wave at 1.3737.
The price is currently around 1.3855 and is attempting to form a local upward correction. For the week ahead, we expect the corrective move to continue towards at least 1.3918. In the near term, the market may retest 1.3824 from above. If support holds, the probability of a recovery towards 1.3918 will increase.
The 1.3918–1.3934 zone is the key resistance area. Reaching it would allow the current correction to be considered complete and the main downward move to resume. Once a reversal forms, the main target of the downward wave around 1.3632 will become relevant.
Therefore, selling into a recovery remains the preferred scenario. At the same time, a breakout below 1.3824 without a prior return to 1.3918 would indicate strengthening bearish momentum and increase the probability of an accelerated move towards 1.3732–1.3632.
USDCAD forecast scenarios
Trading scenario: SELL
- Price at the time of writing: 1.3855
- Entry price: 1.3918
- Stop loss: 1.3970
- Take profit: 1.3632
- Risk-to-reward ratio: 1:5.5
XAUUSD forecast
The fundamental backdrop for gold at the start of September remains mixed. On the one hand, XAUUSD is supported by a weaker US dollar, sustained demand from ETFs and central banks, and continued concerns about the state of US public finances. Investors’ desire to use the precious metal as a safe-haven asset remains another source of demand for gold. Gold strengthened noticeably in August despite periodic increases in expectations of tighter Federal Reserve policy.
The main event next week will be the market’s reaction to a speech by Federal Reserve Chair Kevin Warsh at the Jackson Hole symposium. Investors will look for signals regarding the future path of interest rates. Inflationary pressure remains elevated, with the PCE index holding at 3.7000% year-on-year in July. More hawkish Fed rhetoric could support the US dollar and US Treasury yields, creating short-term pressure on gold. At the same time, a more dovish assessment of monetary policy could provide the basis for a new upward impulse in XAUUSD.
XAUUSD technical analysis
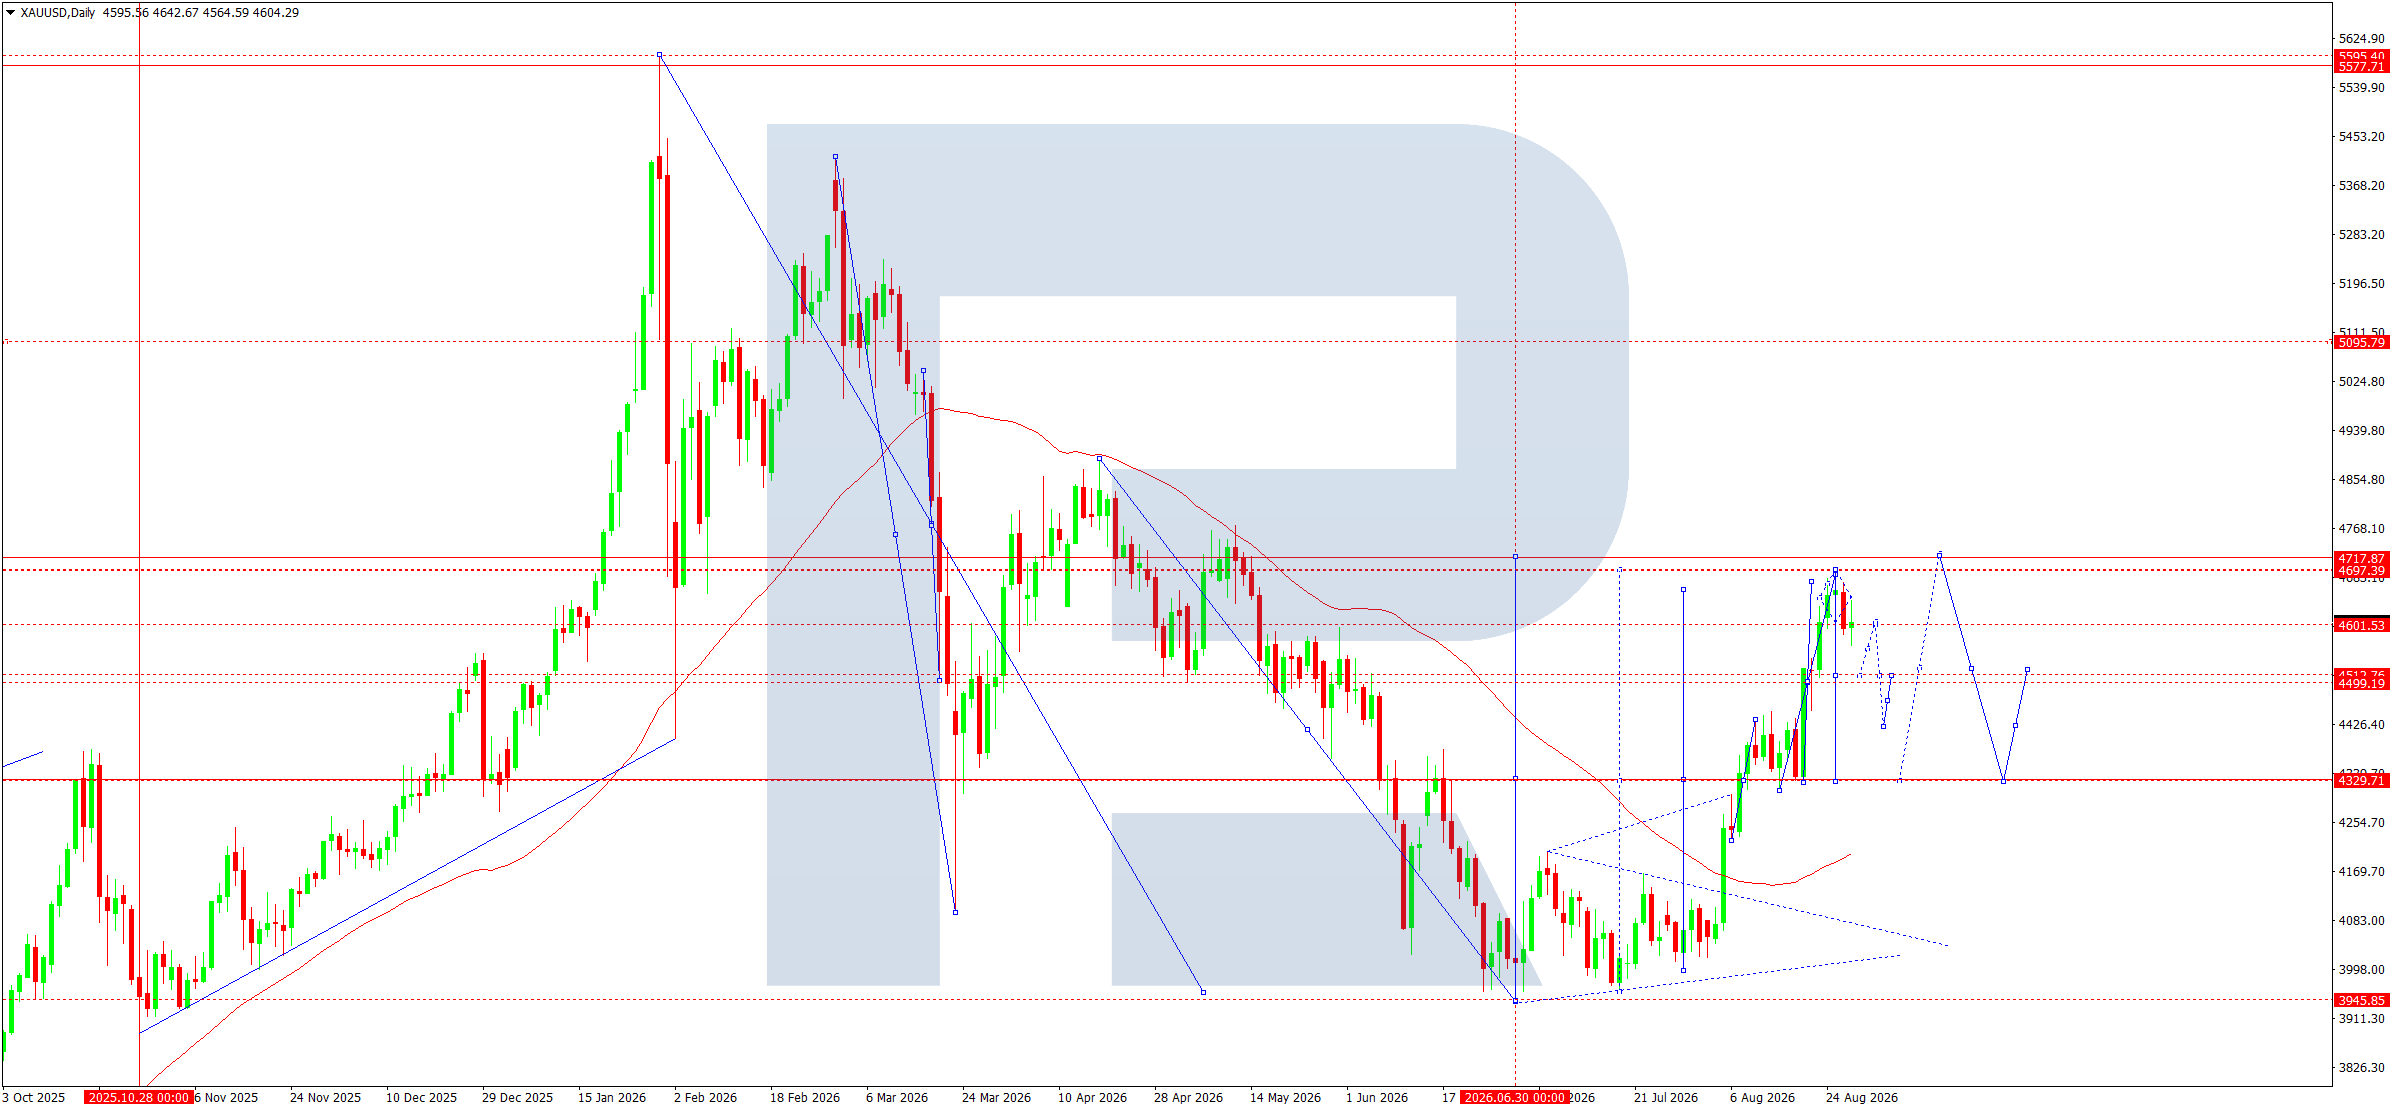
On the daily chart, the market continued to recover from the 3,945 area and formed a pronounced upward wave. The local target of this wave at 4,697 has effectively been reached: the price moved into the 4,697–4,700 area and then entered consolidation.
The current price structure shows signs of a reversal pattern forming. After reaching 4,697, the market failed to consolidate above this resistance and began to form a downward correction. Therefore, the base technical scenario for the week ahead is a continued decline towards 4,329. This area is the nearest significant support zone and the central point of the current corrective structure.
When 4,329 is reached, the reaction from buyers should be assessed. Holding this level could trigger a new upward impulse and return the market towards 4,601 and then the main target of the current upward wave around 4,717. Therefore, a correction towards 4,329 is viewed not as an invalidation of the medium-term rise, but as a potential redistribution phase before another move higher.
At the same time, a breakout and consolidation below 4,329 would increase the probability of a deeper correction. Therefore, 4,329 becomes the key technical reference point for the week. Resistance at 4,697–4,717 retains its status as the main sellers’ zone.
XAUUSD forecast scenarios
Trading scenario: SELL
- Price at the time of writing: 4,604
- Entry price: 4,640
- Stop loss: 4,720
- Take profit: 4,330
- Risk-to-reward ratio: 1:4
US 500 forecast
The fundamental backdrop for the week ahead remains mixed. The US market is ending the week near record highs, while on 27 August the S&P 500 rose by around 0.7%, supported by strong performance in the technology sector and Nvidia’s positive outlook. At the same time, the market remains highly sensitive to US Treasury yields, inflation, and the future policy of the Federal Reserve.
The main event remains a speech by Federal Reserve Chair Kevin Warsh at the Jackson Hole symposium. The market will look for signals regarding the future path of interest rates. At its latest meeting, the Fed kept the rate within the 3.50–3.75% range, with three votes in favour of a rate hike, indicating that inflation risks remain elevated.
The labour market will be another important factor. The JOLTS report will be released on 1 September, ADP data on 2 September, and the official August employment report on 4 September. The previous report was weak: employment fell by 23,000 jobs in July, while the May and June figures were revised substantially lower. This creates a fundamental basis for a possible decline in bond yields if the August data are weak again.
US 500 technical analysis
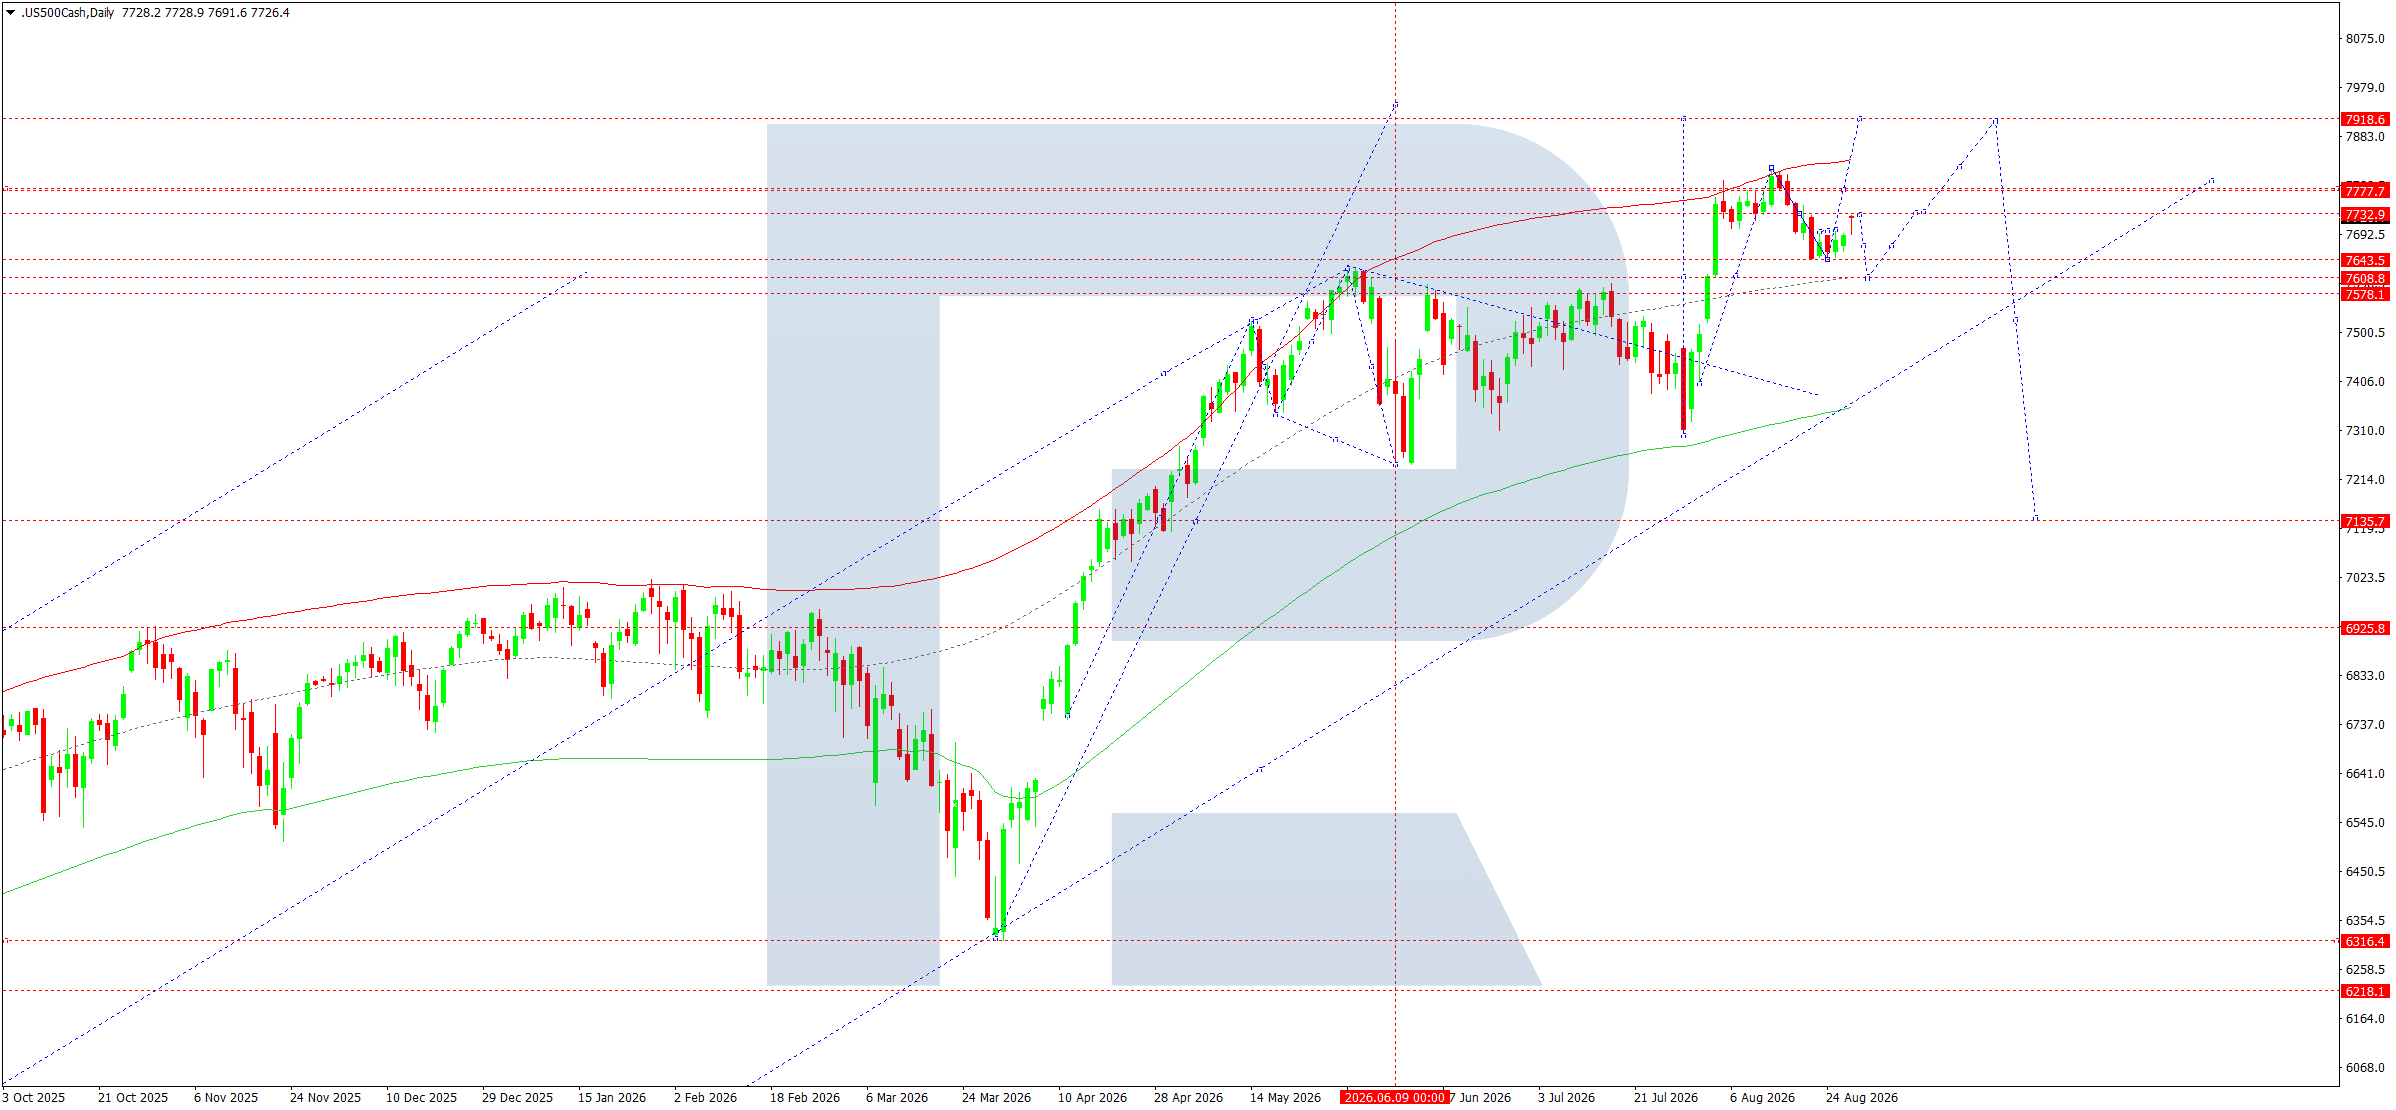
US 500 completed a local upward impulse by reaching the 7,816 target. After forming a peak, the market moved into a consolidation range. The first downward wave towards 7,643 has already almost formed, followed by a correction towards 7,740. Therefore, the current structure allows for a continuation of the downward correction.
For the week ahead, the main scenario is a decline from the 7,740 area with the first target at 7,608. A breakout below 7,608 would increase the probability of the correction continuing towards the lower part of the current structure. At the same time, the 7,643 area remains the nearest control zone: a return above it without consolidation below would indicate that sideways consolidation is being maintained.
Once the corrective decline is complete, the scenario of renewed growth becomes relevant. If support at 7,608 holds and the market forms a reversal structure, the next significant target will be 7,919. This level is viewed as the main target of the subsequent upward wave. A breakout above 7,816 would provide additional confirmation of the recovery in the upward movement.
Therefore, at the beginning of the week, the advantage remains with a corrective decline towards 7,608. Growth towards 7,919 should be considered after a full reversal has formed from the lower levels.
US 500 forecast scenarios
Trading scenario: SELL
- Price at the time of writing: 7,726
- Entry price: 7,740
- Stop loss: 7,816
- Take profit: 7,608
- Risk-to-reward ratio: 1:1
BTCUSD forecast
At the start of the new week, Bitcoin’s fundamental backdrop remains mixed. The main driver in recent days has been the weakening US dollar and changing expectations regarding US monetary policy. The US Treasury’s decision to increase purchases of long-term government bonds has strengthened investor interest in scarce assets, including Bitcoin and gold. Against this backdrop, BTC returned above 80,000 for the first time in several months. Additional support came from inflows into spot Bitcoin ETFs, which totalled around 2.5 billion USD over the past seven trading days.
At the same time, the market is awaiting a speech by Federal Reserve Chair Kevin Warsh at the Jackson Hole symposium. The key question is how hawkish the Fed’s stance will remain amid persistent inflation and elevated Treasury yields. Any signals of a more restrictive policy could temporarily strengthen the US dollar and put pressure on Bitcoin.
Next week, attention will shift to US data: JOLTS figures will be released on 1 September, followed by the August employment report on 4 September. ISM manufacturing data will also be important. Strong statistics could reduce expectations of Fed easing, while weak data may restore demand for risk assets.
BTCUSD technical analysis
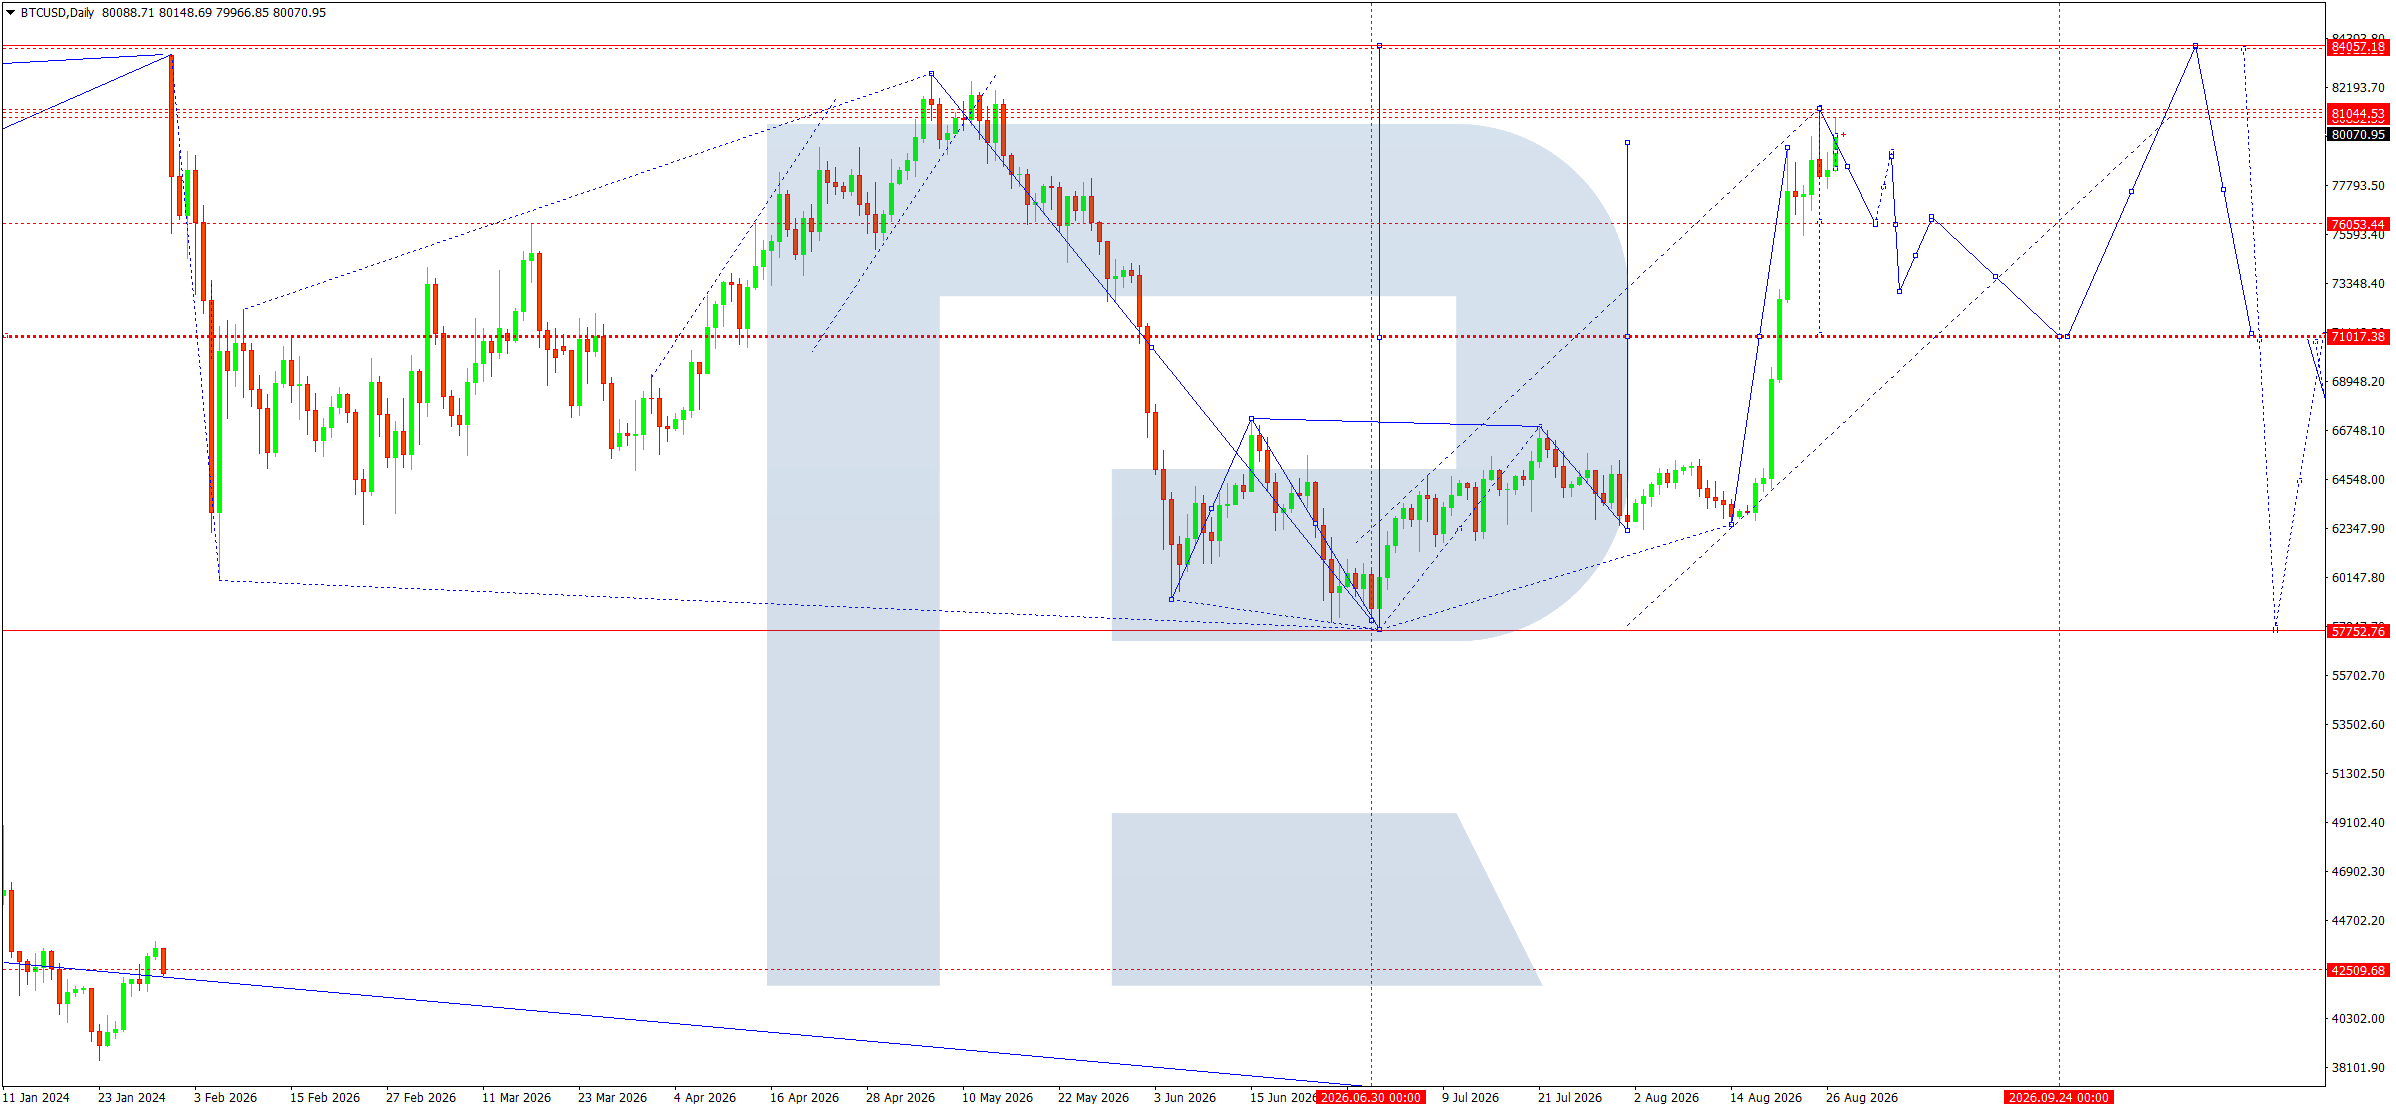
On the daily chart, the market reached the local target of the previous upward wave at 81,044. A consolidation range formed in this area, after which the price began to decline. The first downward wave towards 77,625 has almost formed, followed by a correction towards 80,838. Therefore, the 80,838–81,044 area remains the key resistance zone, from which the scenario of a continued downward correction retains the advantage.
For the week ahead, we expect the decline to continue towards at least 76,053. Reaching this target would correspond to the development of the next downward wave after the correction is complete. If the price consolidates below 76,053, the next significant area will be 71,017. However, 76,053 is initially the sellers’ main local target.
After reaching 76,053, it will be relevant to consider the possibility of a recovery towards 79,245. Therefore, a move to 76,053 should not automatically be viewed as the beginning of a new large-scale bearish trend. If support holds and a reversal pattern emerges, Bitcoin may move into corrective growth.
A breakout above 81,044 and consolidation above it would invalidate the nearest downside scenario and open the way towards 82,193 and then the 84,057 area.
BTCUSD forecast scenarios
Trading scenario: SELL
- Price at the time of writing: 80,070
- Entry price: 80,070
- Stop loss: 81,044
- Take profit: 76,053
- Risk-to-reward ratio: 1:4.13
Editors’ picks
 EURUSD forecast 2026–2027: technical analysis, price levels & predictions
EURUSD has recovered from the July lows and is trading near 1.1545 — back in bullish territory. The pair has reclaimed EMA65 on the daily, formed a bullish EMA crossover on H4, and the US-eurozone GDP gap has narrowed sharply (US 1.5% vs eurozone 1.0%). Goldman Sachs and Deutsche Bank both now target 1.2500 by year-end. A confirmed close above 1.1700 opens the path to 1.1805. We break down the key levels, three trading scenarios, and what the unprecedented 9-3 FOMC dissent vote means for EURUSD.
 Gold (XAUUSD) forecast 2026: technical analysis, price levels & predictions
Gold has reversed its downtrend and is trading near 4,360 USD, back above both EMA65 and EMA200. ETF flows turned positive in July with 3 billion USD of net inflows, and central banks bought 288.9 tonnes in Q2 — up 62% year-on-year. A breakout above 4,500 USD opens the path to 4,855 USD and the 5,597 USD all-time high. We break down the key levels, three trading scenarios with entry triggers, and what J.P. Morgan, Deutsche Bank and Goldman Sachs are forecasting for gold in 2026.
Forecasts presented in this section only reflect the author’s private opinion and should not be considered as guidance for trading. RoboForex bears no responsibility for trading results based on trading recommendations described in these analytical reviews.