
Weekly technical analysis and forecast (21–25 September 2026)
In this weekly technical analysis, we examine the key chart patterns and price levels for EURUSD, USDJPY, GBPUSD, AUDUSD, USDCAD, Gold (XAUUSD), US 500, and Bitcoin (BTCUSD) to forecast market developments for the week ahead (21–25 September 2026).
Major technical levels to watch this week
- EURUSD: Support: 1.1474, 1.1453. Resistance: 1.1534, 1.1600
- USDJPY: Support: 155.05, 152.90. Resistance: 156.89, 157.26
- GBPUSD: Support: 1.3278, 1.3162. Resistance: 1.3415, 1.3480
- AUDUSD: Support: 0.7073, 0.7022. Resistance: 0.7128, 0.7236
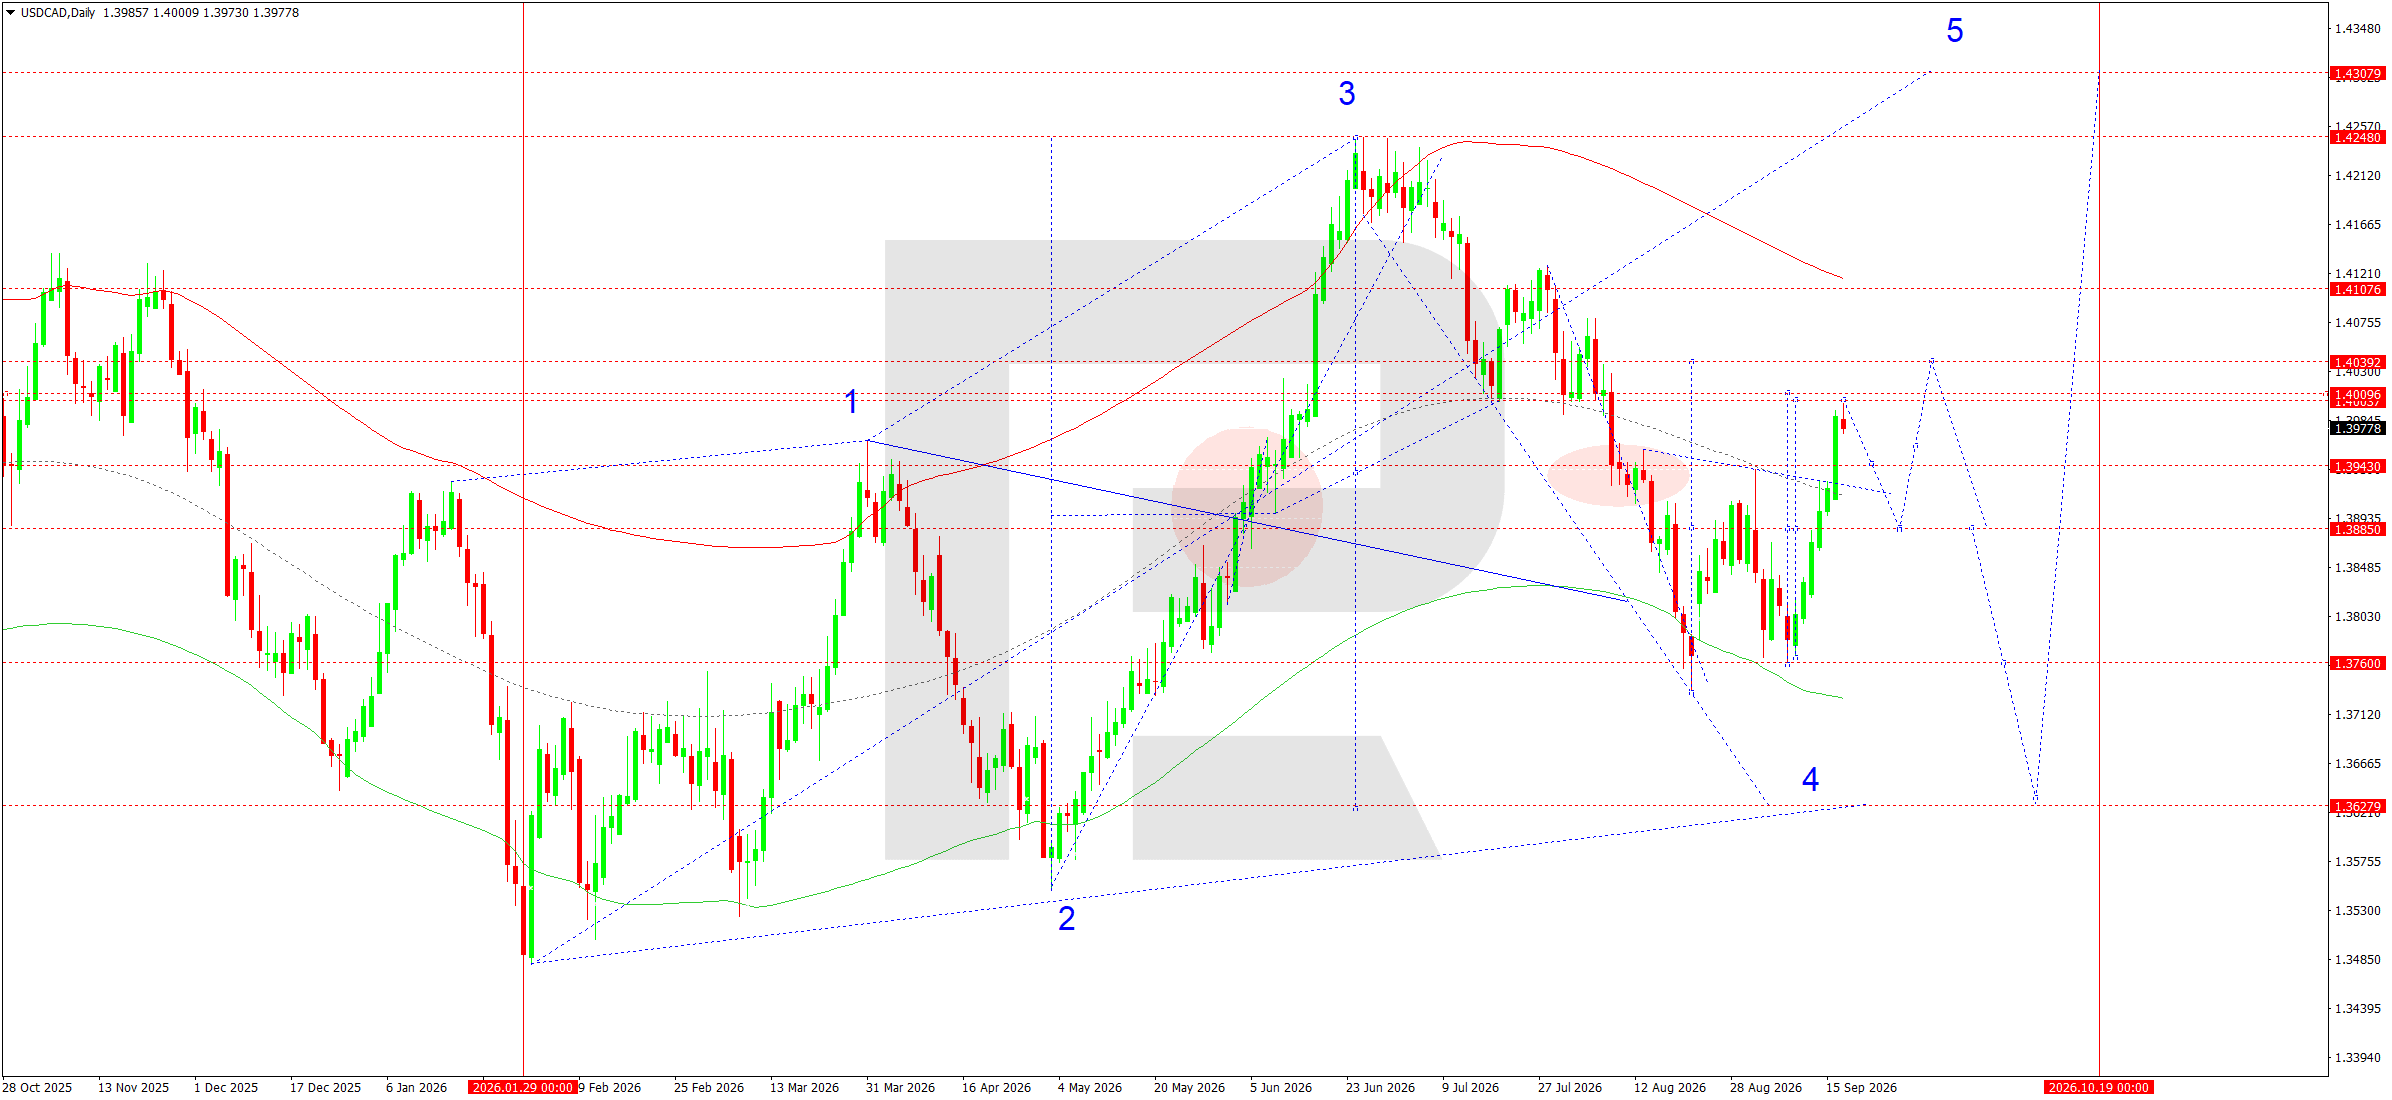
- USDCAD: Support: 1.3943, 1.3885. Resistance: 1.4009, 1.4039
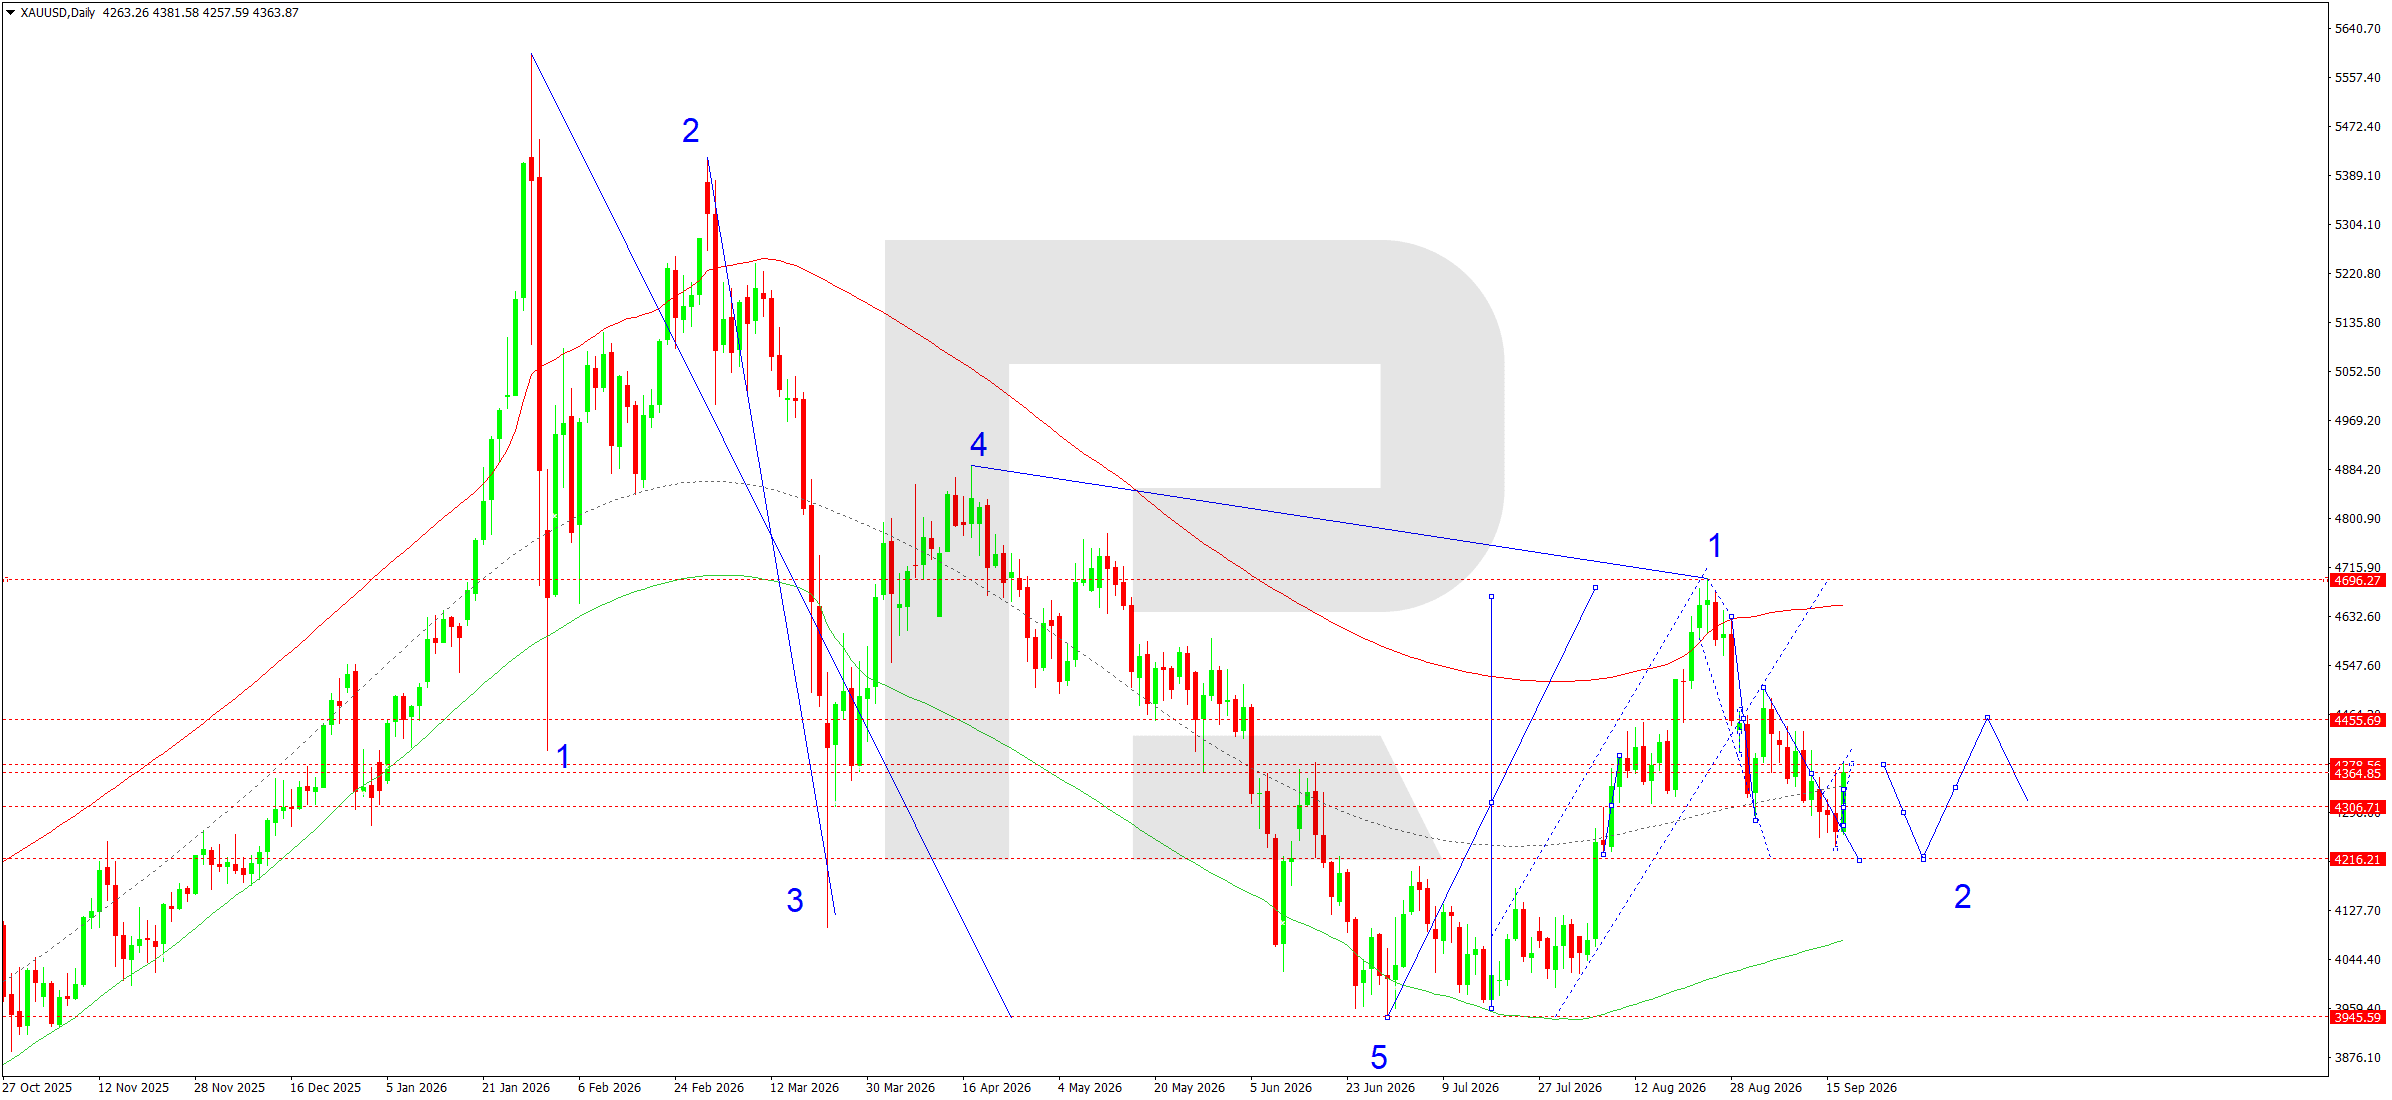
- Gold: Support: 4,307, 4,216. Resistance: 4,379, 4,456
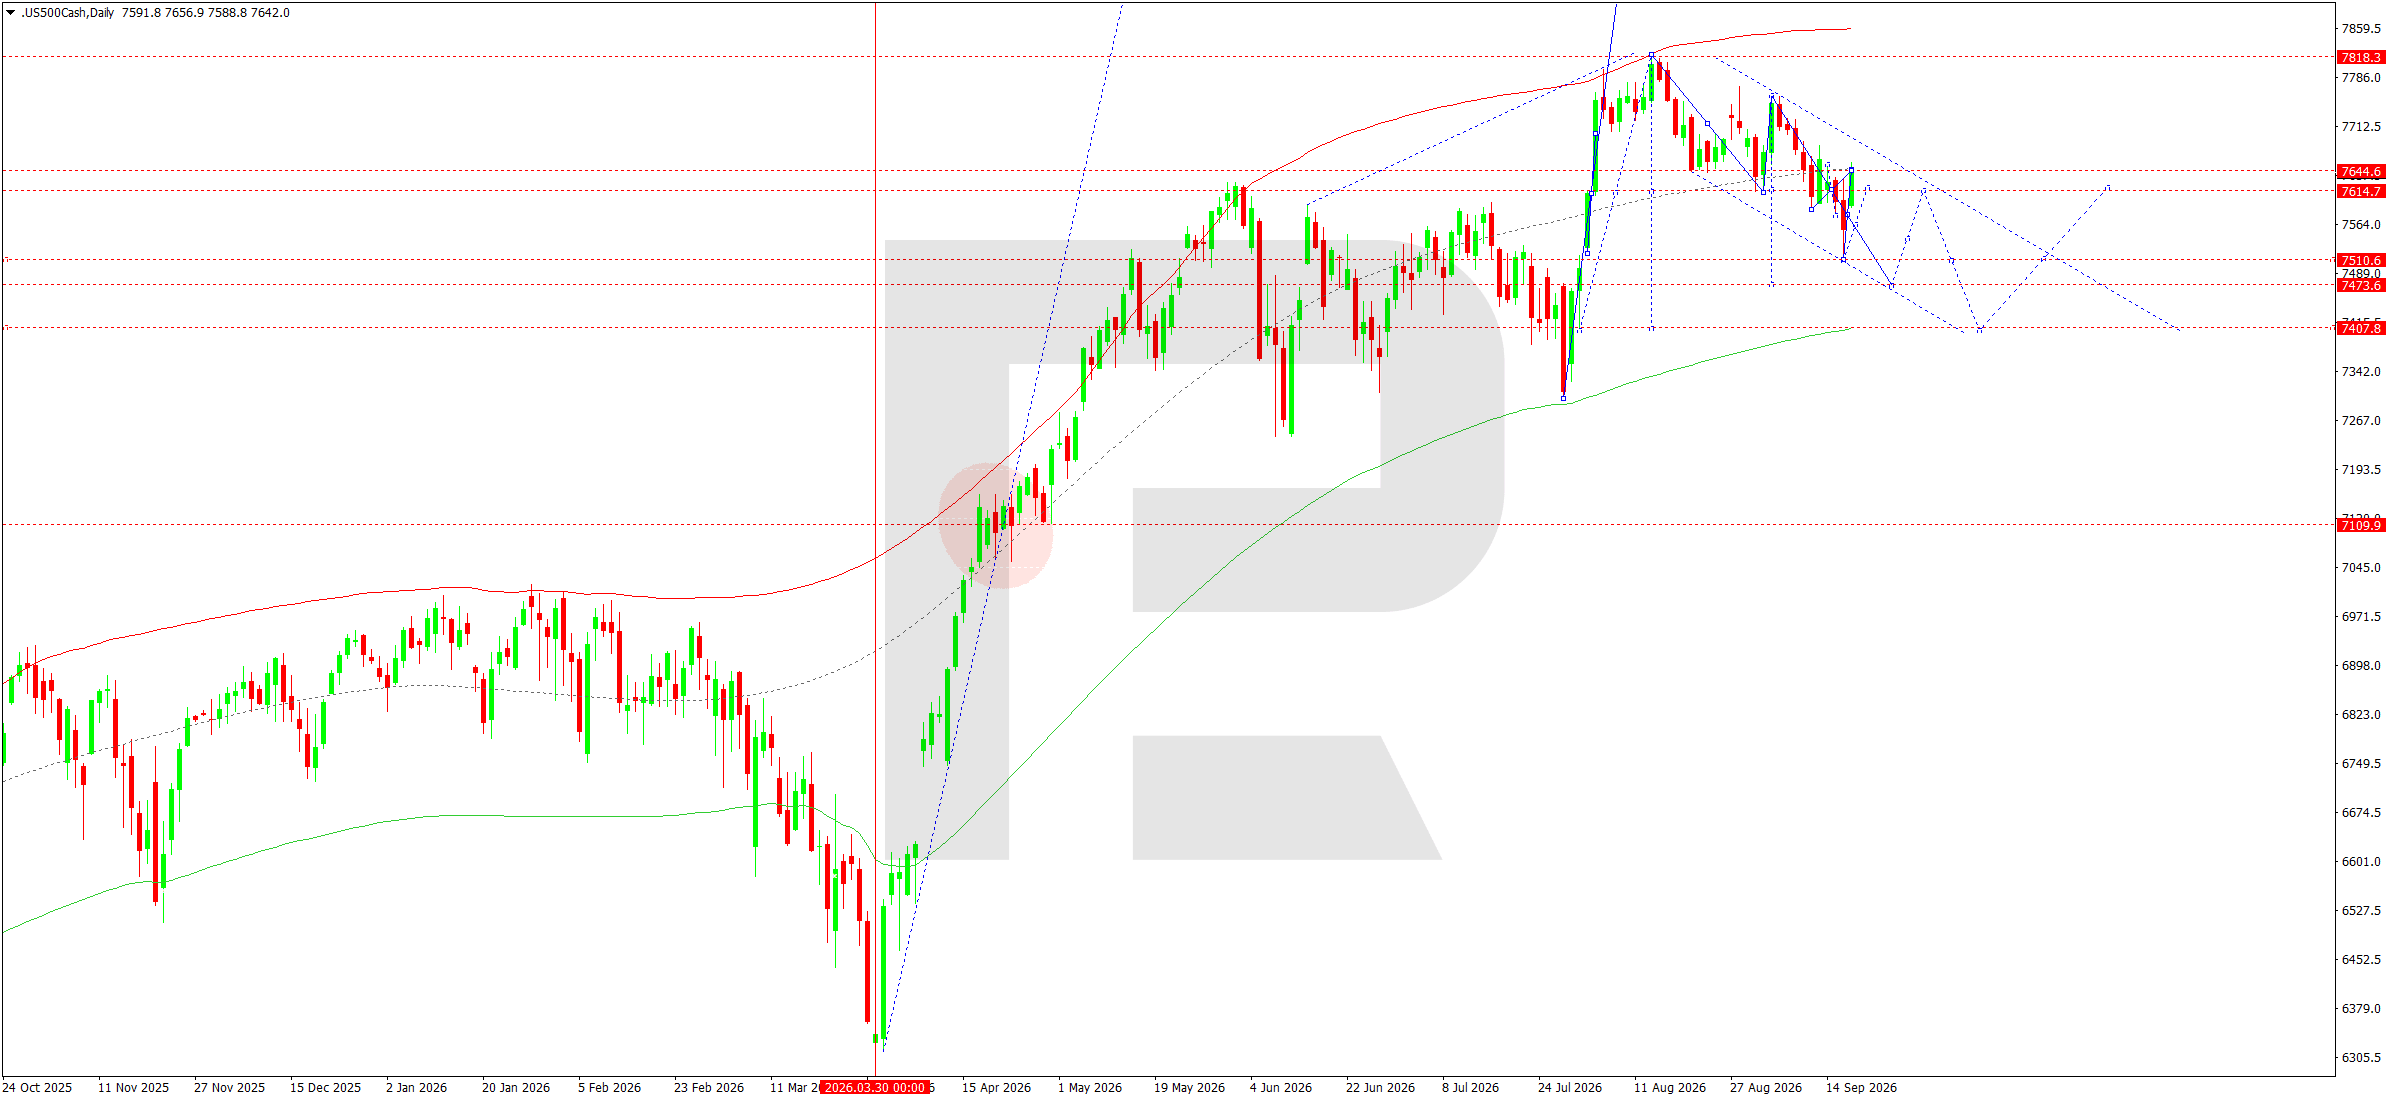
- US 500: Support: 7,615, 7,511. Resistance: 7,645, 7,818
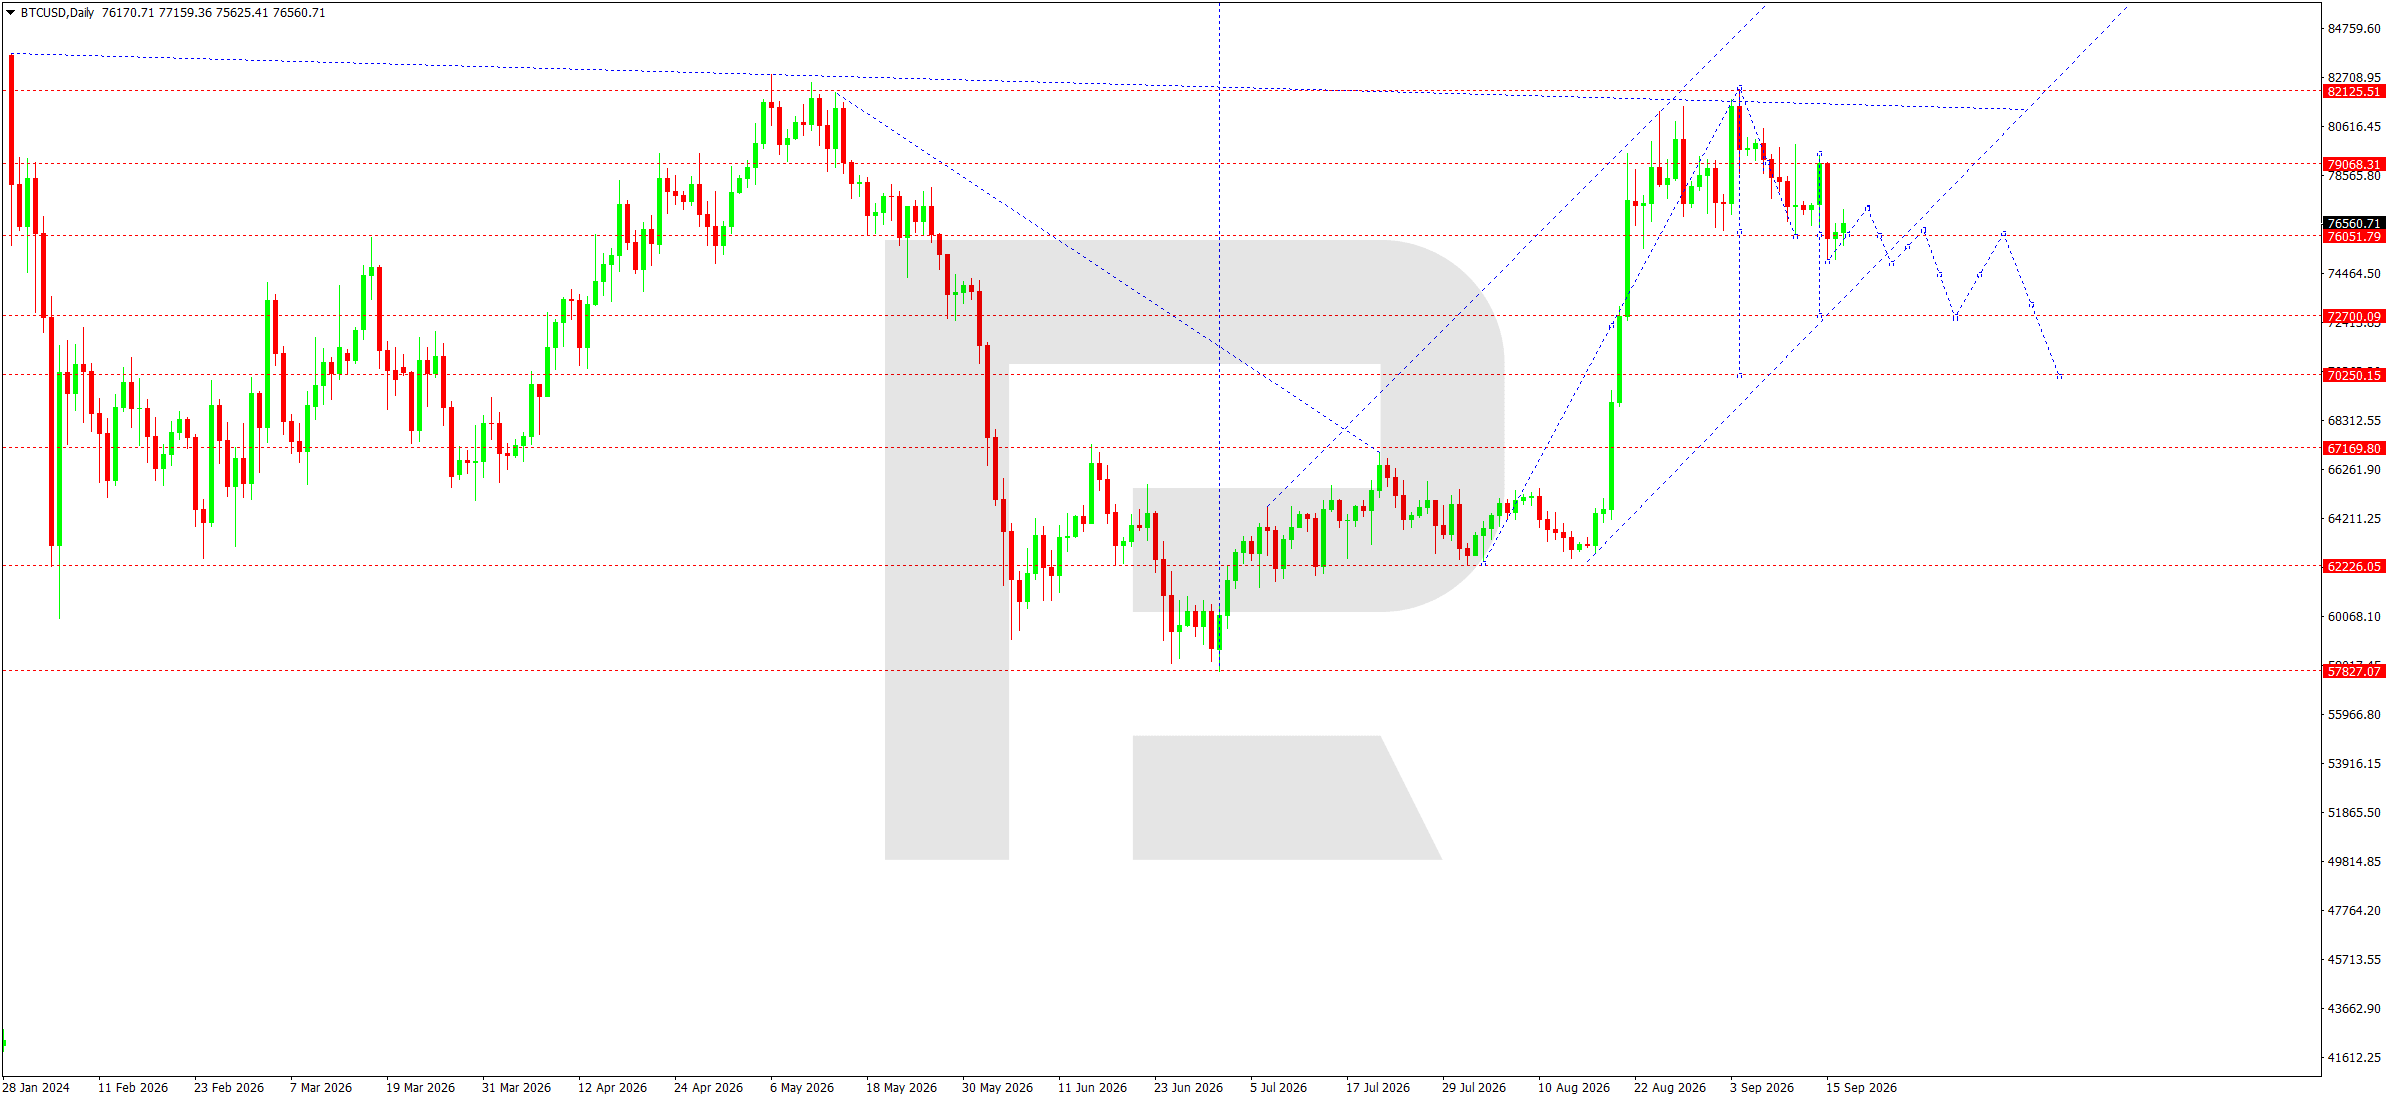
- BTCUSD: Support: 76,052, 72,700. Resistance: 79,068, 82,126
EURUSD forecast
At the start of the new week, the fundamental backdrop for EURUSD is being shaped by simultaneous monetary tightening in the US and the eurozone. The Federal Reserve raised the target rate range by 25 basis points to 3.75–4.00% on 16 September, while the median projection of meeting participants allows for one more increase before the end of 2026. The August US Consumer Price Index rose by 3.4% year-on-year, while the core reading was 2.4%, keeping inflation risks elevated. Rising short-term Treasury yields provide additional support to the US dollar. The market remains sensitive to oil dynamics and the geopolitical premium: an easing of the energy shock could partly reduce demand for the US dollar, but the Fed’s overall tone still limits the euro’s recovery potential.
The European Central Bank also raised all three key interest rates by 25 basis points on 10 September, taking the deposit rate to 2.50%. The Bank explained the decision by persistent inflationary pressure, primarily linked to energy, and maintained that further steps would depend on incoming data. Eurostat’s final estimate showed annual eurozone inflation accelerating to 3.2% in August from 2.9% in July. The ECB expects average inflation of 3.0% in 2026 and economic growth of 0.9%.
This supports expectations of further tightening and limits pressure on the euro, although the Fed’s higher rate and a strong US dollar act in the opposite direction. During the week, market participants will pay particularly close attention to new signals from officials of both central banks, bond-yield dynamics, and energy prices, as these factors could quickly change the balance of expectations. Therefore, the fundamental balance for the week remains mixed, with a moderate advantage for the US currency. European Central Bank
EURUSD technical analysis
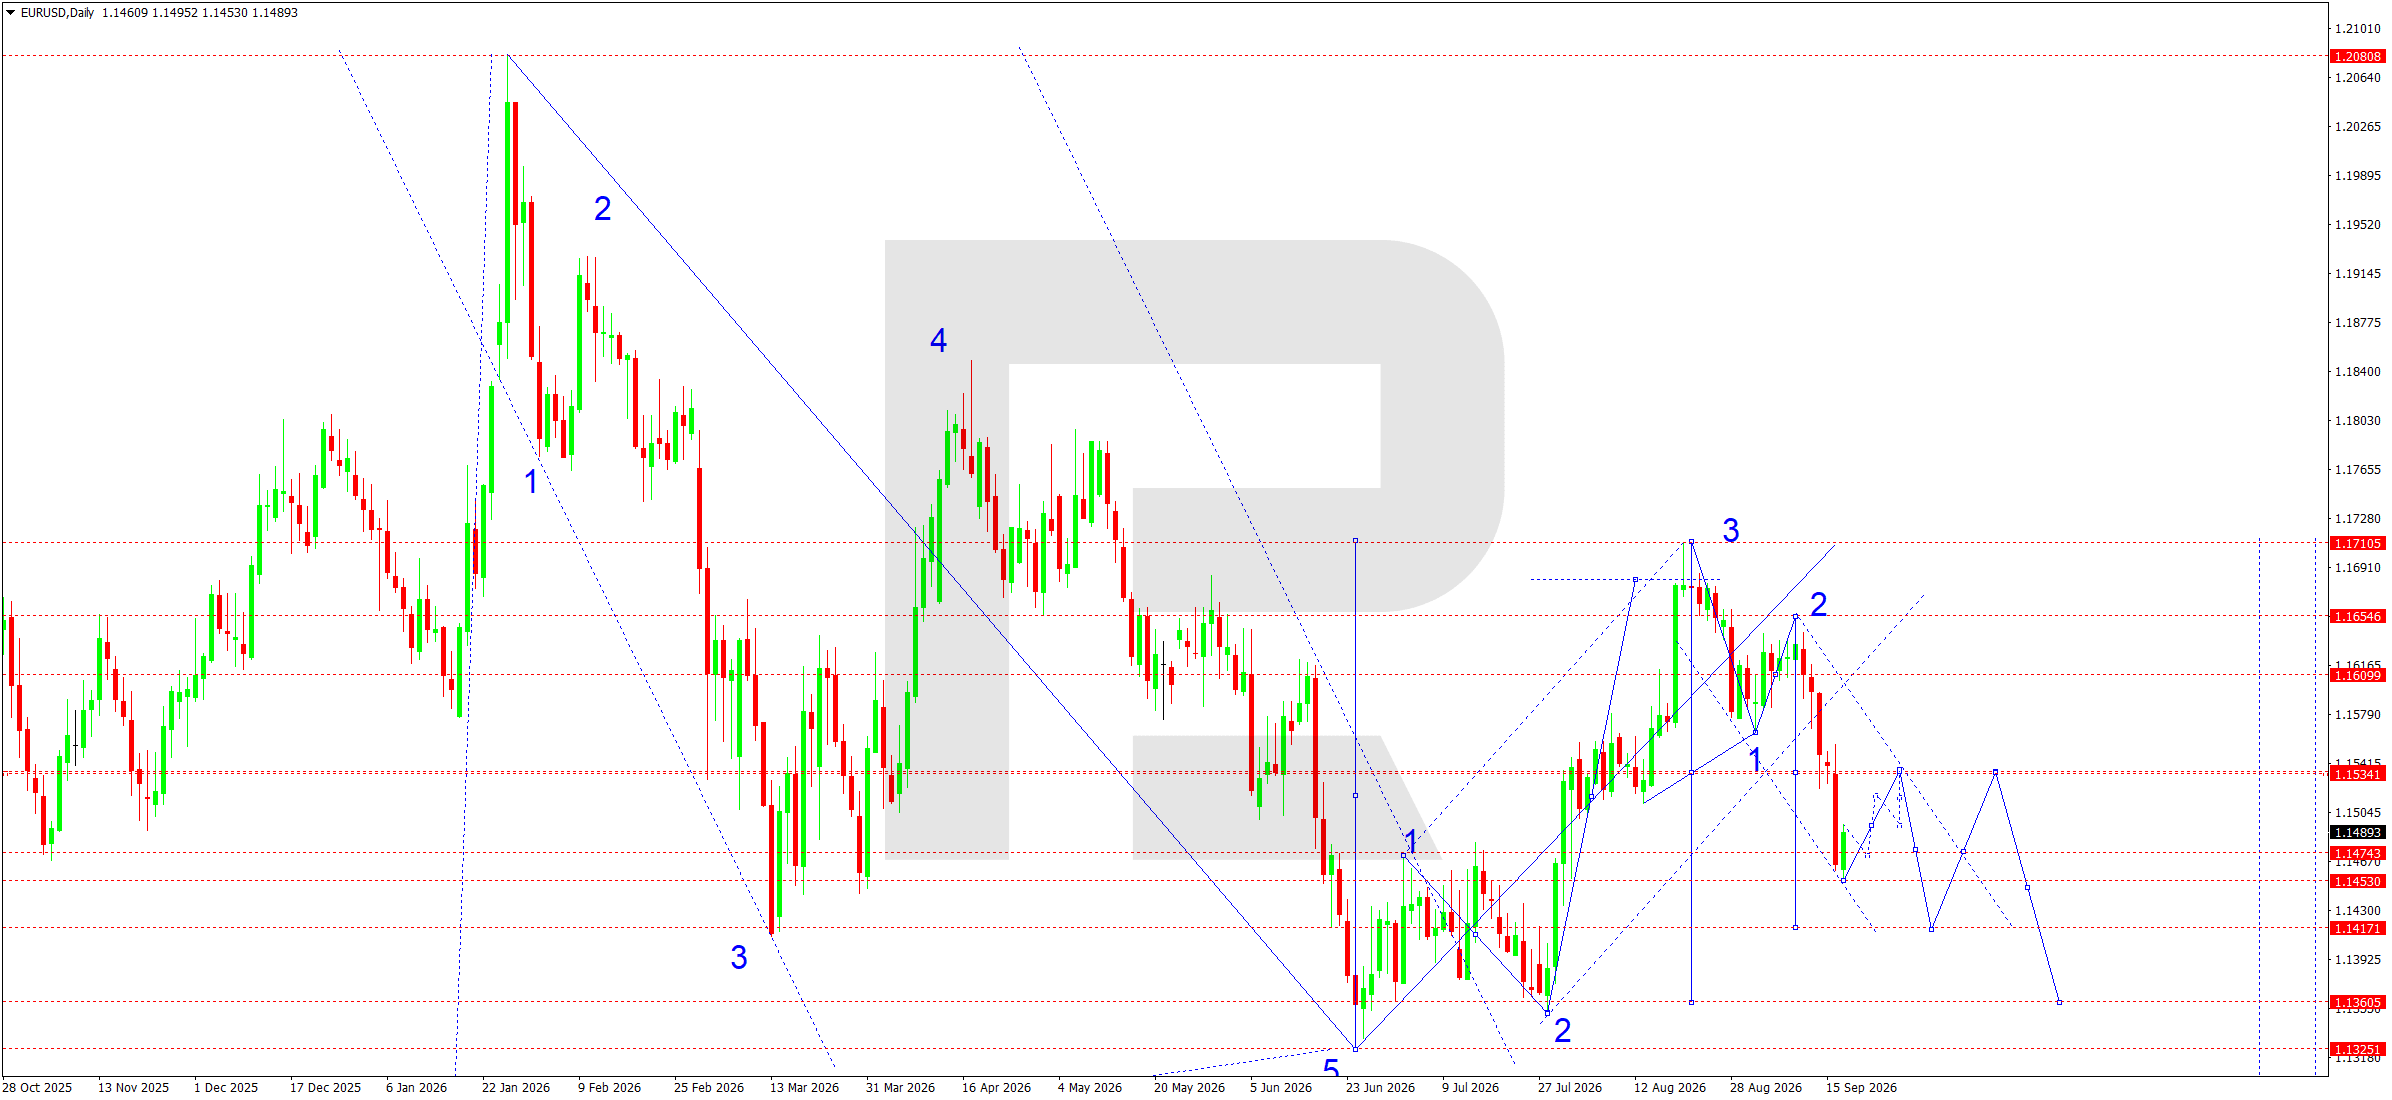
On the daily chart, the pair completed a downward wave towards 1.1535 and, after forming a consolidation range, broke below it and reached the local target of the third wave around 1.1453. The 1.1535 level effectively acted as a pivot point and remains the main resistance for the current structure.
After reaching 1.1453, the market formed a recovery impulse towards 1.1495, although this move is still viewed as corrective within the prevailing downtrend. The chart structure remains under pressure from the descending channel, while consolidation below 1.1534 confirms the sellers’ advantage.
The nearest reference point is a correction towards 1.1473. A new range is likely to form around this level. An upside breakout would allow the recovery to extend towards 1.1534, where sellers are expected to become active again. A return below 1.1473 would open the way towards the local target at 1.1417. The main target of the downward structure remains 1.1360. While the price remains below 1.1534–1.1535, the priority is to sell once the corrective rise is complete.
EURUSD forecast scenario
Trading scenario: SELL
- Price at the time of writing: 1.1489
- Entry price: 1.1484
- Stop Loss: 1.1540
- Take Profit: 1.1360
- Risk-to-reward ratio: 1:2.2
The trade idea is valid until 8:00 on 28 September 2026 (server time, UTC+3).
USDJPY forecast
At the start of the new week, the fundamental backdrop for USDJPY remains mixed but volatile. The Federal Reserve raised the target rate range by 0.25 percentage points to 3.75–4.00% on 16 September, highlighting economic resilience and persistent inflationary pressure. Most Fed members allow for another rate hike before the end of 2026, supporting US bond yields and limiting the potential for a sustained weakening of the US dollar.
At the same time, market attention is focused on the Bank of Japan, whose meeting takes place on 17–18 September. Market consensus expects the rate to rise from 1.00% to 1.25%. Another factor will be the release of Japan’s August inflation data on the morning of 18 September, with the core reading expected at around 1.80%. High imported inflation and the yen’s weakness continue to support the case for further BoJ tightening. At the same time, Japanese authorities have again stated their readiness to counter excessive currency fluctuations, increasing the risk of sharp moves in the pair if it returns above 157.00. During the week of 21–25 September, the key driver will be the market’s assessment of the divergence between the Fed and BoJ rate paths following both decisions.
Another source of pressure on the yen is Japan’s external trade balance: imports rose sharply in August due to expensive oil, while the trade deficit widened. At the same time, exports remain strong, partially offsetting the negative effect. The tone of BoJ Governor Kazuo Ueda’s remarks after the decision will be especially important for the market. More hawkish rhetoric could strengthen the yen, while cautious signals about further rate increases could restore demand for the US dollar and push USDJPY towards the nearest resistance levels. Reuters
USDJPY technical analysis
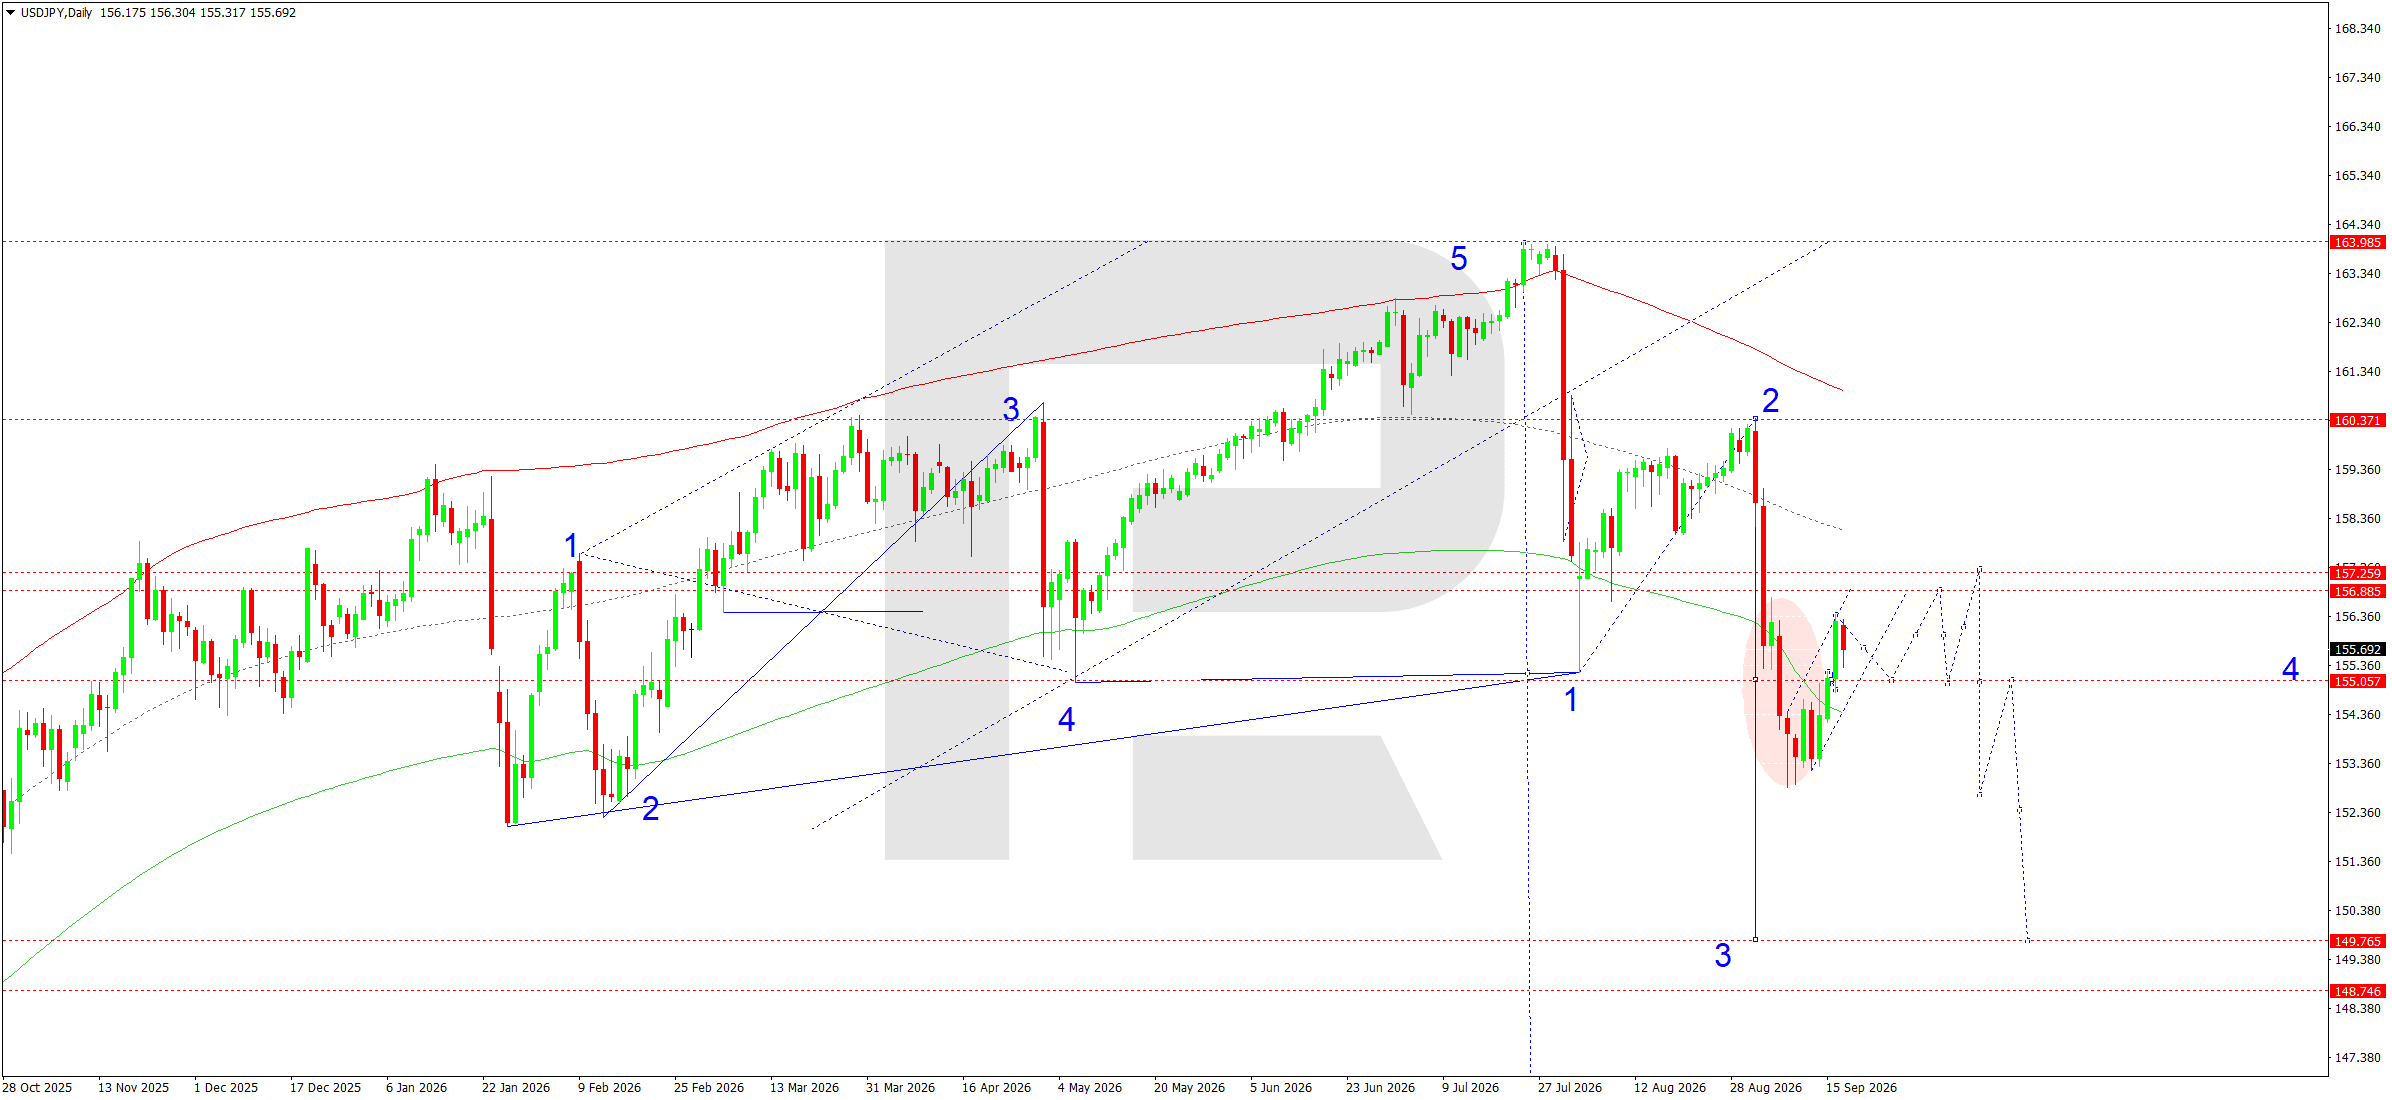
On the daily chart, after the completion of the five-wave upward structure around 163.99, a downward reversal formed. The price successively moved through the 160.37 area and reached the local downside target around 152.90, after which it developed a corrective impulse towards 155.05. Consolidation is now forming around 155.05, while the recovery retains potential to continue towards the 156.89–157.26 area. This zone coincides with the nearest resistance and could complete the corrective leg.
The main scenario remains downward. While the price stays below 157.26, the rise is viewed as a correction within a larger downward wave. Once the recovery is complete, another attempt to consolidate below 155.05 and continue towards 152.90 is expected. A breakout below this level would open the way for the development of the third wave into the 149.30–149.75 target area, with 149.75 as the main target. After this area is reached, a corrective recovery towards 152.90 is likely, after which the downward trend could resume. The overall chart structure still confirms the sellers’ advantage, while a sustained move above 157.26 would require the short-term scenario to be reassessed.
Additional technical confirmation of the decline comes from the price remaining below the descending moving average and beneath the previous breakout area at 156.89–157.26. Until the recovery turns into a sustained consolidation above this zone, selling after the corrective move ends remains the priority.
USDJPY forecast scenario
Trading scenario: SELL
- Price at the time of writing: 155.69
- Entry price: 155.64
- Stop Loss: 157.30
- Take Profit: 149.75
- Risk-to-reward ratio: 1:3.55
The trade idea is valid until 8:00 on 28 September 2026 (server time, UTC+3).
GBPUSD forecast
The fundamental backdrop for GBPUSD remains mixed, although the US dollar retains the short-term advantage. The Bank of England kept the rate unchanged at 3.75% on 17 September, with the decision taken by a 6–3 vote. The regulator also warned of the risk of inflation accelerating above 4% in early 2027 if the energy shock persists. The BoE also suspended active sales of government bonds, easing pressure on the long end of the UK yield curve.
UK inflation accelerated to 3.1% year-on-year in August from 2.9% a month earlier. Higher fuel prices made the largest contribution, while underlying inflationary dynamics remained persistent. July GDP rose by 0.4% month-on-month, confirming that the economy is so far avoiding a sharp slowdown. Another inflation signal came from producer input prices, which rose by 6.1% year-on-year, while output prices increased by 3.7%, reinforcing the risk of persistent price pressure. This set of data supports a cautiously restrictive BoE stance, but does not guarantee sterling strength, as higher energy costs also worsen the growth outlook.
The US factor remains the main opposing pressure. The Federal Reserve raised the target rate range to 3.75–4.00% on 16 September and signalled the possibility of further tightening. A more restrictive Fed path supports the US dollar and preserves the fundamental risk of a further GBPUSD decline at the start of the week.
GBPUSD technical analysis
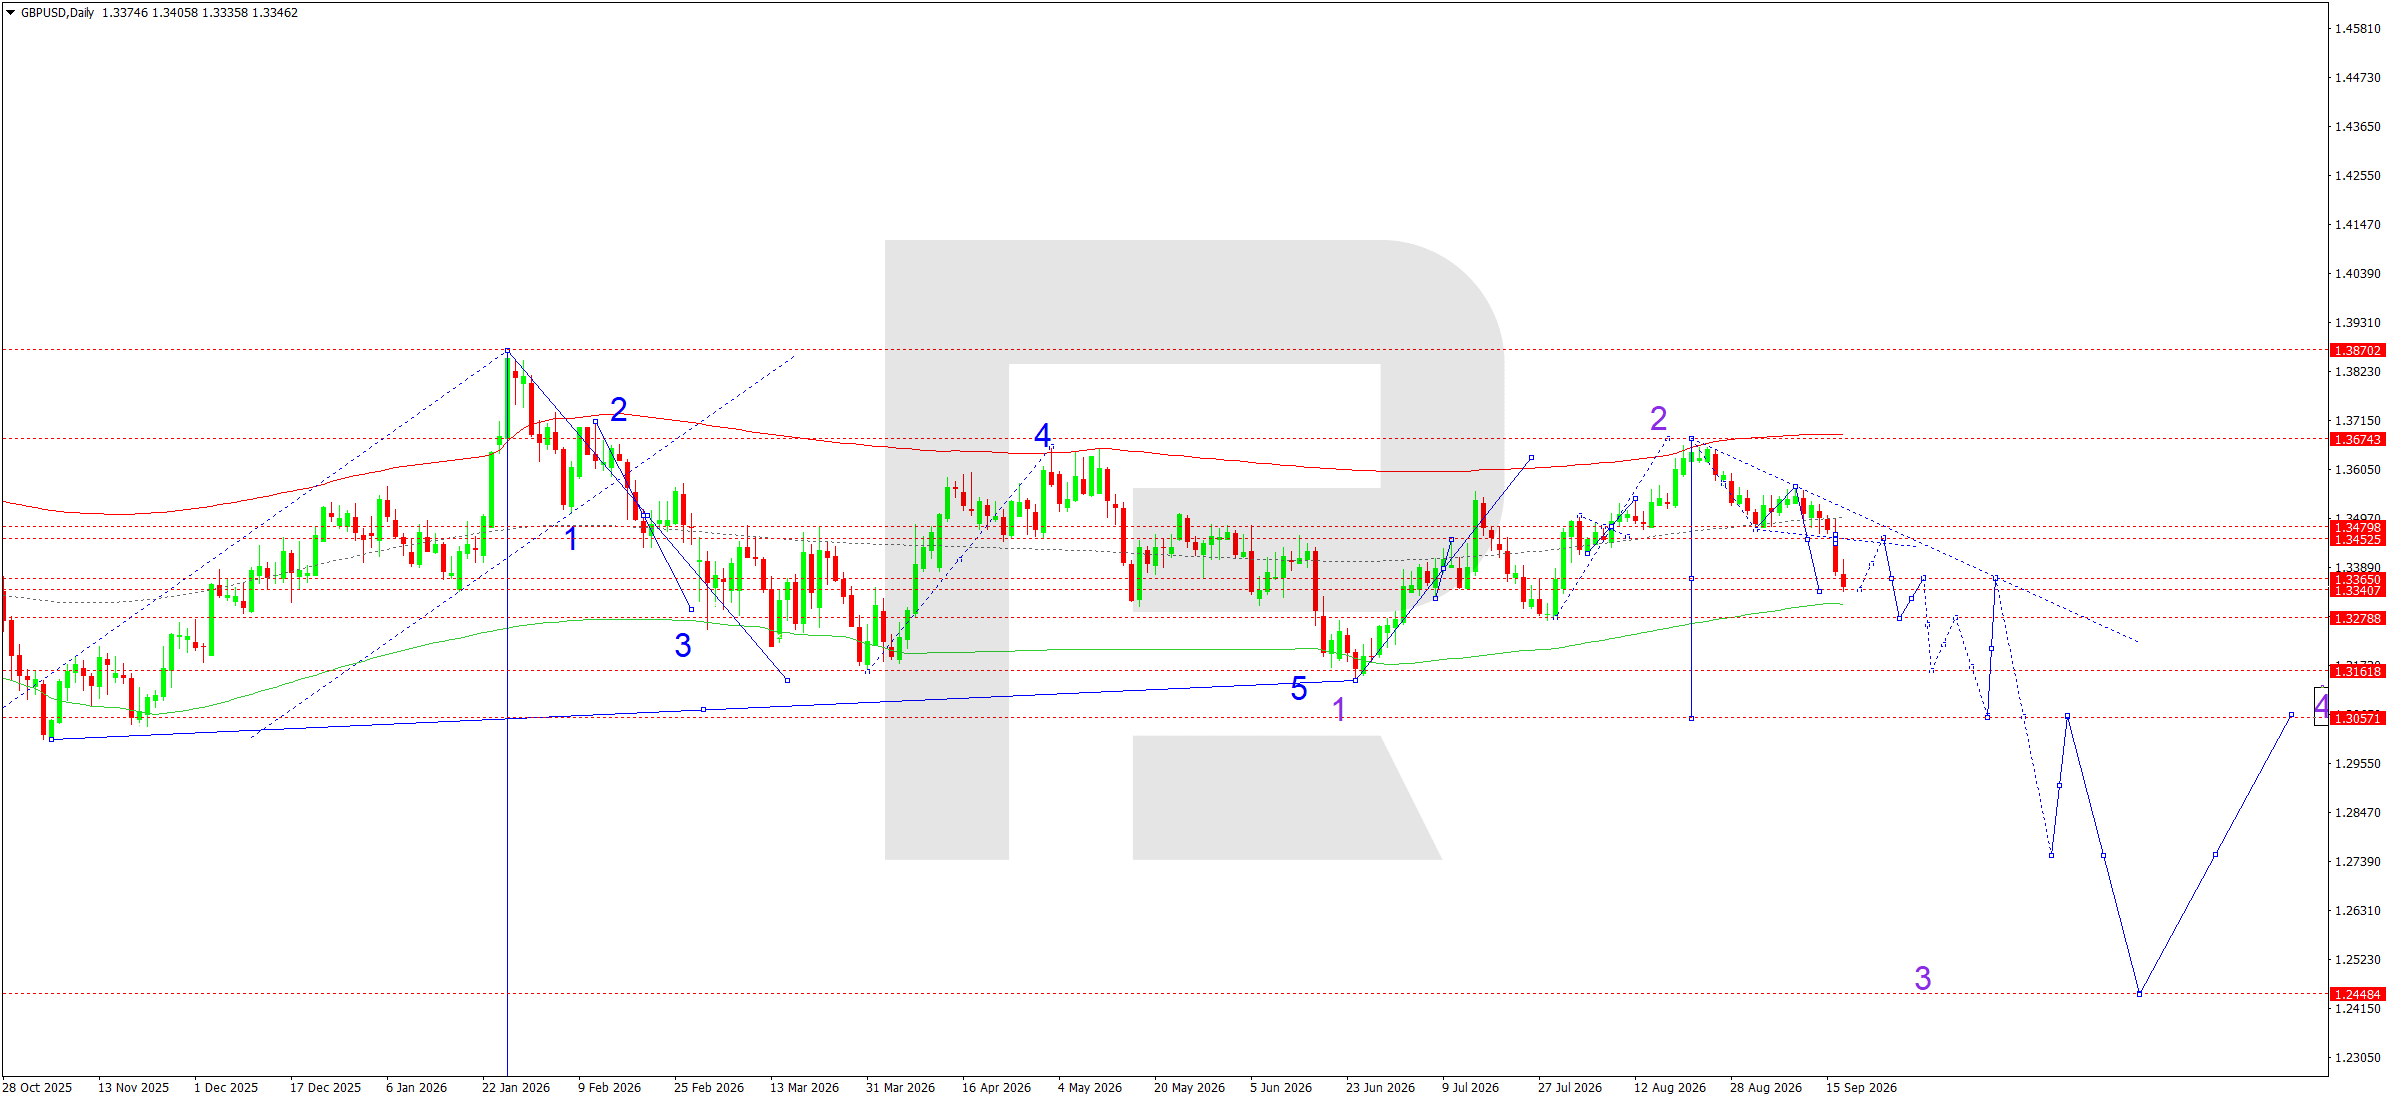
On the daily chart, the pair reached the previous downside target at 1.3475, then formed an upward impulse towards 1.3566 and a new downward leg to 1.3340. During the current week, the market is effectively forming consolidation around 1.3360. At the same time, the price remains below the descending resistance line, while the August high around 1.3674 remains the key point where corrective wave 2 was completed.
Within the current consolidation, the 1.3340–1.3360 area acts as intermediate support, but the series of lower highs and the price remaining below the descending channel preserve the sellers’ advantage on the daily timeframe. The main scenario assumes a continuation of the downward structure. The first target is 1.3278. A breakout below this support would confirm the development of the third wave lower and open the way towards 1.3162 and then 1.3057. The 1.3057 level is a local target at roughly half of the expected impulse. If selling pressure persists without a deep correction, the next medium-term target shifts towards 1.2448, marked on the chart as the completion of wave 3.
A corrective return towards 1.3415–1.3480 would not invalidate the bearish structure. Only a sustained consolidation above 1.3480 would weaken the scenario of a direct decline and allow 1.3566 to be considered again. Until then, selling on recoveries remains the priority, with close attention to the price reaction around 1.3278.
GBPUSD forecast scenario
Trading scenario: SELL
- Price at the time of writing: 1.3346
- Entry price: 1.3341
- Stop Loss: 1.3480
- Take Profit: 1.3057
- Risk-to-reward ratio: 1:2.0
The trade idea is valid until 8:00 on 28 September 2026 (server time, UTC+3).
AUDUSD forecast
The fundamental backdrop for AUDUSD at the start of the week remains mixed, but in the short term the US dollar retains the advantage. The Federal Reserve raised the target rate range by 0.25 percentage points to 3.75–4.00% on 16 September, pointing to persistently elevated inflation, resilient consumption, and a stable labour market. This move supported US bond yields and strengthened the US dollar, although part of the initial reaction was subsequently corrected. Another constraint for the Australian currency is deteriorating global risk appetite amid geopolitical tensions and high volatility in commodity markets. At the same time, the Fed allows for further tightening, so the divergence in rate expectations will be one of the pair’s main drivers in the coming days.
The Reserve Bank of Australia kept the rate unchanged at 4.35% in August after three increases in 2026, stressing that inflation remains too high. On 17 September, the International Monetary Fund also noted the possibility of further tightening, while the market significantly increased expectations of a rate hike at the 29 September meeting. This supports the AUD and could limit the depth of the pair’s decline. However, July unemployment rose to 4.5%, employment fell, and the August data release on 24 September will be an important event for the week. Weak figures could reduce expectations of a restrictive RBA stance.
China remains an additional risk factor: industrial production rose in August, but retail sales and property investment showed weakness, limiting demand for the Australian dollar. Therefore, the fundamental picture points to elevated volatility: strong Australian data could trigger an upward correction, but a resilient US dollar is likely to keep AUDUSD under pressure throughout the coming week.
AUDUSD technical analysis
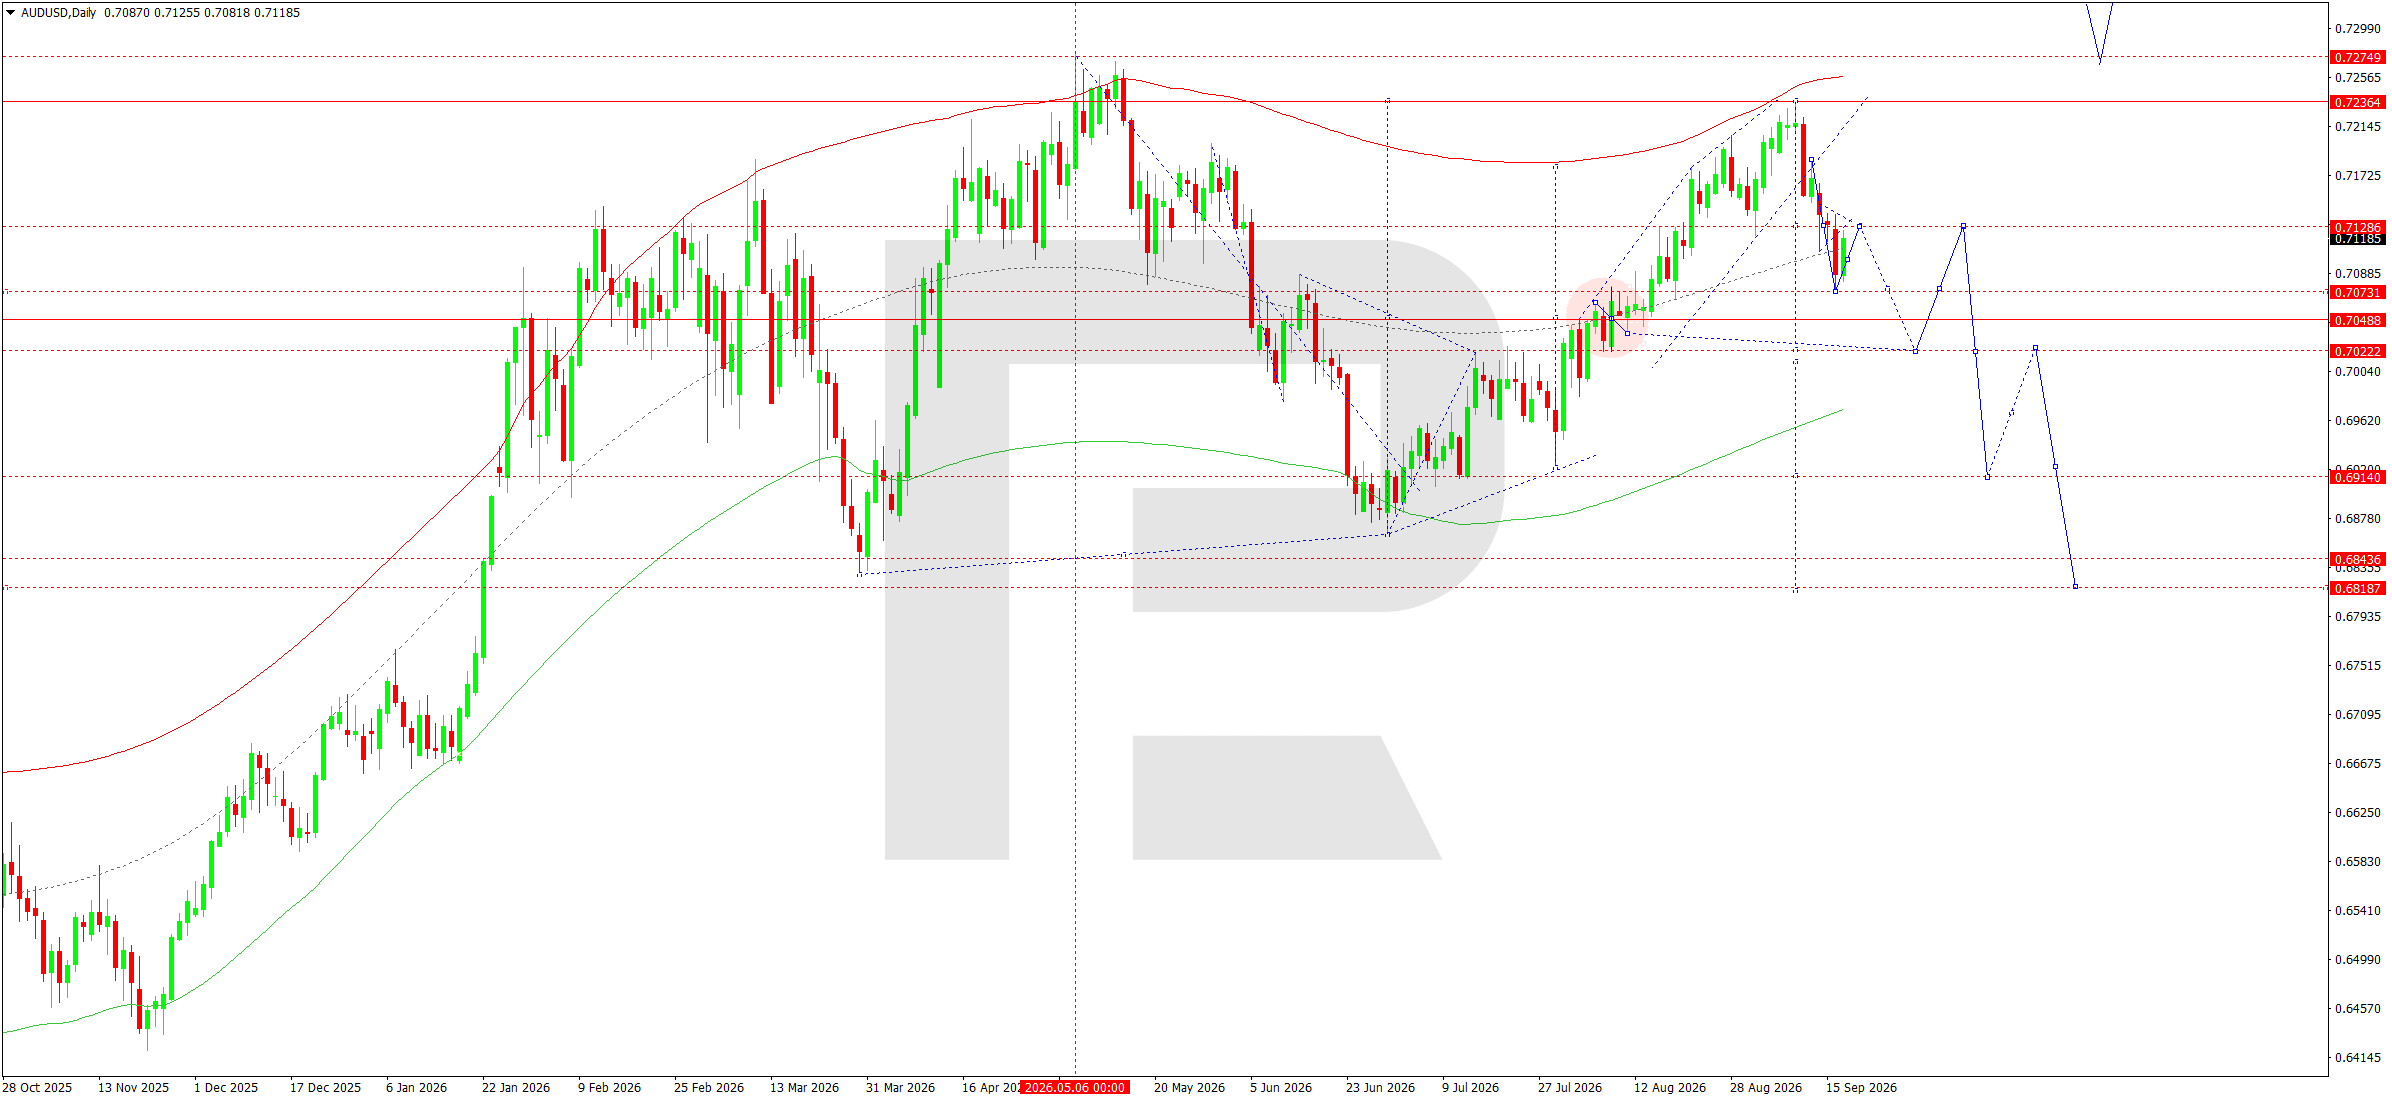
On the daily chart, AUDUSD formed a downward reversal after testing the 0.7236–0.7275 zone. The current downward wave has already reached the local target at 0.7073, followed by a recovery impulse towards 0.7125. In the near term, a consolidation range is likely to form around 0.7125, followed by a resumption of the decline.
The first target is 0.7022. If sellers consolidate below this level, the structure would open the way towards 0.6910. The price remaining below the upper boundary of the local descending channel also confirms that selling pressure persists.
After reaching 0.7022, a corrective return towards 0.7128 is possible, which could act as a retest of the broken area from below. The main daily trend would remain downward. Holding below 0.7128 supports the scenario of a continuation of the wave towards 0.6910 and then the 0.6844–0.6819 area. The alternative scenario would require a confident consolidation above 0.7236, which would temporarily invalidate the selling priority and return the market towards 0.7275.
AUDUSD forecast scenario
Trading scenario: SELL
- Price at the time of writing: 0.7119
- Entry price: 0.7114
- Stop Loss: 0.7140
- Take Profit: 0.7022
- Risk-to-reward ratio: 1:3.5
The trade idea is valid until 8:00 on 28 September 2026 (server time, UTC+3).
USDCAD forecast
The fundamental backdrop for USDCAD at the start of the week remains mixed, but in the short term the US dollar retains the advantage. The Federal Reserve raised the rate by 25 basis points on 16 September and stressed that inflation remains elevated. This increased the market’s sensitivity to US bond yields and supported the US dollar, although part of the move was corrected as early as 17 September following declines in yields and oil.
The Bank of Canada kept the rate unchanged on 2 September, while also noting rising inflation risks due to expensive energy and persistent uncertainty related to trade restrictions. In its published summary of deliberations, the BoC also noted that the Canadian economy remains in excess supply and that new tariffs could restrain consumer activity, investment, and hiring. This limits the scope for rapid policy tightening and increases the CAD’s dependence on the oil market.
Canadian inflation remained at 3.0% year-on-year in August, while excluding petrol, price growth accelerated to 2.4%. The labour market appears less resilient: employment fell by 0.2% in August, while unemployment remained at 6.4%. Oil remains another factor for the Canadian dollar: on 17 September, WTI prices fell by around 2% as concerns about supply disruptions eased. During the week of 21–25 September, attention will shift to Canadian retail sales for July, due on 24 September. The combination of a more restrictive Fed, softer signs in Canada’s labour market, and unstable oil prices preserves fundamental support for USDCAD.
USDCAD technical analysis
On the daily chart, after upward wave 3 was completed around 1.4248, a higher-order corrective structure began to develop, while within it a local upward impulse formed from the 1.3760 area. The current price around 1.3978 has approached the 1.4000–1.4009 zone, where consolidation is likely to form. The main working scenario assumes an initial correction towards 1.3885, which would act as a test from above of the previously broken area, followed by a recovery towards 1.4009.
Consolidation above 1.4009 would open the way towards the main local target at 1.4039. A return below 1.3943 would confirm the development of the expected intermediate pullback, but holding 1.3885 would preserve the bullish weekly scenario. At the same time, the broader structure remains corrective relative to the wave 3 high, so once the local rise is complete, the risk of another decline towards 1.3885 and then 1.3760 would increase.
For the current week, the priority remains the development of a continuation pattern in the local upward movement after the intermediate pullback. The reaction around 1.3885 remains key.
Forecast scenario for the week: a decline towards 1.3885, followed by a recovery towards 1.4009–1.4039.
USDCAD forecast scenario
Trading scenario: SELL
- Price at the time of writing: 1.3978
- Entry price: 1.3973
- Stop Loss: 1.4012
- Take Profit: 1.3885
- Risk-to-reward ratio: 1:2.26
The trade idea is valid until 8:00 on 28 September 2026 (server time, UTC+3).
XAUUSD forecast
At the start of the new week, gold is coming off a sharp rise in volatility triggered by the Federal Reserve’s decision. On 16 September, the Fed raised the rate by 25 basis points to a range of 3.75–4.00%, while updated projections showed that most policymakers allow for another increase before the end of the year. This signal supports US bond yields and limits gold’s upside potential by increasing the opportunity cost of holding the metal.
At the same time, the fundamental backdrop remains mixed. After the initial reaction to the Fed decision, the US dollar corrected and the yield on 10-year Treasuries declined, allowing gold to recover by more than 2% from a six-week low. US inflation remains elevated: the August Consumer Price Index rose by 3.4% year-on-year, while strong retail sales and a fall in initial jobless claims to 196,000 confirm the resilience of the economy. This keeps the possibility of further Fed tightening in place.
During the week of 21–25 September, the market will focus on jobless claims, new home sales, durable goods orders, and the final University of Michigan consumer sentiment index. Geopolitical demand for safe-haven assets may continue to support gold, while a stronger US dollar and rising yields would work in the opposite direction.
XAUUSD technical analysis
On the daily XAUUSD chart, after the previous downward wave ended in the 4,233 area, an upward impulse formed towards 4,373. The subsequent movement shifted into consolidation, but the structure remains part of corrective wave 2 after the completion of upward wave 1 around 4,696. The current price is holding around 4,364, where an important pivot and local equilibrium area is located.
From a technical perspective, another argument in favour of a correction is the rebound from the descending resistance line connecting the April high of wave 4 and the August high of wave 1. The price also remains below the slow moving average around 4,630, while the middle line of the structure is located near current levels. This keeps the probability of another test of the lower boundary of the local range elevated before an upward reversal during the week.
The main scenario for the week assumes a continuation of the decline. The first target is 4,307, while the main target of the wave remains the 4,216 area, almost coinciding with the indicated scenario level of 4,214. A breakout below 4,307 would increase selling pressure and confirm the development of the downward leg. Once the 4,216 area is reached, a base for a corrective rise towards 4,456 is expected to form. The nearest resistance zone is around 4,379; consolidation above it would temporarily weaken the bearish scenario, although a full invalidation of the correction would require a return above 4,456.
XAUUSD forecast scenario
Trading scenario: SELL
- Price at the time of writing: 4,364
- Entry price: 4,359
- Stop Loss: 4,456
- Take Profit: 4,216
- Risk-to-reward ratio: 1:1.47
The trade idea is valid until 8:00 on 28 September 2026 (server time, UTC+3).
US 500 forecast
At the start of the new week, the US market is entering a period following a sharp reassessment of interest-rate expectations. On 16 September, the Federal Reserve raised the target rate range by 25 basis points to 3.75–4.00%, highlighting resilient economic activity and persistent inflationary pressure. Updated projections imply a rate of around 4.10% by the end of 2026 and PCE inflation of 3.70%, preserving the risk of further monetary tightening. For the stock market, this means a higher cost of capital and greater sensitivity in the technology sector to Treasury yields. Federal Reserve
Inflation remains an additional factor: the August CPI rose by 3.40% year-on-year, while initial jobless claims fell to 196,000, confirming the resilience of the labour market. This combination allows the Fed to maintain a restrictive tone. At the same time, on 17 September lower oil prices and a decline in 10-year Treasury yields supported an S&P 500 recovery of around 1%. However, oil remains above 100 USD per barrel due to geopolitical tensions, so the risk of renewed price pressure has not disappeared. Higher energy costs could weaken corporate margins and restore pressure on long-term bonds.
During the week of 21–25 September, the calendar of key US statistics is relatively light, so the main drivers will remain bond dynamics, oil, the geopolitical backdrop, and comments from Fed officials. Lower yields could support the index, while a return of the 10-year yield above 5% would increase pressure on growth stocks. Overall, the fundamental backdrop remains mixed: economic resilience supports corporate expectations, but the high cost of money limits the scope for valuation multiples to expand. Volatility is likely to remain elevated throughout the week.
US 500 technical analysis
On the daily chart, the medium-term upward structure remains intact, but after the August high a corrective downward wave is developing within a descending channel. The index previously reached a local target around 7,511 and then formed a recovery impulse towards resistance at 7,645.
The current price of 7,642 is directly below this area, so consolidation with repeated attempts to test the level from above to below is likely at the start of the week.
The main weekly scenario remains a continuation of the correction. Holding below 7,645 creates conditions for a decline towards 7,511, the intermediate level at 7,489, and then the local target at 7,474. The 7,474–7,408 area coincides with the lower part of the projected channel and could complete the current downward wave. In the wave structure, this would allow the final corrective impulse to form after the failed attempt to recover towards the upper boundary of the channel.
After a reversal daily candle appears and the price returns above 7,511, a corrective recovery towards 7,615 is expected. A return and confident consolidation above 7,645 would weaken the bearish scenario and open the way towards 7,818.
US 500 forecast scenario
Trading scenario: SELL
- Price at the time of writing: 7,642
- Entry price: 7,637
- Stop Loss: 7,670
- Take Profit: 7,474
- Risk-to-reward ratio: 1:4.94
The trade idea is valid until 8:00 on 28 September 2026 (server time, UTC+3).
BTCUSD forecast
The fundamental backdrop for Bitcoin in the coming week remains tense. The Federal Reserve raised the rate by 25 basis points on 16 September to a range of 3.75–4.00% and indicated that further policy tightening remains possible if inflation stays persistent. For cryptocurrencies, this means continued pressure through the high cost of US dollar liquidity and elevated Treasury yields. Following the Fed decision, the US 10-year yield retreated below 5%, while the US dollar partially corrected its gains, temporarily easing pressure on risk assets.
Strong labour-market data support a restrictive backdrop: initial jobless claims fell to 196,000, while unemployment remained at 4.1% in August. This reduces the need for rapid policy easing. Therefore, rising yields could trigger profit-taking in Bitcoin, while lower yields would support a corrective recovery.
Another source of uncertainty was the US Senate vote on the Clarity Act: the bill, intended to establish comprehensive rules for the digital-asset market, failed to receive sufficient support to advance. This worsened the regulatory backdrop and increased short-term Bitcoin volatility.
At the same time, institutional interest remains in place: the recovery from the August lows was accompanied by renewed demand through exchange-traded crypto products. During the week of 21–25 September, the main drivers will remain US yield dynamics, the US dollar, expectations for the Fed’s next move, and overall investor risk appetite. Reuters
BTCUSD technical analysis
On the daily BTCUSD chart, after the downward impulse the market formed a low around 75,000 and corrected towards 77,150. The current structure indicates that the market is moving into consolidation below this area. While the price remains below 77,150, the base case is a continuation of the downward leg. The nearest support is at 76,052; a confident breakout below it could open the way towards the local target at 72,700.
From a technical perspective, the price reaction at the lower boundary of the range is important. While daily candles continue to form around 76,052, the market retains a chance to retest 77,150, but failure to consolidate above this level would confirm buyers’ weakness. A breakout below 72,700 would strengthen the medium-term bearish structure and shift attention towards 70,250.
The main trend in the short-term structure is assessed as downward, despite the broader ascending channel from the August lows remaining intact. The 79,068 level is the nearest significant resistance. A return above it would weaken sellers and create conditions for a recovery towards 82,126. However, consolidation below 76,052 could intensify pressure, and after a test of 72,700 the next main target would be 70,250. This sequence corresponds to the trajectory shown on the chart: consolidation, a local correction, and a further decline.
BTCUSD forecast scenario
Trading scenario: SELL
- Price at the time of writing: 76,561
- Entry price: 76,556
- Stop Loss: 79,150
- Take Profit: 72,700
- Risk-to-reward ratio: 1:1.49
The trade idea is valid until 8:00 on 28 September 2026 (server time, UTC+3).
Editors’ picks
 EURUSD forecast 2026–2027: technical analysis, price levels & predictions
The EURUSD outlook for 2026 and 2027: key levels on the daily chart, three trading scenarios and the policy gap between the Fed and the ECB that drives the pair.
 Gold (XAUUSD) forecast 2026: technical analysis, price levels & predictions
Where gold could trade in 2026: key levels, three trading scenarios with entry triggers and the forecasts from J.P. Morgan, Deutsche Bank and Goldman Sachs.
Forecasts presented in this section only reflect the author’s private opinion and should not be considered as guidance for trading. RoboForex bears no responsibility for trading results based on trading recommendations described in these analytical reviews.