
Weekly Forex forecast for 26–30 October 2026: key levels for currencies, gold, US 500, and Bitcoin
The weekly forecast for 26–30 October 2026 includes five sell scenarios and three buy scenarios for eight instruments.
Table of Contents (H2)
Key levels for the week
| Instrument | Week | Support | Resistance | Scenario |
|---|---|---|---|---|
| EURUSD | −1.40% | 1.1117 | 1.1270 | Sell from 1.1194 |
| USDJPY | −0.58% | 156.15 | 157.69 | Sell from 157.01 |
| GBPUSD | −2.49% | 1.3239 | 1.3568 | Sell from 1.3394 |
| AUDUSD | −2.20% | 0.6940 | 0.7034 | Sell from 0.6998 |
| USDCAD | +1.74% | 1.4014 | 1.4161 | Buy from 1.4041 |
| XAUUSD | −4.29% | 3,904 | 4,145 | Sell from 4,079 |
| US 500 | +2.68% | 7,629 | 7,762 | Buy from 7,695 |
| BTCUSD | +7.17% | 79,621 | 84,902 | Buy from 81,802 |
What moves markets this week
Investors are focused on US Federal Reserve monetary policy, expectations surrounding decisions by leading central banks and movements in the US dollar. Economic data, government bond yields and corporate earnings will be particularly important. Geopolitical risks and changes in investors' risk appetite will also affect the currency market, gold, equity indices and Bitcoin. The coming week could prove decisive for the development of current price trends.
Events that can move markets this week
| Day | Event | Why it matters |
|---|---|---|
| Monday, 26 October 2026 | German business climate (Ifo) | An assessment of Germany's economic outlook could affect EURUSD. |
| Tuesday, 27 October 2026 | US durable goods orders and consumer confidence | These will indicate the state of US demand. They are important for the USD, gold and US 500. |
| Wednesday, 28 October 2026 | Interest rate decisions by the US Federal Reserve and Bank of Canada | One of the key days of the week. Increased volatility is possible in EURUSD, USDJPY, USDCAD, XAUUSD, US 500 and BTCUSD. |
| Thursday, 29 October 2026 | ECB decision, US GDP and PCE inflation | The combination of monetary policy decisions and key economic data could change the direction of the dollar, euro, gold and stock indices. |
| Friday, 30 October 2026 | Bank of Japan decision and eurozone GDP | These will shape expectations for the yen and euro, particularly affecting USDJPY and EURUSD. |
EURUSD forecast
EURUSD fundamental analysis
Over the coming week, EURUSD movements will be driven by expectations surrounding decisions by the US Federal Reserve (Fed) and the European Central Bank (ECB). Their policy meetings are scheduled for 28 and 29 October, respectively. Persistent inflation risks limit the scope for monetary policy easing, sustaining volatility in the dollar and euro.
Preliminary eurozone PMI readings showed a slowdown in business activity. The composite index fell from 53.1 to 51.9 points, reflecting weaker economic growth. Rising energy costs and political uncertainty in France are adding pressure. The German economy continues to expand, although its growth rate is also slowing.
Higher oil prices are increasing inflation risks for the European economy. Meanwhile, resilient US economic indicators could support US Treasury yields and demand for the dollar. The key factor next week will be the assessment of the future path of Fed and ECB interest rates.
EURUSD technical analysis
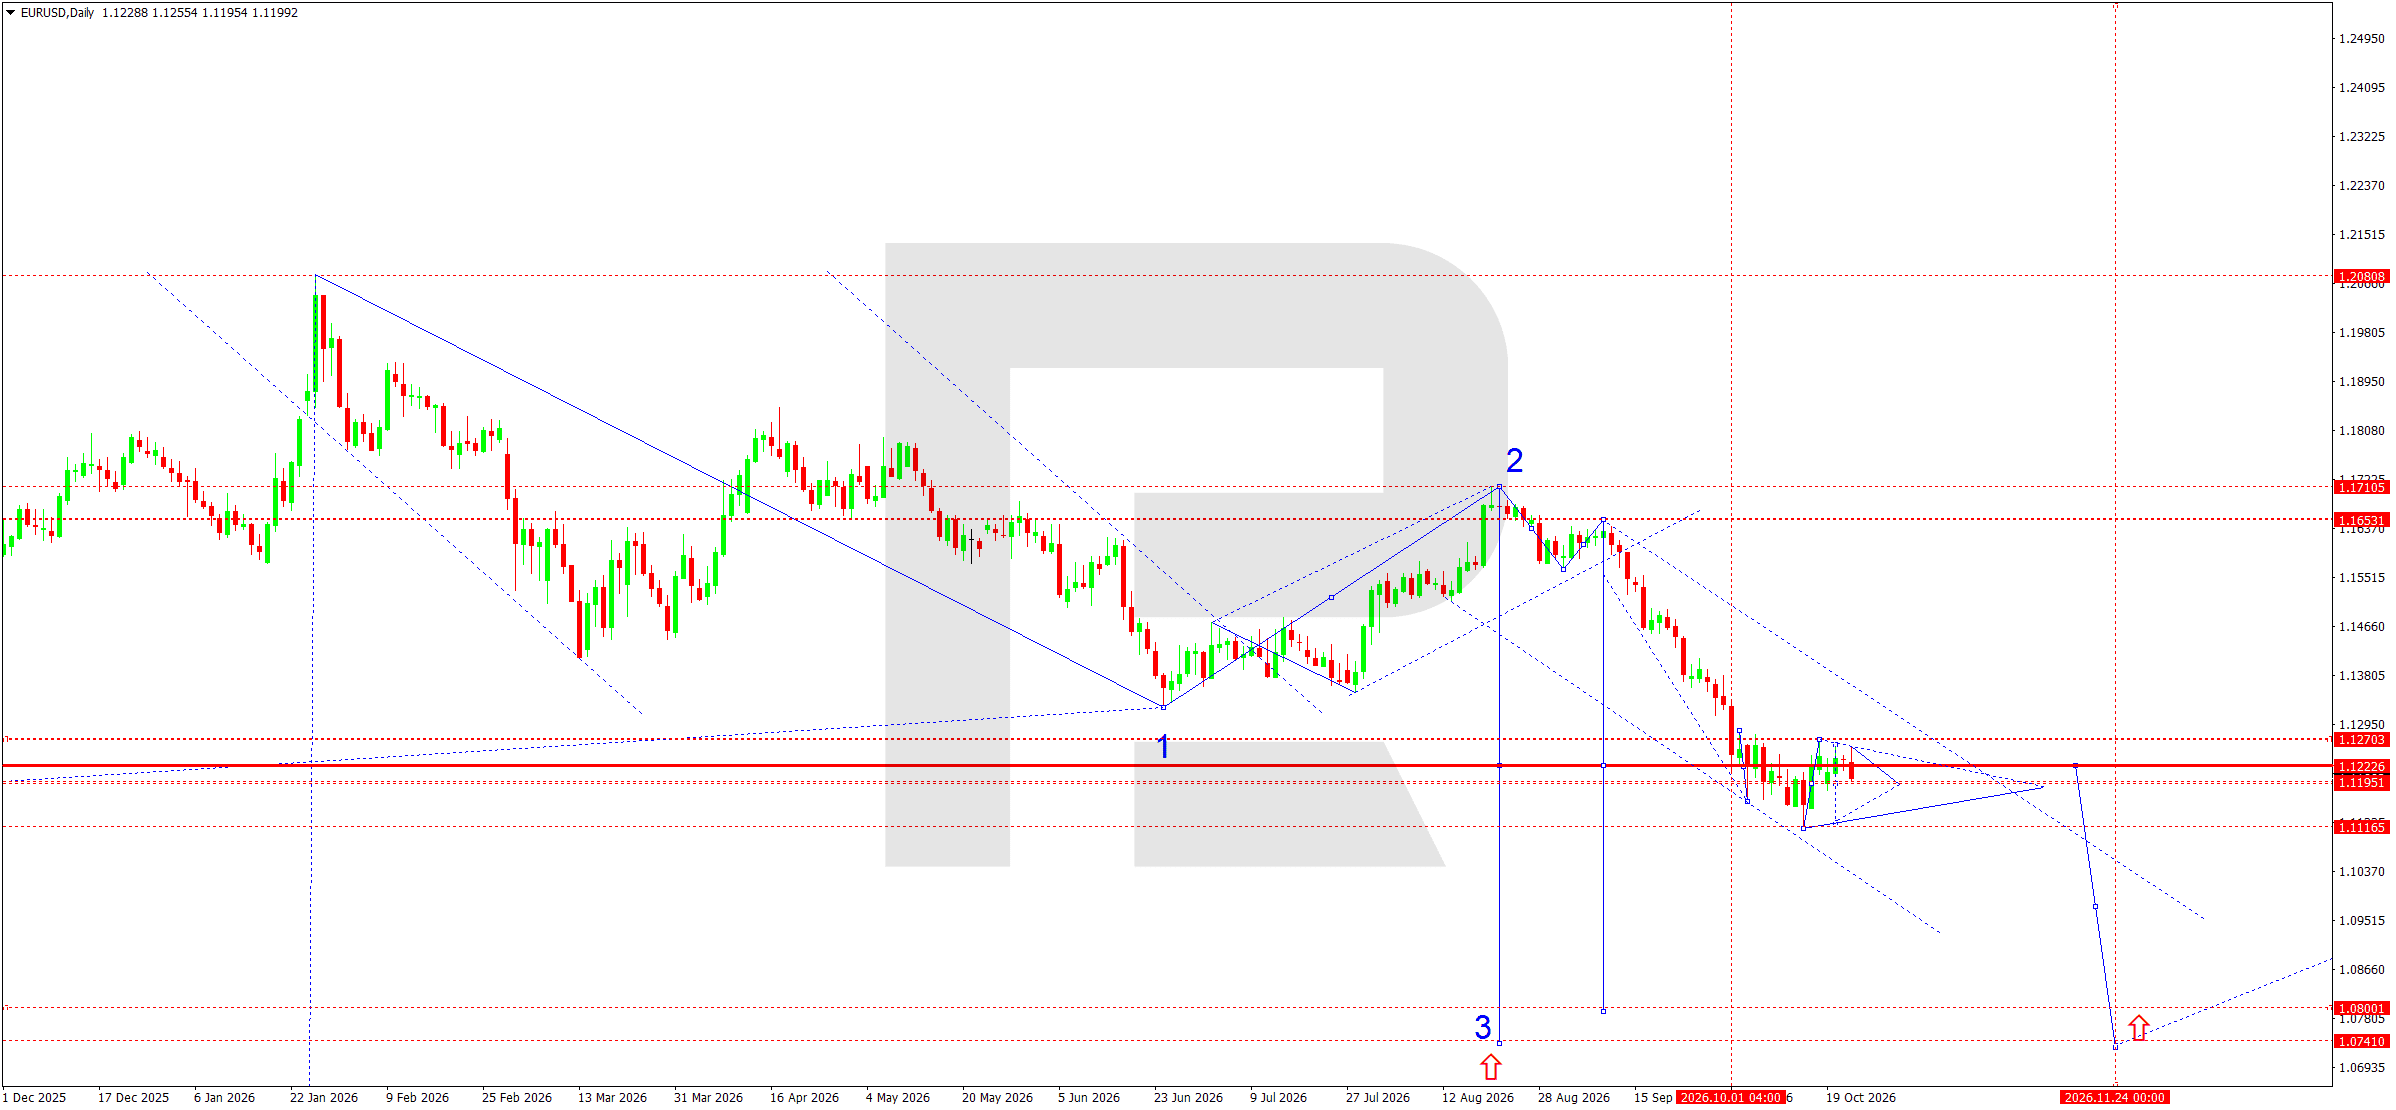
The daily EURUSD chart continues to show a pronounced downtrend. Following the formation of a second corrective wave near 1.1711, the market began developing a third downward wave, reaching the interim area of 1.1195.
A narrow consolidation range is currently forming around 1.1222. The structure represents a corrective pause within the main downward impulse. A break below the lower boundary of the range would confirm the continuation of the third wave towards a projected target of 1.0737.
Interim pauses are likely around 1.1117, 1.1037, 1.0963, 1.0922 and 1.0800. Brief consolidations may occur at these levels without a substantial recovery in prices.
EURUSD trade scenario
The main scenario envisages further declines with limited upward corrections. Consolidation above 1.1270 would temporarily ease selling pressure but would not alter the broader bearish structure. If the third wave develops, the next prospective target will be the 1.0370 area. Selling remains the priority following confirmation of a breakout from the current range.
USDJPY forecast
USDJPY fundamental analysis
Over the coming week, USDJPY will be driven by expectations regarding the future monetary policies of the US Federal Reserve (Fed) and the Bank of Japan (BoJ). The interest rate differential between the two economies will remain the main factor, continuing to influence the appeal of dollar-denominated assets and demand for the Japanese yen.
Market participants will focus particularly on upcoming central bank decisions, assessments of inflation risks and economic growth prospects. Changes in US Treasury yields will be important for the dollar. Rising yields could support USDJPY, whereas falling yields would create conditions for yen appreciation.
Conditions in the Japanese debt market will be another factor. Changes in Japanese government bond yields and expectations regarding further BoJ policy normalisation may increase volatility. The risk of sharp moves also persists amid possible comments from Japanese financial authorities about the exchange rate.
As of 23 October, the yen is receiving support from lower US bond yields and investor caution. The Fed meeting on 27–28 October and the BoJ meeting on 29–30 October could determine the pair's direction through the end of the week.
USDJPY technical analysis
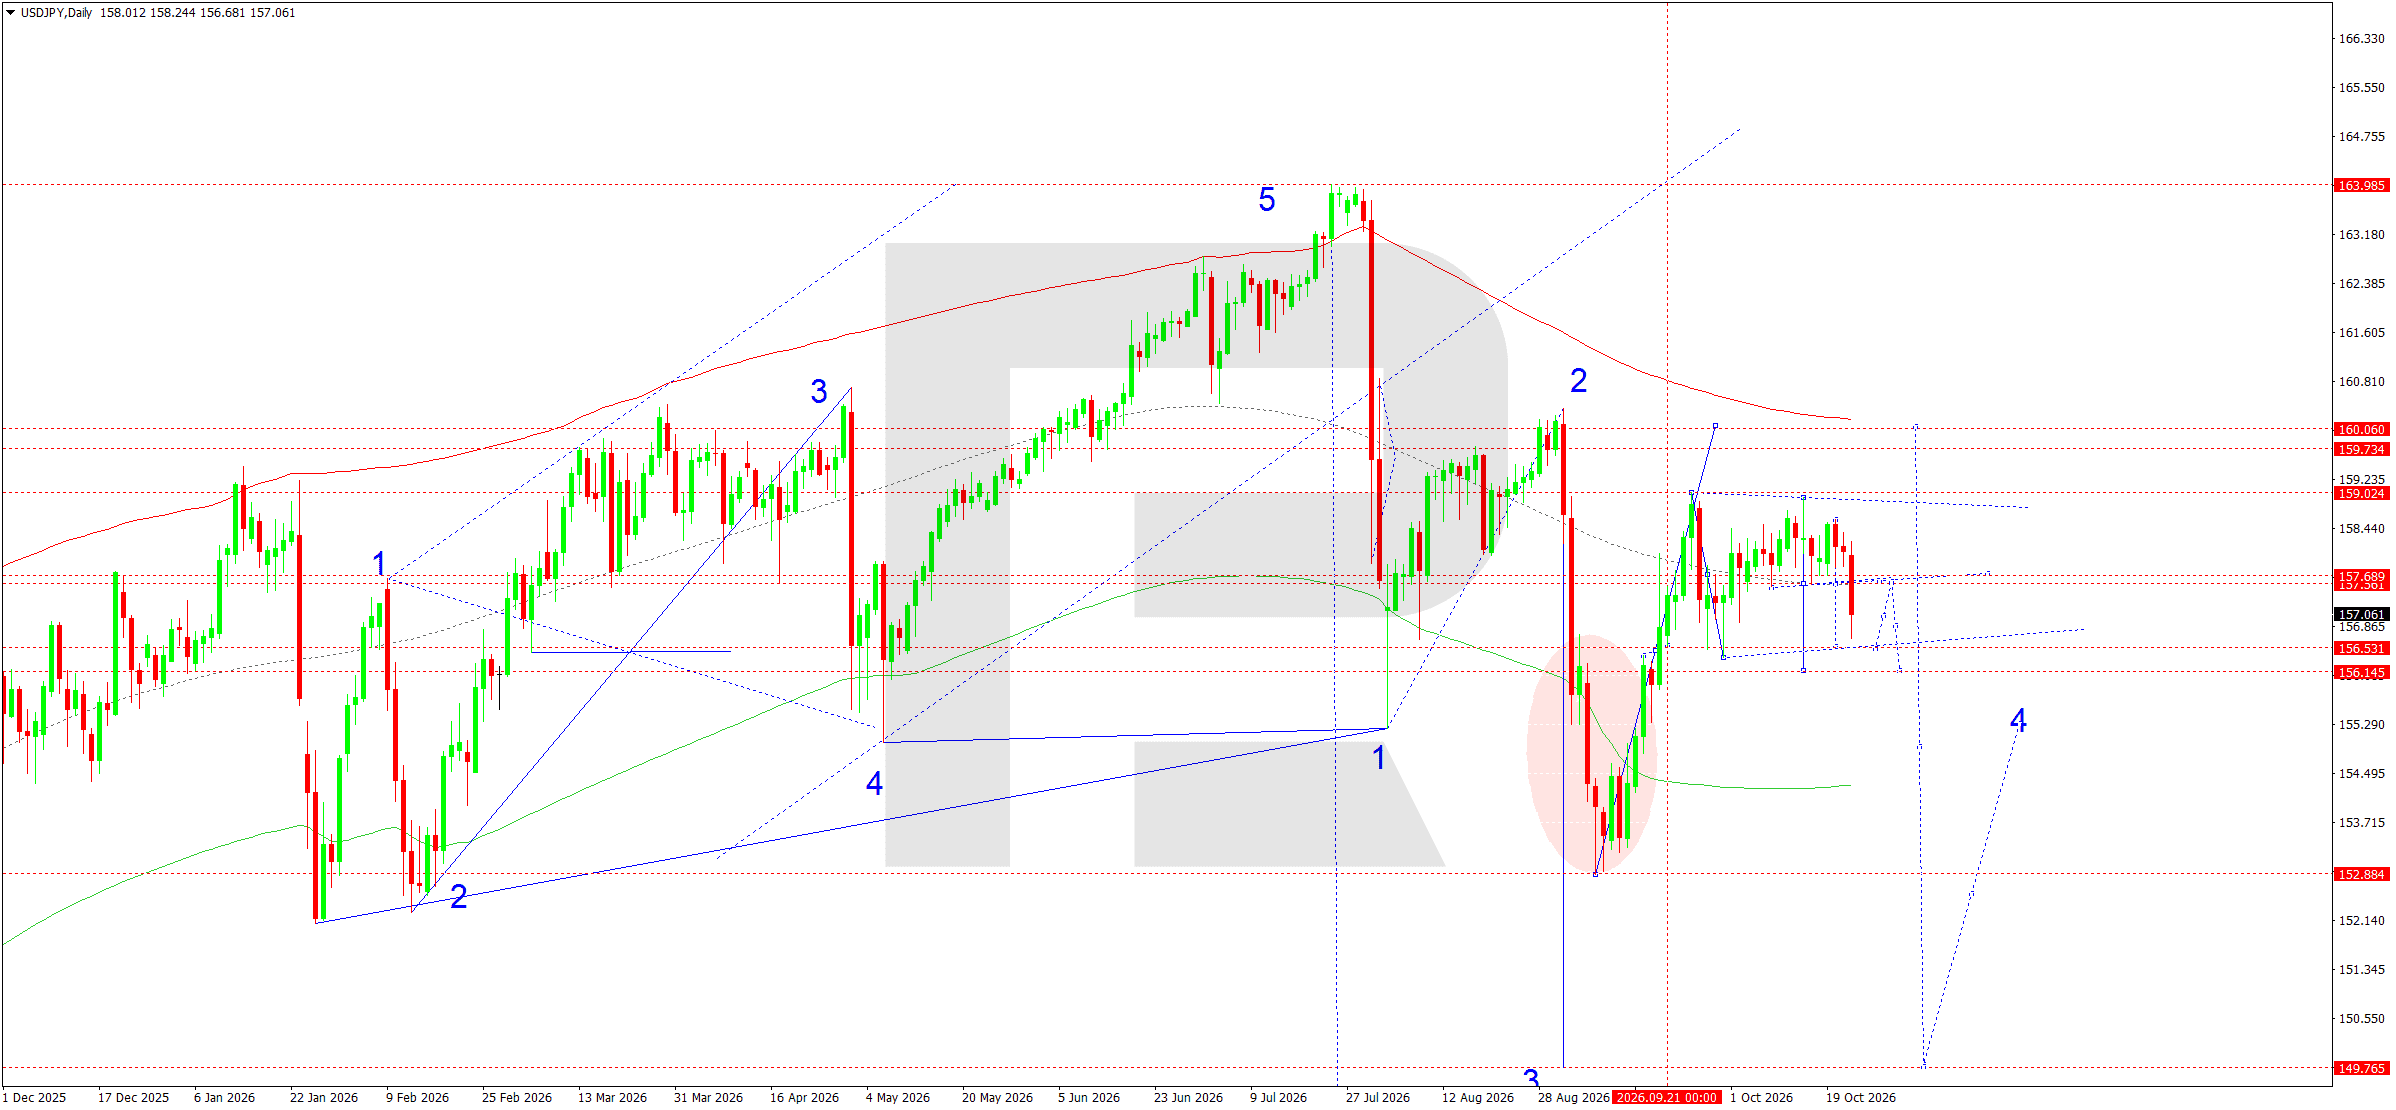
On the daily USDJPY chart, consolidation is forming around 157.70 following the completion of an upward five-wave structure and a subsequent corrective decline. The main short-term trend remains downward despite a recovery from September's low.
Within the wave model, a continued decline towards support at 156.53 remains the relevant scenario. After this area is reached, an upward corrective leg towards 157.80 is possible. However, failure to consolidate above that resistance would create conditions for a renewed decline towards 156.15.
Subsequently, a successful completion of the corrective structure could allow a recovery towards 159.02 and 160.06. The bullish scenario would require a sustained move above 157.80. Until then, sellers retain the advantage.
USDJPY trade scenario
GBPUSD forecast
GBPUSD fundamental analysis
The British pound is ending the current week stronger against the US dollar, although the fundamental backdrop remains mixed. Published UK inflation data showed annual consumer price growth accelerating to 3.5%, reinforcing expectations of a Bank of England (BoE) interest rate increase at its November meeting.
Sterling is also supported by declining US Treasury yields and diminishing expectations of further tightening by the US Federal Reserve (Fed).
Meanwhile, the British economy is showing signs of slowing consumer activity. Retail sales declined by 0.4% in September, significantly underperforming forecasts. At the same time, the preliminary PMI indicates that economic growth is continuing. Over the coming week, investors will focus on the monetary policy outlook, US dollar movements and geopolitical risks. High energy prices are sustaining inflationary pressures, limiting central banks' room for manoeuvre.
GBPUSD technical analysis
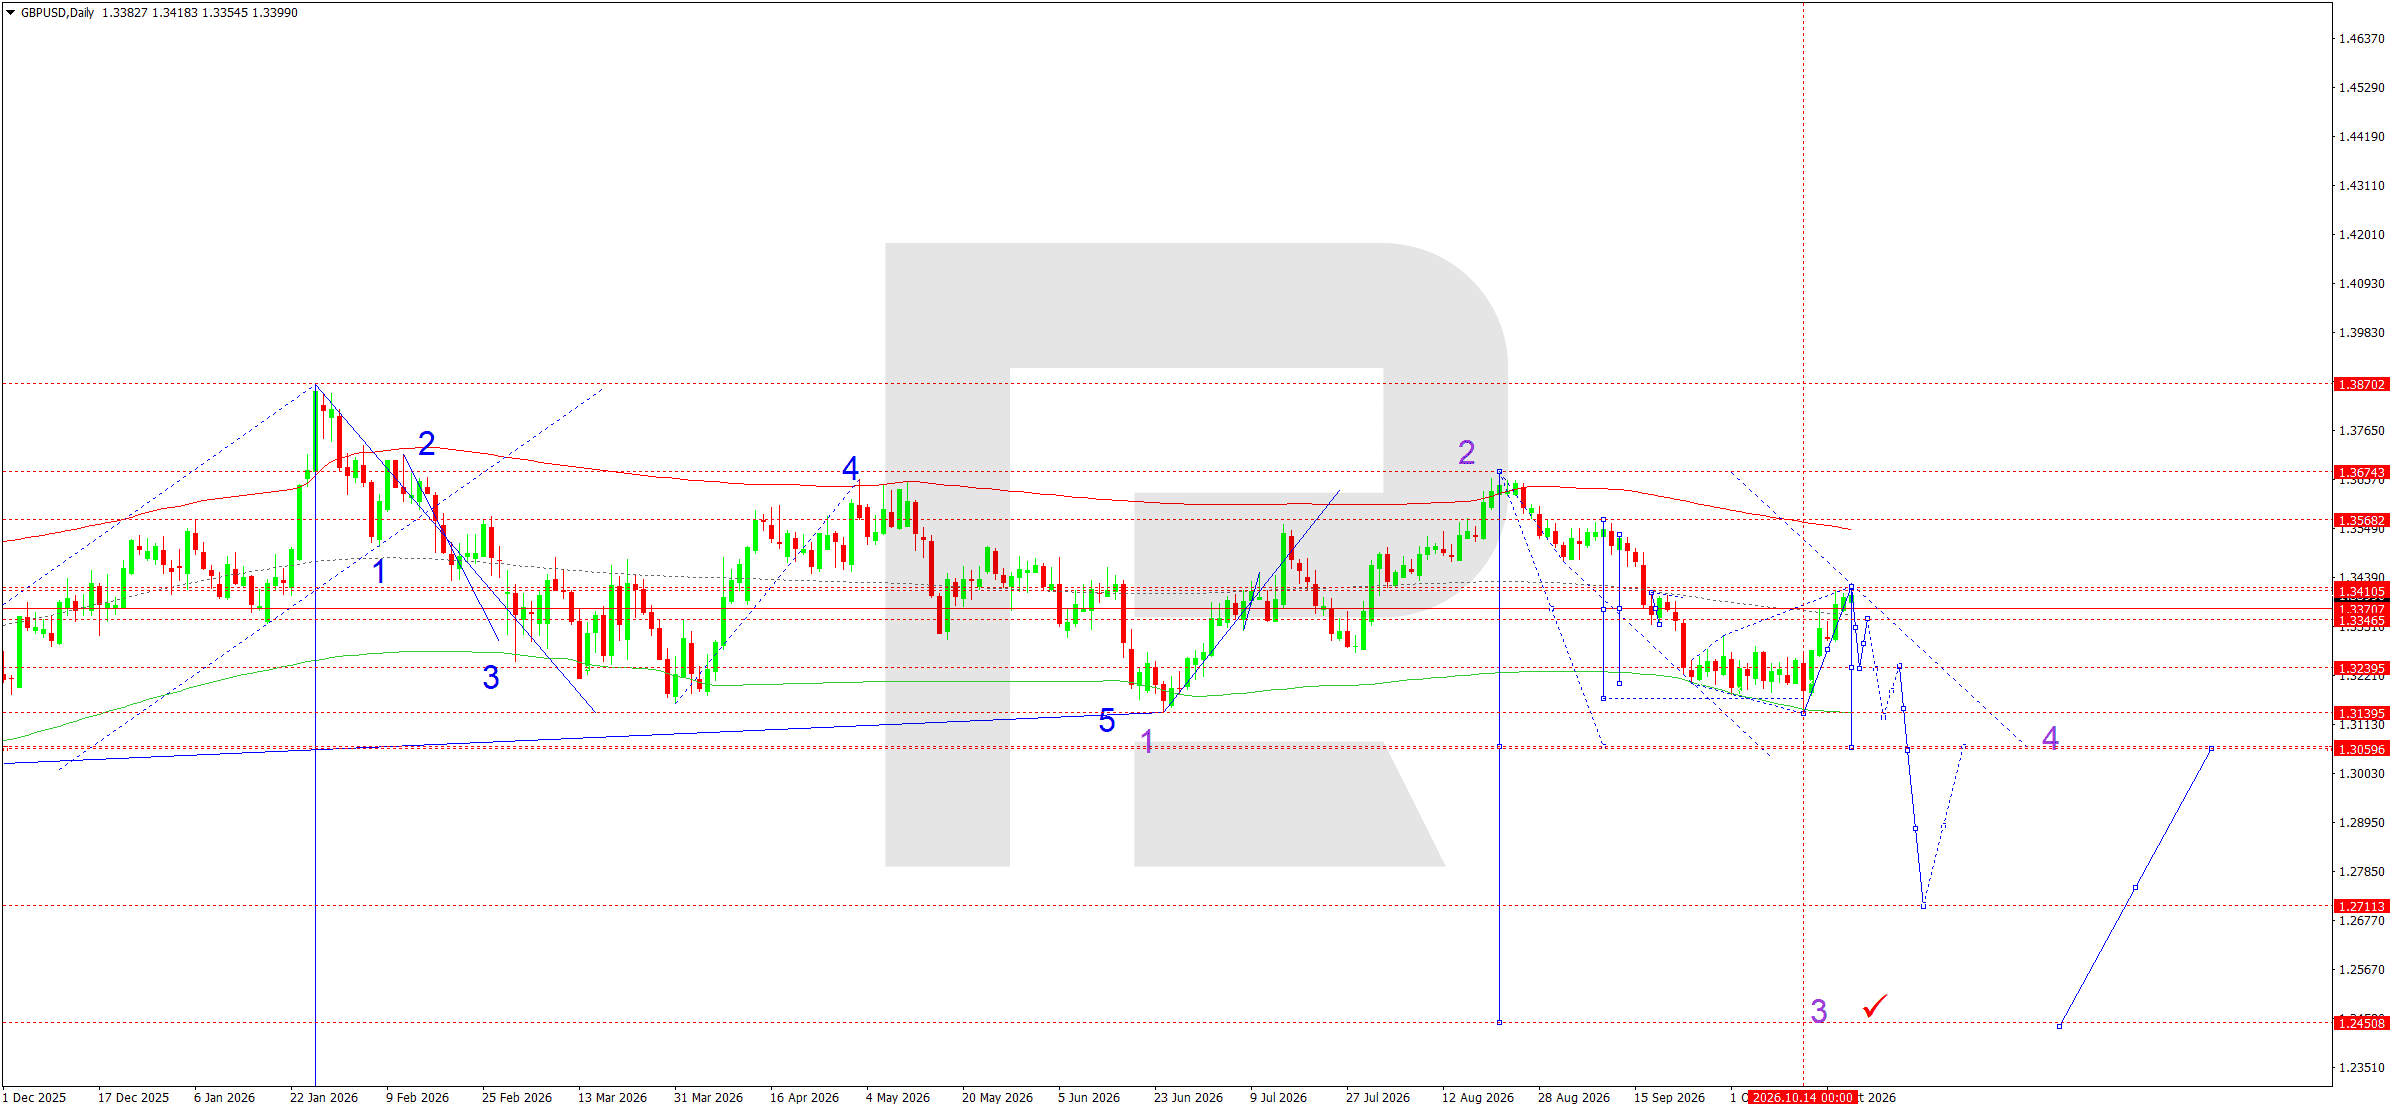
The technical picture on the daily chart suggests that the downward wave structure remains intact despite a corrective recovery in prices. The pair formed a pivot point around 1.3370 before making a downward impulse towards 1.3140. The subsequent recovery is regarded as a corrective phase within the main downward move.
A consolidation range is expected to form below 1.3370 over the coming week, followed by renewed selling.
The initial target is the 1.3060 area, where the move may temporarily slow. A break below this support would create conditions for the third downward wave to continue towards 1.2711.
Consolidation below 1.2711 would confirm the development of a larger bearish impulse, with a local target of 1.2450. If selling pressure intensifies, an accelerated move towards 1.2260 remains possible without substantial interim corrections.
The alternative scenario envisages consolidation above 1.3410, temporarily weakening bearish expectations and opening the way for a recovery towards 1.3568. Selling after the current correction ends remains the main priority.
GBPUSD trade scenario
AUDUSD forecast
AUDUSD fundamental analysis
The Australian dollar is ending the trading week against a mixed fundamental backdrop. The Reserve Bank of Australia (RBA) is maintaining a restrictive monetary policy stance as inflation risks remain elevated. RBA Deputy Governor Andrew Hauser noted a deterioration in the inflation outlook, reinforcing expectations of another interest rate increase. However, Australia's October PMI fell to 47.7 points from 51.3 previously, signalling a contraction in economic activity.
Geopolitical uncertainty, high energy prices and investor caution towards risk assets are adding pressure. The US Federal Reserve (Fed) is preparing for another meeting, meaning that US dollar movements will depend on policymakers' comments and expectations regarding further interest rate changes.
The key events next week will be the release of Australian inflation data and the Fed decision. Persistent inflationary pressures could support the Australian currency, although a strong dollar and weaker global risk appetite preserve the possibility of further AUDUSD depreciation.
AUDUSD technical analysis
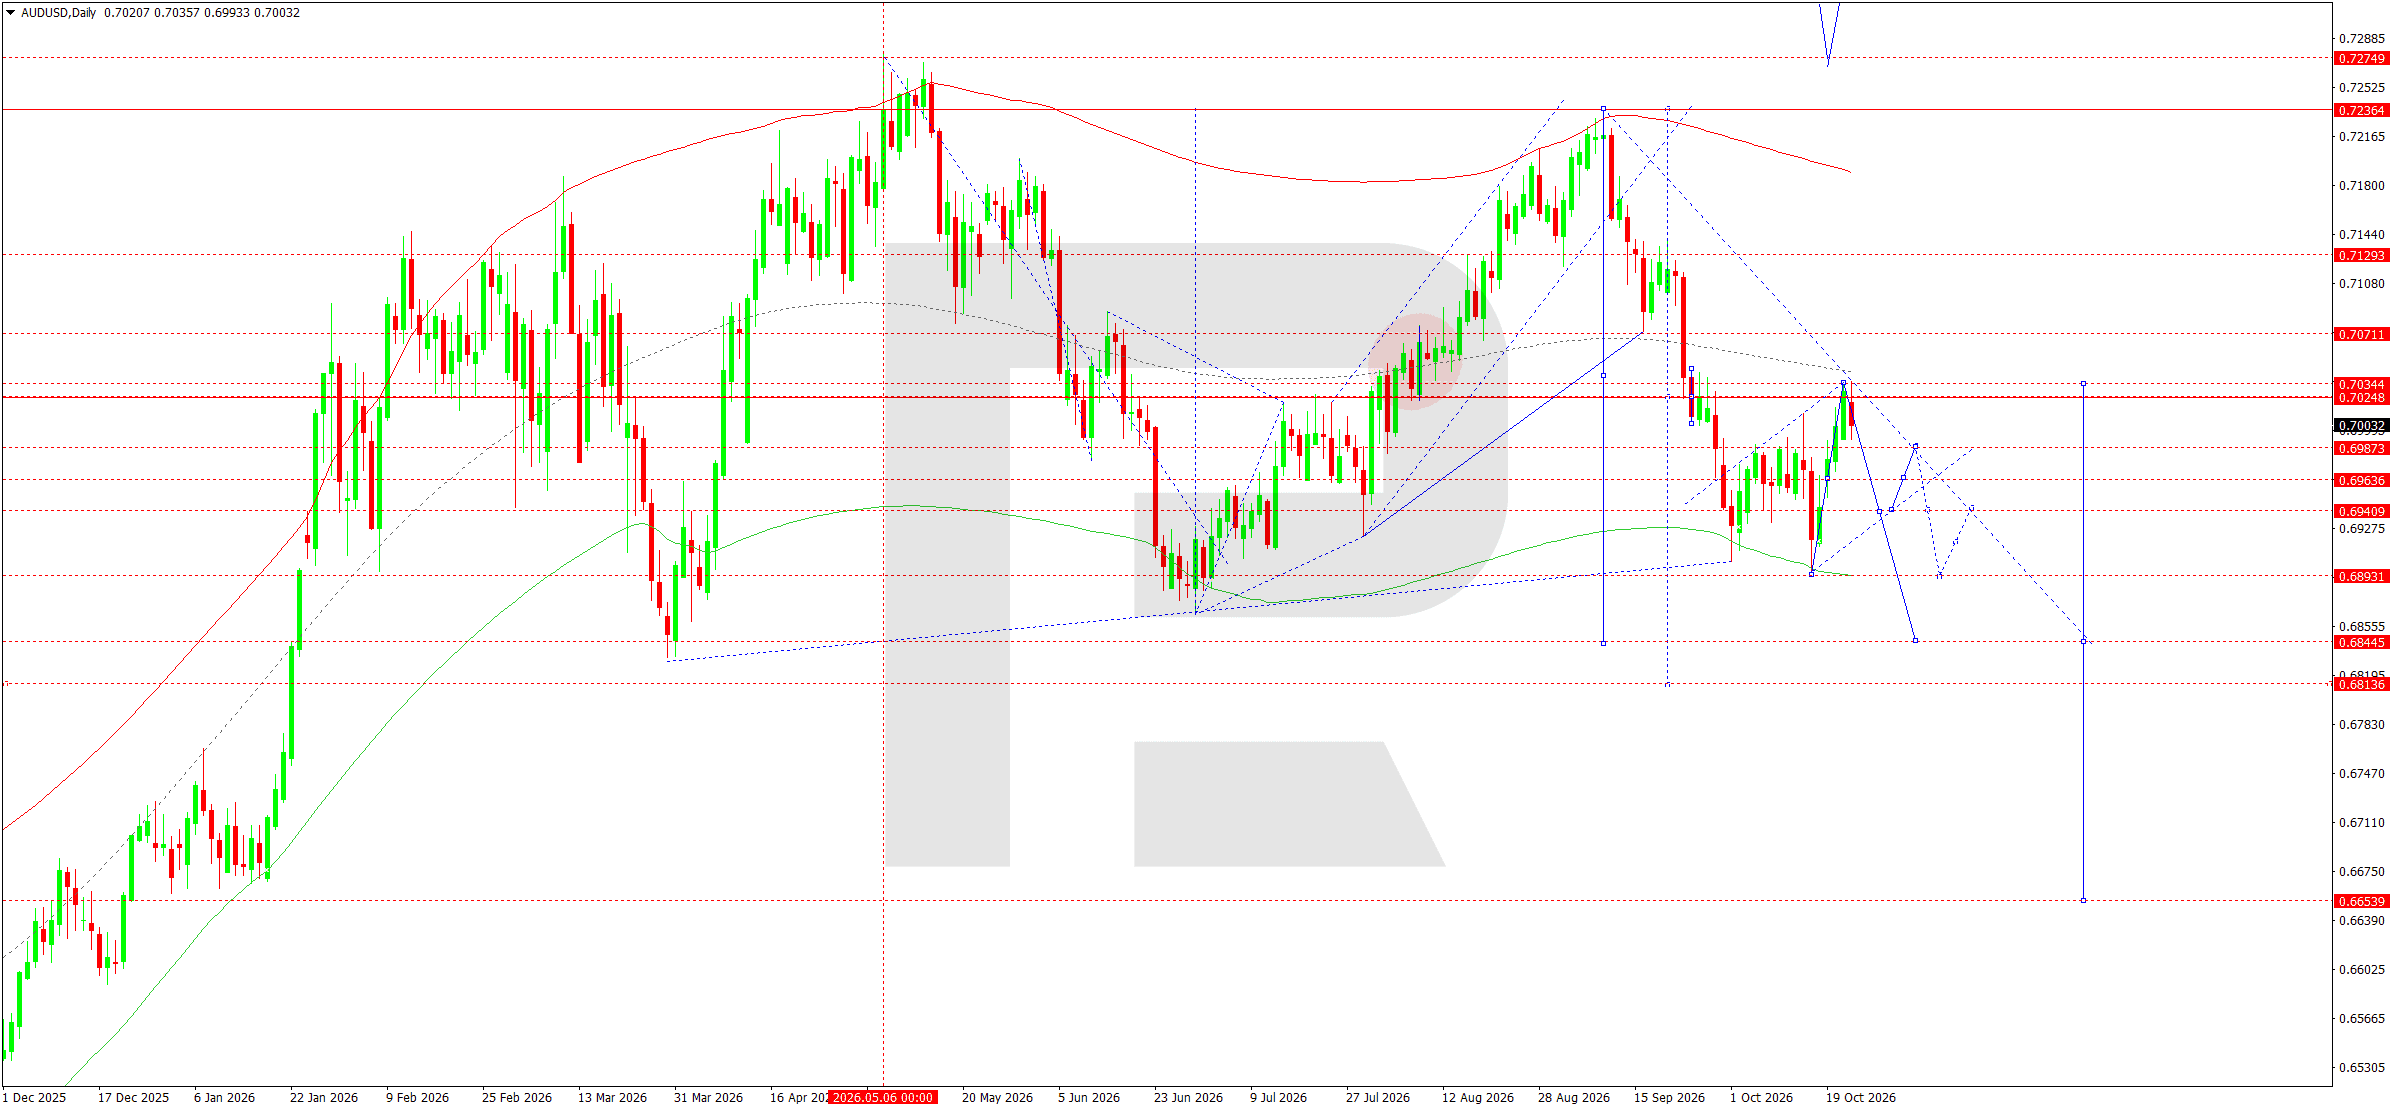
The daily chart's technical picture points to a developing downward structure following the completion of an upward wave near resistance at 0.7236. The pair formed a series of lower highs and reached its initial downside target at 0.6893.
The subsequent recovery reached projected resistance at 0.7034, where buyers encountered increased supply. This area is viewed as the completion of a corrective wave within the main downward move.
As long as prices remain below 0.7034, another downward impulse is expected, with an interim target of 0.6940. A break below that level would open the way for a retest of 0.6893 and a further decline towards 0.6844.
Once the lower boundary of the projected range is reached, a corrective recovery towards 0.6940 is likely. The alternative scenario envisages consolidation above 0.7034, easing selling pressure and creating conditions for a move towards 0.7071.
The main priority for the week remains selling into price recoveries.
AUDUSD trade scenario
USDCAD forecast
USDCAD fundamental analysis
Over the coming week, USDCAD movements will be driven by expectations regarding the monetary policies of the US Federal Reserve (Fed) and the Bank of Canada (BoC), changes in US bond yields and conditions in the oil market. Investors will focus particularly on interest rate prospects and comments from central bank officials.
Oil prices remain important for the Canadian dollar. A recovery in oil prices could support the currency and deepen the decline in USDCAD. Conversely, weakness in the commodity market would create conditions for renewed US dollar buying.
Assessments of US economic conditions, including business activity, inflation expectations and consumer demand, will be another factor. US economic resilience could limit dollar weakness, while signs of slowing growth could reinforce the pair's corrective move.
The main fundamental risk for the week concerns possible changes in market expectations about future Fed and BoC decisions. Heightened sensitivity to these expectations suggests that volatility will persist, particularly near key technical levels.
USDCAD technical analysis
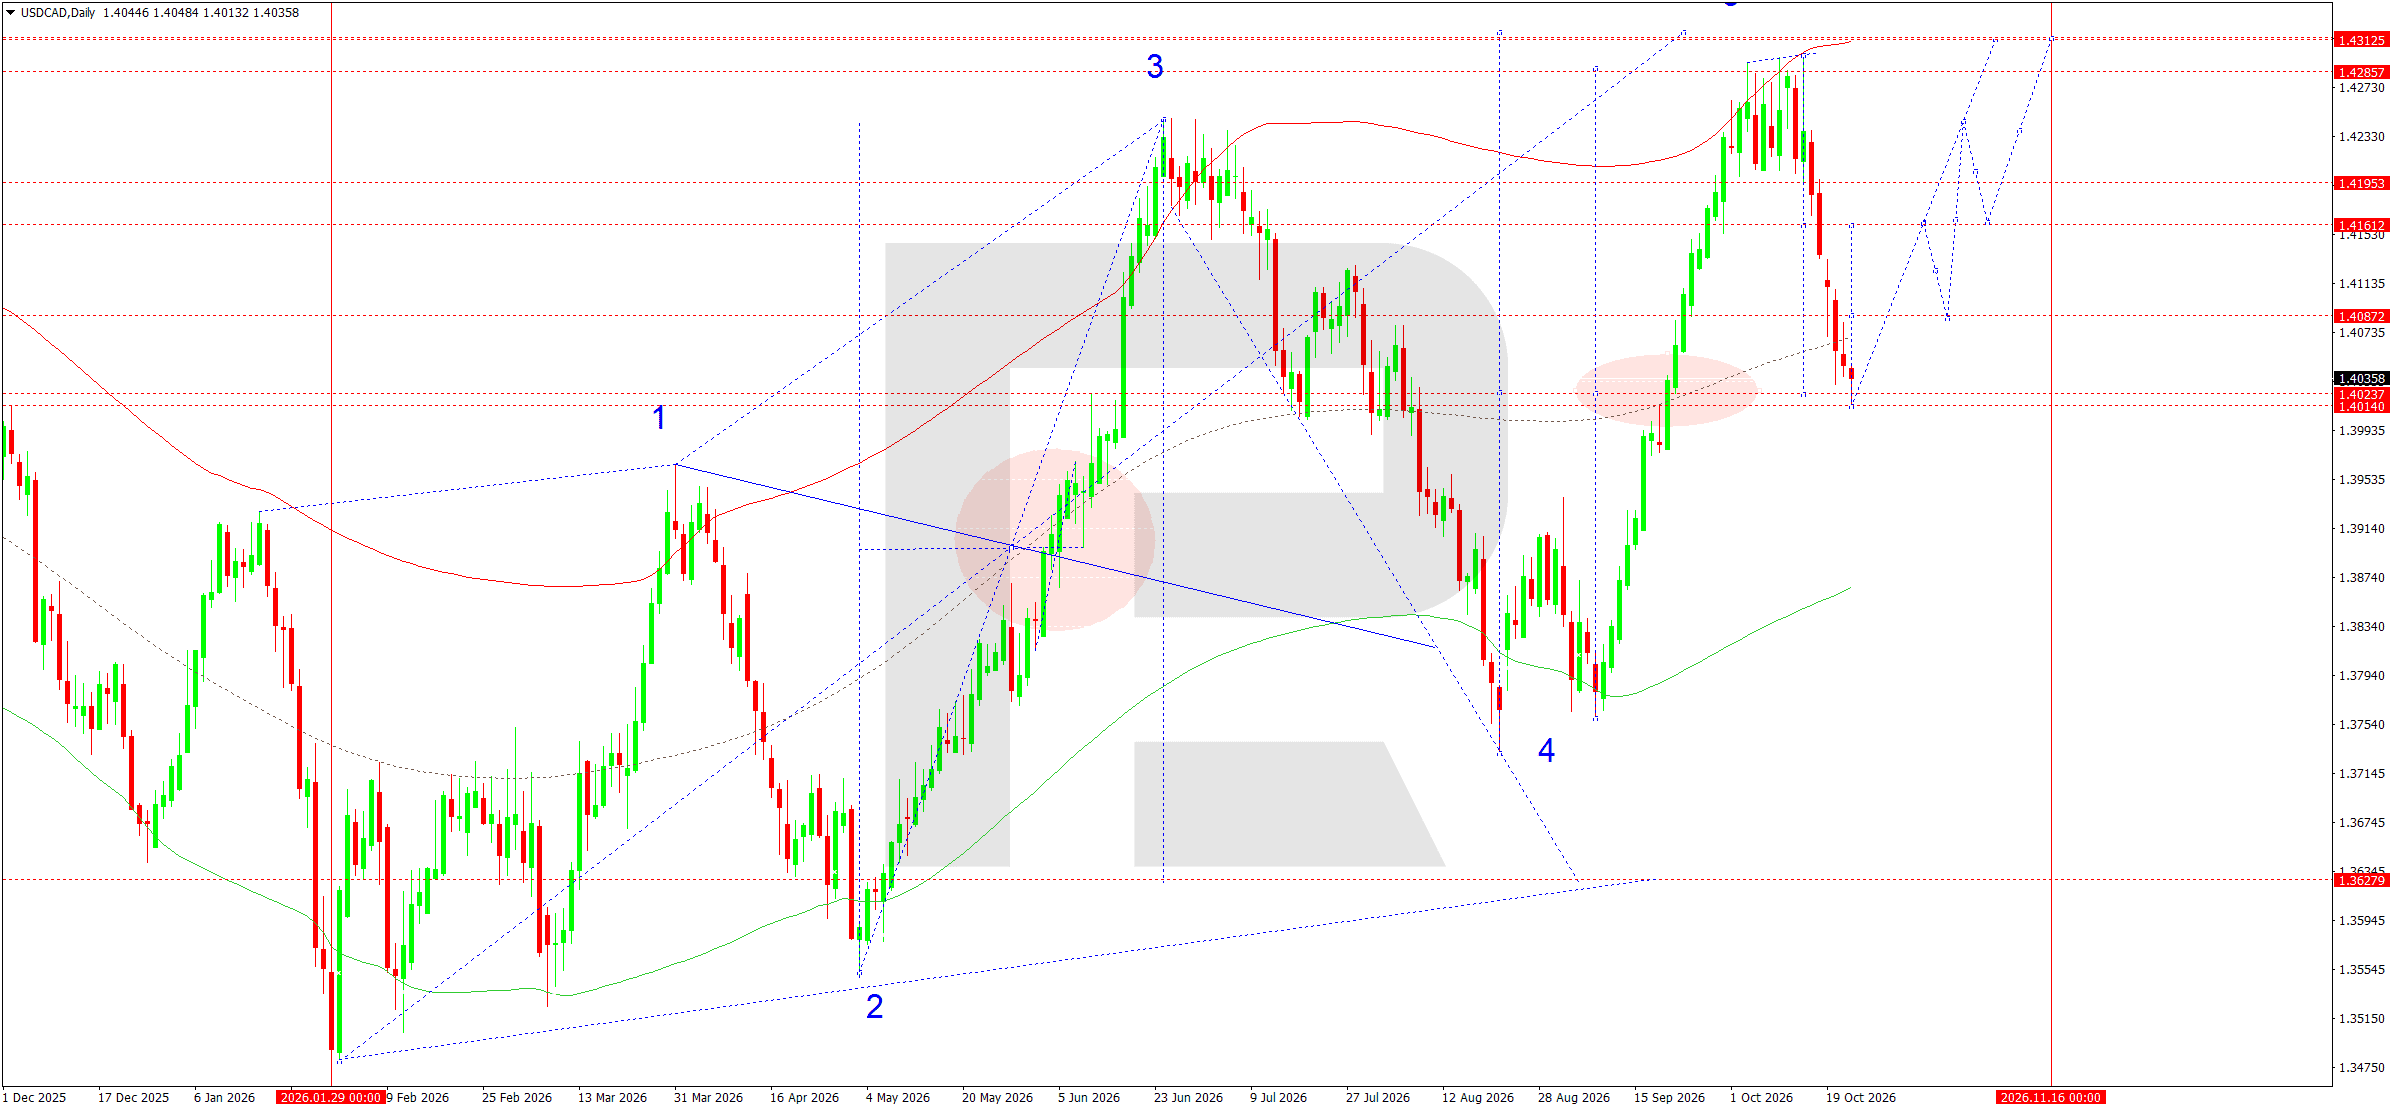
On the daily USDCAD chart, an upward wave towards 1.4286 has ended, followed by a correction. The price declined towards the 1.4024 area near the ascending support line. The main medium-term trend retains its bullish structure, but sellers hold the short-term advantage.
A test of the 1.4024–1.4014 range is expected in the coming week, potentially accompanied by consolidation. Holding this area would create conditions for a recovery towards 1.4087 and 1.4161.
A further upward leg towards 1.4286 and 1.4313 is then envisaged, marking the completion of another growth wave. Once the upper boundary is reached, a renewed correction towards 1.3898 is expected.
A break below 1.4014 would invalidate the immediate recovery scenario and intensify the downward correction.
USDCAD trade scenario
XAUUSD forecast
XAUUSD fundamental analysis
Gold is ending the current week under pressure from a stronger US dollar and elevated US Treasury yields. Expectations regarding the future monetary policy of the US Federal Reserve (Fed) remain the principal fundamental factor.
Rising oil prices are increasing inflation risks, limiting the central bank's ability to ease monetary conditions. As a result, the attractiveness of gold as a non-interest-bearing asset is diminishing.
Next week, investors will focus on the Fed meeting on 27–28 October, the release of US third-quarter GDP figures and the personal consumption expenditures (PCE) price index. Hawkish Fed rhetoric could support the dollar and increase selling pressure on the precious metal.
Meanwhile, geopolitical tensions in the Middle East are sustaining some safe-haven demand for gold, limiting the potential depth of a decline.
XAUUSD technical analysis
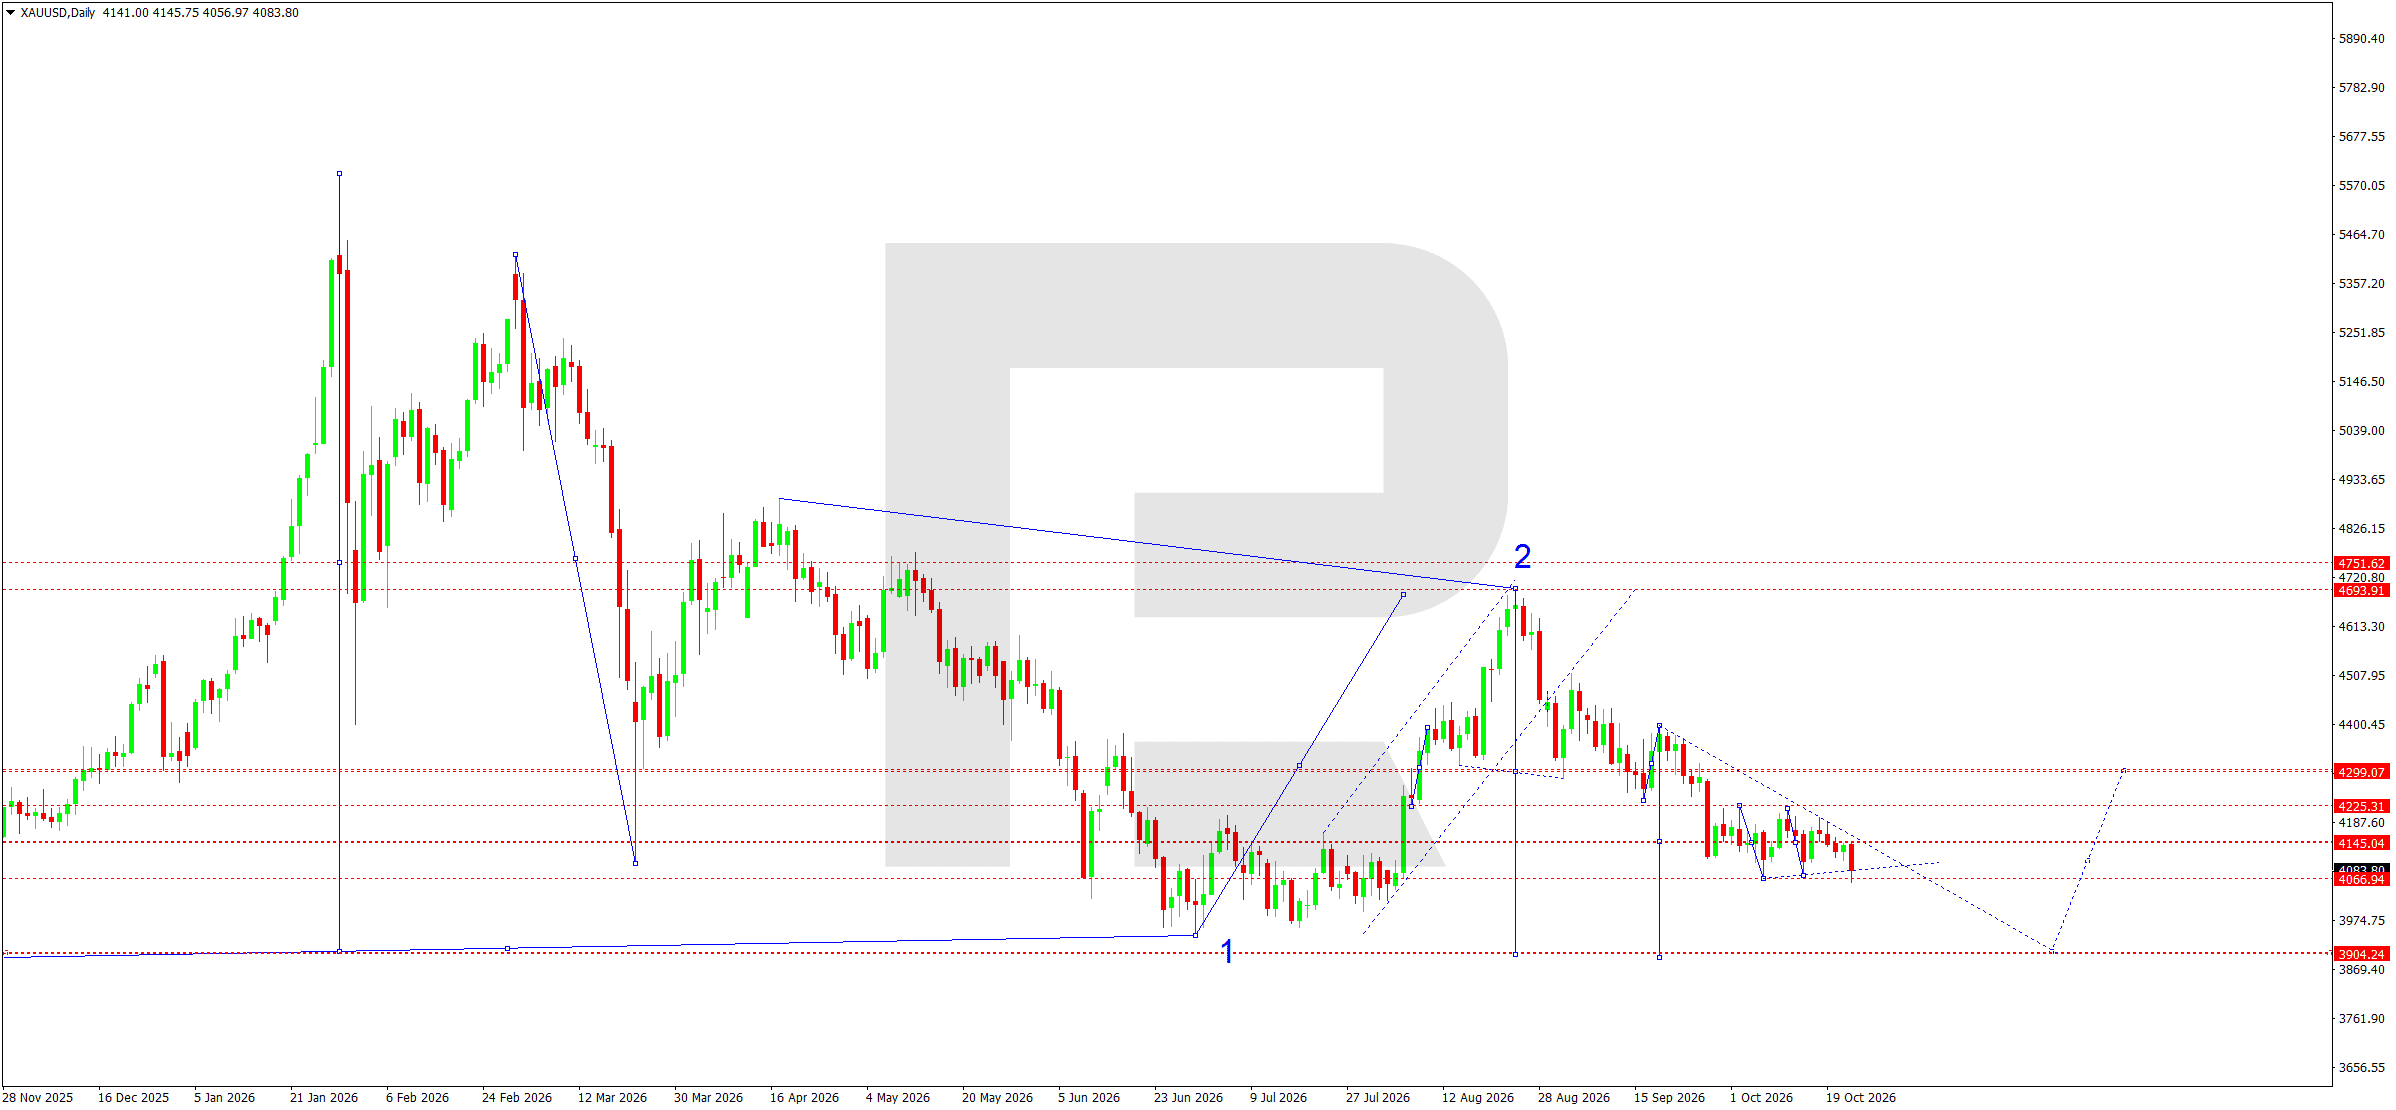
On the daily XAUUSD chart, the downtrend that formed following the completion of the second corrective wave around 4,720 remains in place. The subsequent decline featured a succession of lower highs and a return to previously identified support areas.
The structure of another downward wave towards 4,066 is now almost complete. Recent trading sessions have been characterised by a narrow consolidation range below resistance at 4145.
This configuration points to continuing selling pressure and the likelihood of the main move extending lower.
The preferred scenario for next week involves a break below support at 4,066 followed by a downward impulse towards 3904. This is the main technical target and corresponds to the lower boundary of the long-term structure.
Interim corrective movements may involve a retest of 4,145 from below. A deeper recovery towards 4,225 is currently viewed as an alternative scenario. Changing the existing bearish structure would require sustained consolidation above the nearest resistance levels.
Sellers therefore retain the advantage while the price remains below 4145. The main objective remains a continued decline towards 3904, potentially followed by a reversal structure.
XAUUSD trade scenario
US 500 forecast
US 500 fundamental analysis
The fundamental backdrop for the US stock market remains mixed. Investors are primarily focused on the US Federal Reserve's (Fed) monetary policy, technology companies' earnings and government bond yields. The Fed meeting on 28 October will be the key event of the week. The market largely expects interest rates to remain unchanged, but the central bank's comments could significantly alter expectations regarding further policy tightening.
A reassessment of prospects for the artificial intelligence sector is adding pressure. Recent selling in technology shares reflects concerns about returns on large-scale investments. Meanwhile, rising oil prices amid geopolitical tensions are increasing inflation risks. Earnings releases from Microsoft, Alphabet and Amazon could increase index volatility. Nevertheless, resilient corporate financial results maintain the potential for a recovery in demand for US equities.
US 500 technical analysis
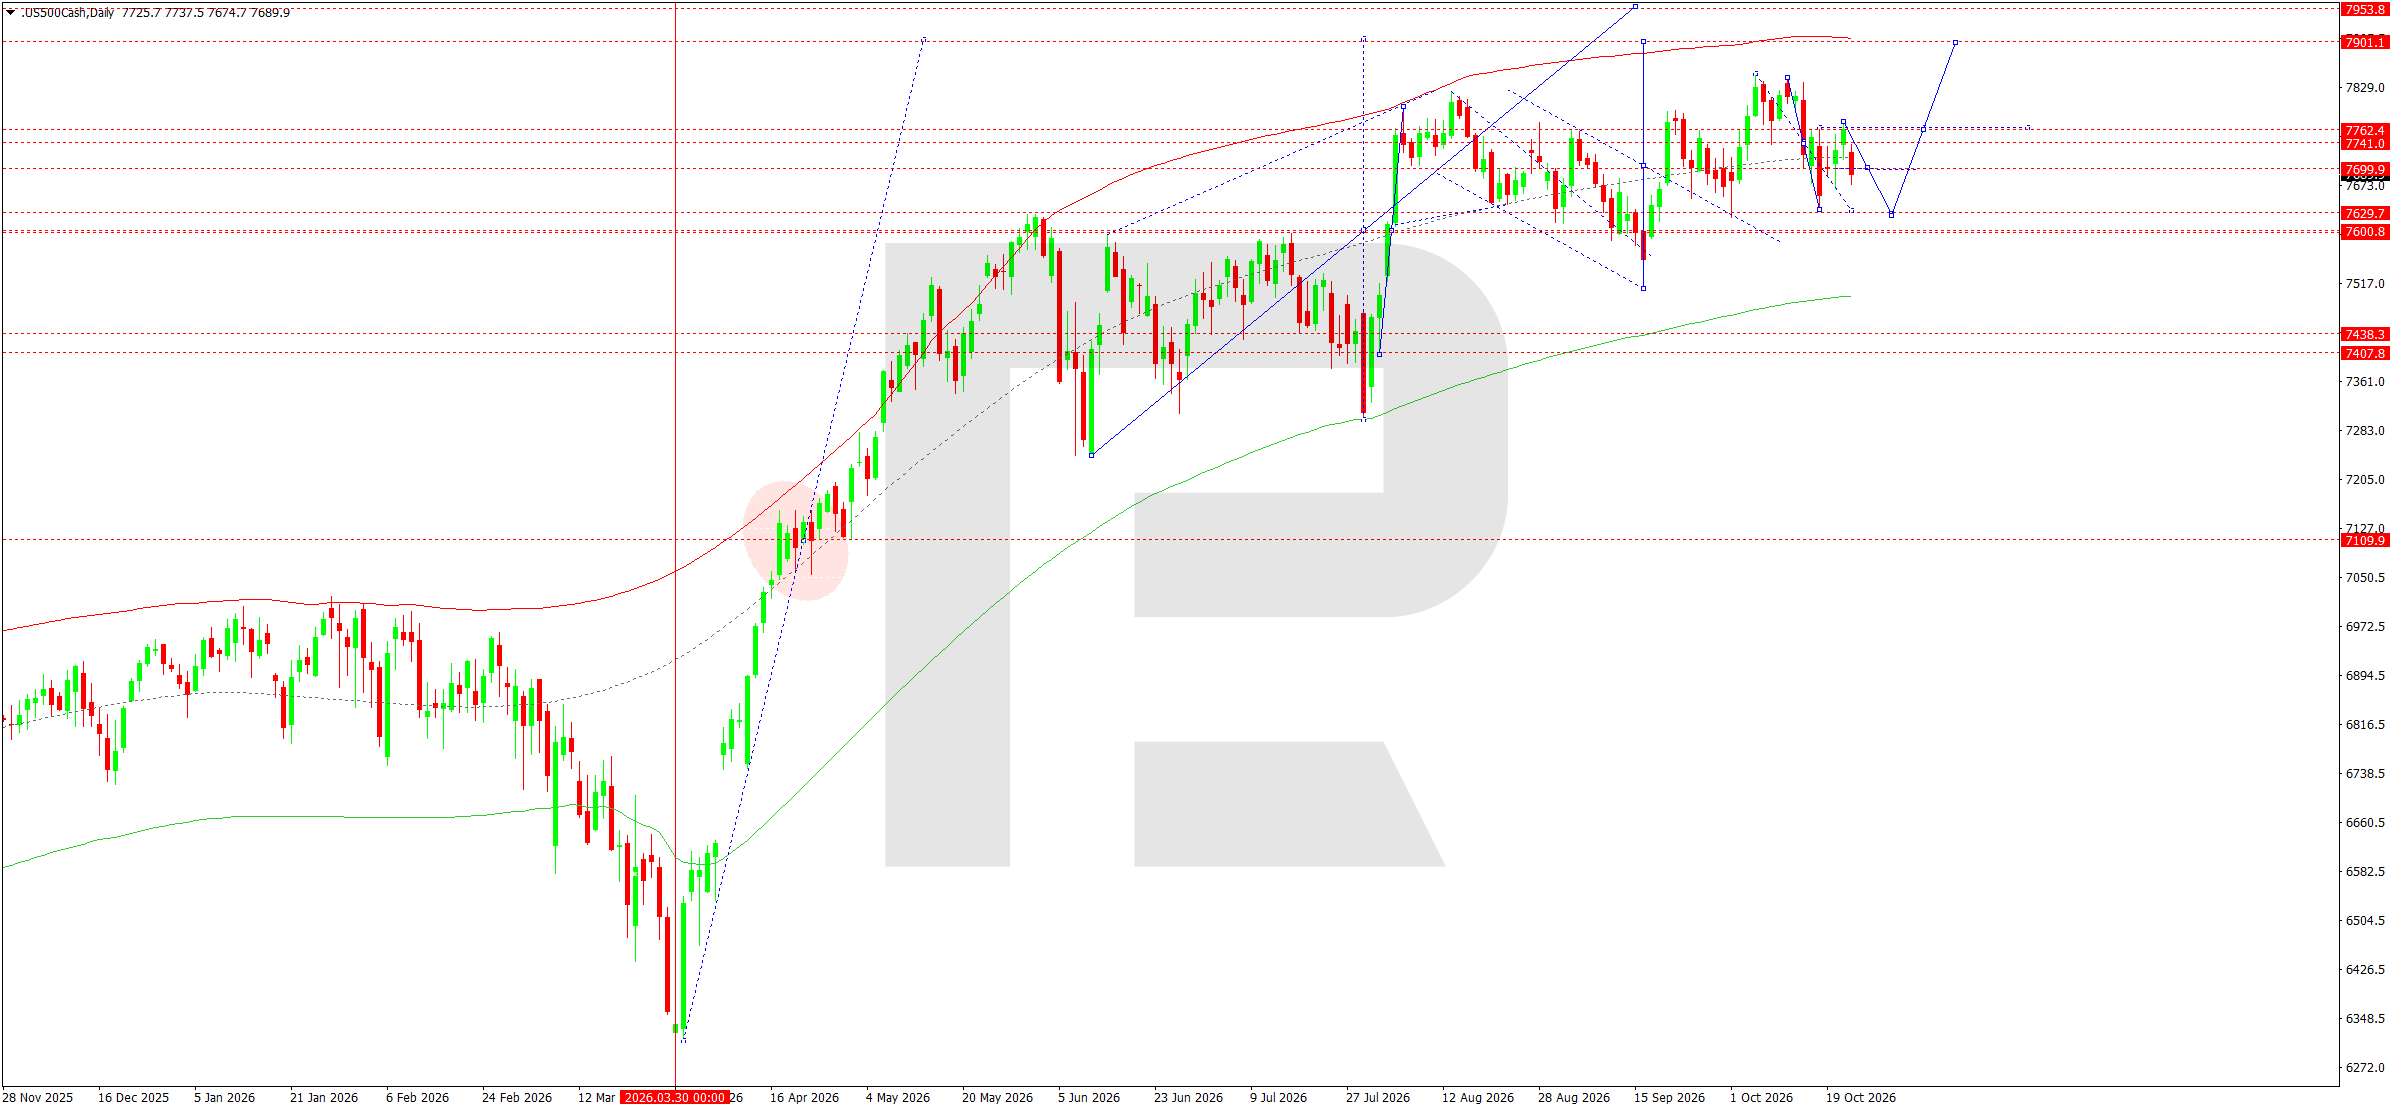
The technical picture on the daily US 500 chart indicates that the medium-term uptrend remains intact despite a local corrective wave. After reaching a high around 7830, the index entered consolidation bounded by resistance at 7,762 and support at 7601. The current price is around 7690, within the middle of the established range.
Under the Elliott Wave structure, the corrective move may end around 7,630–7,601 before a new upward impulse develops. Consolidation above 7,741 followed by a break above 7,762 would provide further confirmation.
The main scenario envisages an initial decline towards 7630, a period of consolidation and renewed buying activity. If the upward wave develops, the nearest target will be 7762, followed by potential gains towards 7,901 and 7954.
A break below support at 7,601 would alter the short-term market structure and raise the probability of a deeper correction towards 7438. However, as long as prices remain above this area and the rising moving average, buyers retain the advantage. The market's reaction to Fed decisions and corporate earnings will be decisive.
US 500 trade scenario
BTCUSD forecast
BTCUSD fundamental analysis
Over the coming week, Bitcoin movements will depend on expectations regarding US monetary policy, changes in government bond yields and demand for risk assets. Investors will focus primarily on the outlook for decisions by the US Federal Reserve (Fed). Expectations of easing could support the cryptocurrency market, while persistently tight financial conditions would limit recovery potential.
US dollar movements will be another factor. Dollar strength generally increases pressure on Bitcoin, especially when Treasury yields also rise. A weaker dollar, by contrast, creates conditions for buyers to return.
Capital flows into exchange-traded Bitcoin funds, institutional investor activity and overall conditions in the US stock market remain important. Sustained investment demand could support a recovery in prices after the correction. If global sentiment deteriorates, the likelihood of retesting nearby support levels will increase.
BTCUSD technical analysis
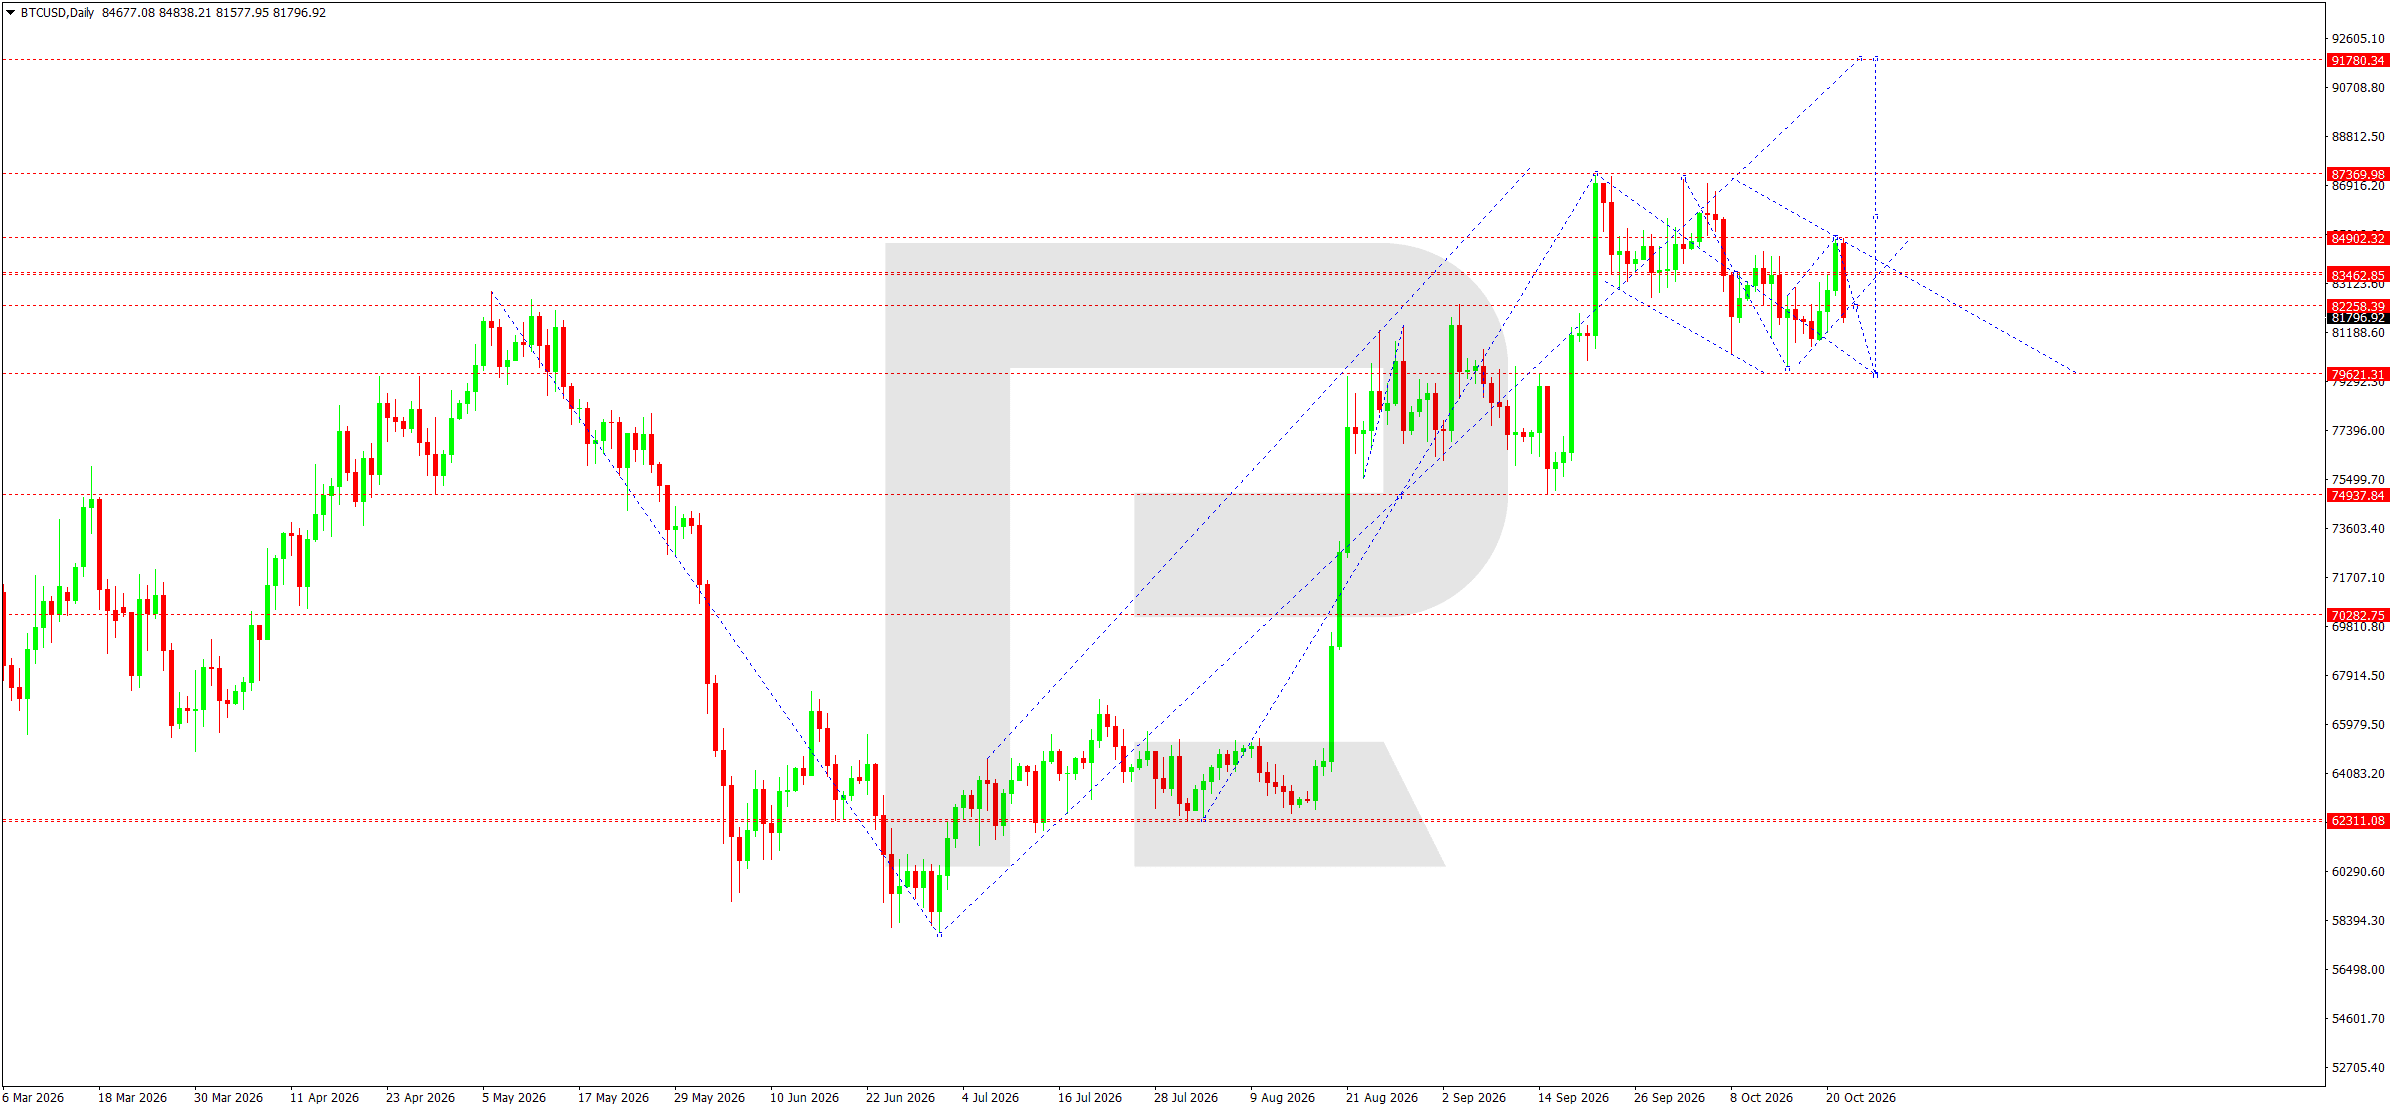
On the daily BTCUSD chart, a corrective decline has developed from the 87,670 area towards support at 79,621 after the completion of an upward wave. The main bullish structure remains intact for now, although short-term trading is taking place within a descending corrective channel.
The current price is around 81797. Consolidation above 79,621 is expected in the coming week, followed by a recovery in buying activity.
The initial target is resistance at 83463. Consolidation above this level would create conditions for further gains towards 84,902 and then a test of the 87,670 area. If a new upward impulse develops, the main medium-term target will be 91780.
The wave structure allows for the corrective leg to end and another upward wave to form. However, a break below support at 79,621 would invalidate the preferred recovery scenario and increase the likelihood of a decline towards 74938.
Thus, the principal scenario for the week remains a gradual Bitcoin recovery following consolidation, provided buyers maintain control of key support. Confirmation would come from a daily close above the nearest resistance followed by an expansion of the upward price range.
BTCUSD trade scenario
Weekly summary
Four central banks announce rate decisions in the week of 26-30 October: the Fed and the Bank of Canada on Wednesday 28 October, the ECB on Thursday and the Bank of Japan on Friday. Five of the eight scenarios expect further declines (EURUSD, USDJPY, GBPUSD, AUDUSD and XAUUSD), and three rely on a recovery after a correction (USDCAD, US 500 and BTCUSD). The main event of the week, the Fed decision on Wednesday, comes with the market expecting an unchanged rate, so the tone of the central bank's comments will set the direction for the dollar, gold, US 500, and Bitcoin.
Editors' picks


EURUSD forecast 2026–2027: technical analysis, price levels & predictions
The EURUSD outlook for 2026 and 2027: key levels on the daily chart, three trading scenarios and the policy gap between the Fed and the ECB that drives the pair.

Gold (XAUUSD) forecast 2026: technical analysis, price levels & predictions
Where gold could trade in 2026: key levels, three trading scenarios with entry triggers and the forecasts from J.P. Morgan, Deutsche Bank and Goldman Sachs.
Forecasts presented in this section only reflect the author’s private opinion and should not be considered as guidance for trading. RoboForex bears no responsibility for trading results based on trading recommendations described in these analytical reviews.