World indices overview: news from US 30, US 500, US Tech, JP 225, and DE 40 for 9 January 2025
Global indices are mainly in a downtrend. Find out more in our analysis and forecast for 9 January 2025.
US indices forecast: US 30, US 500, US Tech
- Recent data: initial jobless claims came in at 201 thousand
- Market impact: lower-than-expected claims indicate a strong labour market, which could boost consumer spending confidence and strengthen related sectors
Fundamental analysis
The weaker-than-expected reading (201 thousand versus 214 thousand) shows fewer people lost jobs than expected. This development signals that the labour market remains stable despite other economic conditions.
If investors perceive the strong labour market as a signal that the Federal Reserve may keep elevated interest rates, this could negatively impact stocks, particularly in the rate-sensitive tech sector. The US stock indices may receive moderate support as the labour market appears resilient. However, the reaction could be restrained if investors interpret the data as a signal for potential Federal Reserve monetary policy tightening.
US 30 technical analysis
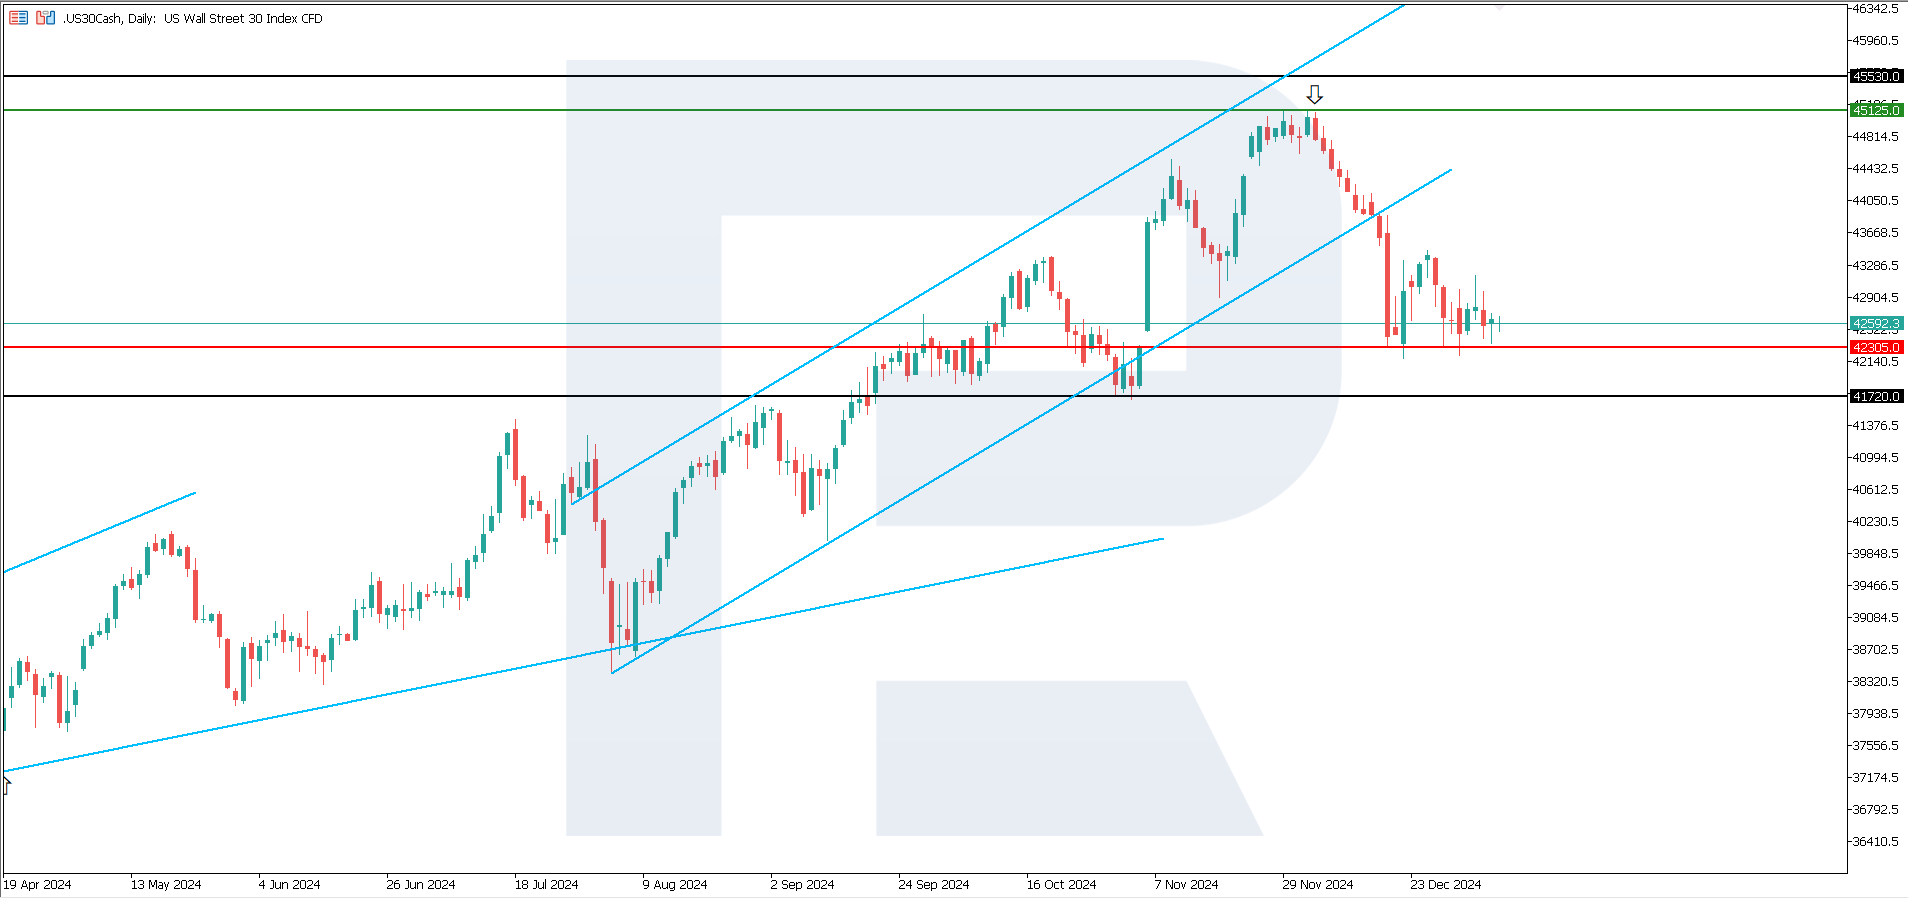
The US 30 stock index is in a downtrend following one of the most prolonged downward series – 10 trading sessions. According to the US 30 technical analysis, after a 2.8% correction, the price is most likely to fall to the 41,720.0 target.
The following scenarios are considered for the US 30 price forecast:
- Pessimistic US 30 forecast: a breakout below the 42,305.0 support level could send the index down to 41,720.0
- Optimistic US 30 forecast: a breakout above the 45,125.0 resistance level could drive the price up to 45,530.0
US 500 technical analysis
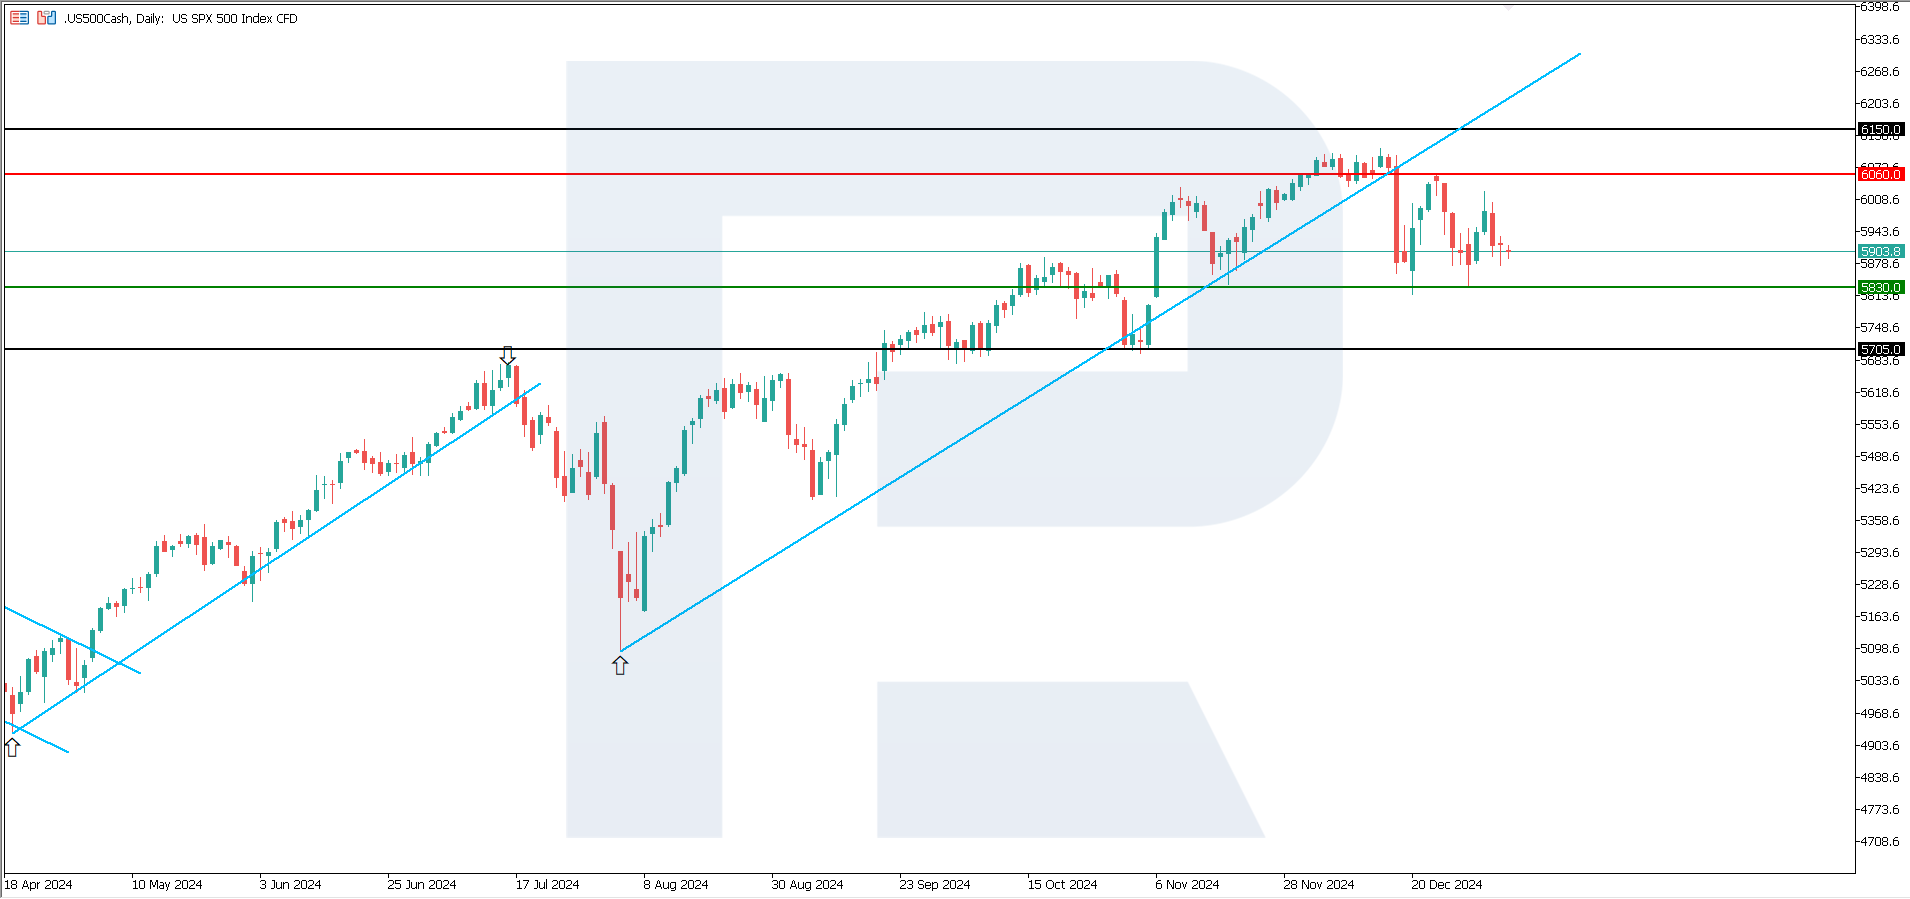
The US 500 stock index continued to decline. The uptrend persists despite two attempts to correct. According to the US 500 technical analysis, the next decline target could be 5,705.0.
The following scenarios are considered for the US 500 price forecast:
- Pessimistic US 500 forecast: a breakout below the 5,830.0 support level could push the index down to 5,705.0
- Optimistic US 500 forecast: a breakout above the 6,060.0 resistance level could propel the index to 6,150.0
US Tech technical analysis
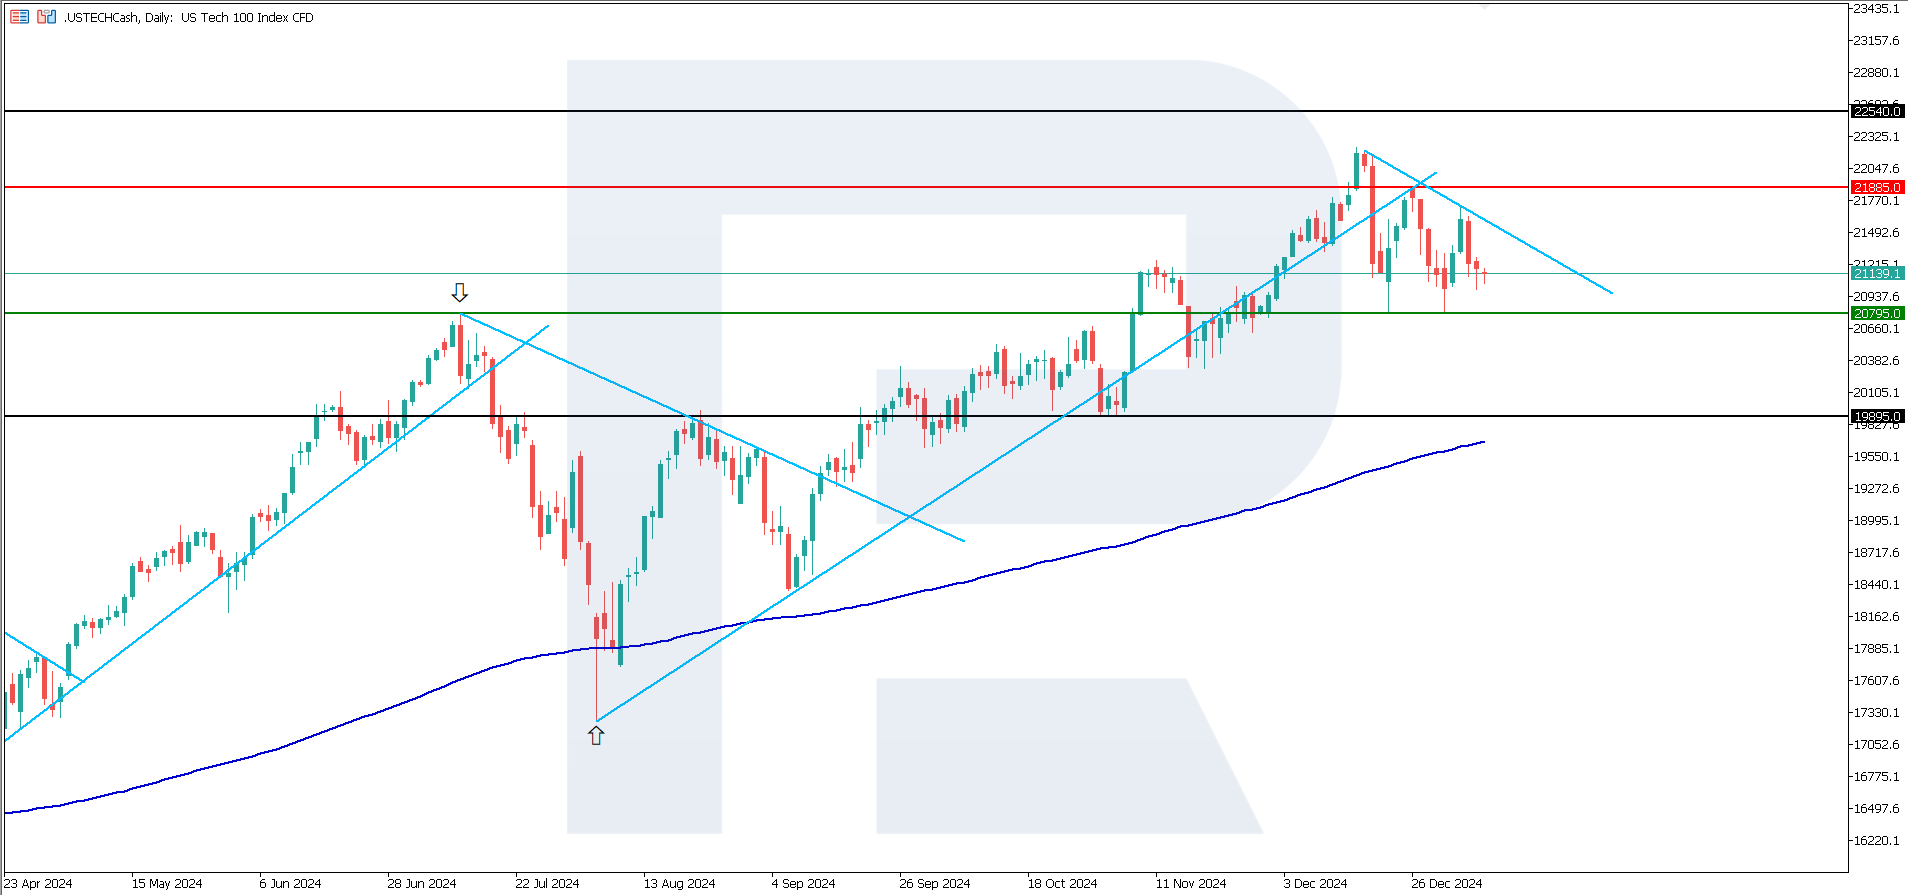
The US Tech stock index is in a steady downtrend. According to the US Tech technical analysis, a sideways channel could potentially form. However, the price might break below this channel, continuing the downtrend.
The following scenarios are considered for the US Tech price forecast:
- Pessimistic US Tech forecast: a breakout below the 20,795.0 support level could send the index down to 19,895.0
- Optimistic US Tech forecast: a breakout above the 21,885.0 resistance level could drive the index up to 22,540.0
Asia index forecast: JP 225
- Recent data: Japan’s composite PMI came in at 50.5
- Market impact: a reading above 50.0 signals sustainable economic growth, which may cause optimism among investors
Fundamental analysis
The composite PMI combines data from the manufacturing and services sectors. The increase from 50.1 to 50.5 indicates an overall improvement in economic activity. Despite moderate growth, the economy remains in the expansion phase.
Moderate growth rates (a minor uptick above the 50.0 threshold) are unlikely to lead to substantial volatility, as it signals stability, not a surge. The Japanese stock market will probably react positively, especially for companies focused on the domestic market. However, growth could be limited if global risks or investor expectations exceed current data.
JP 225 technical analysis
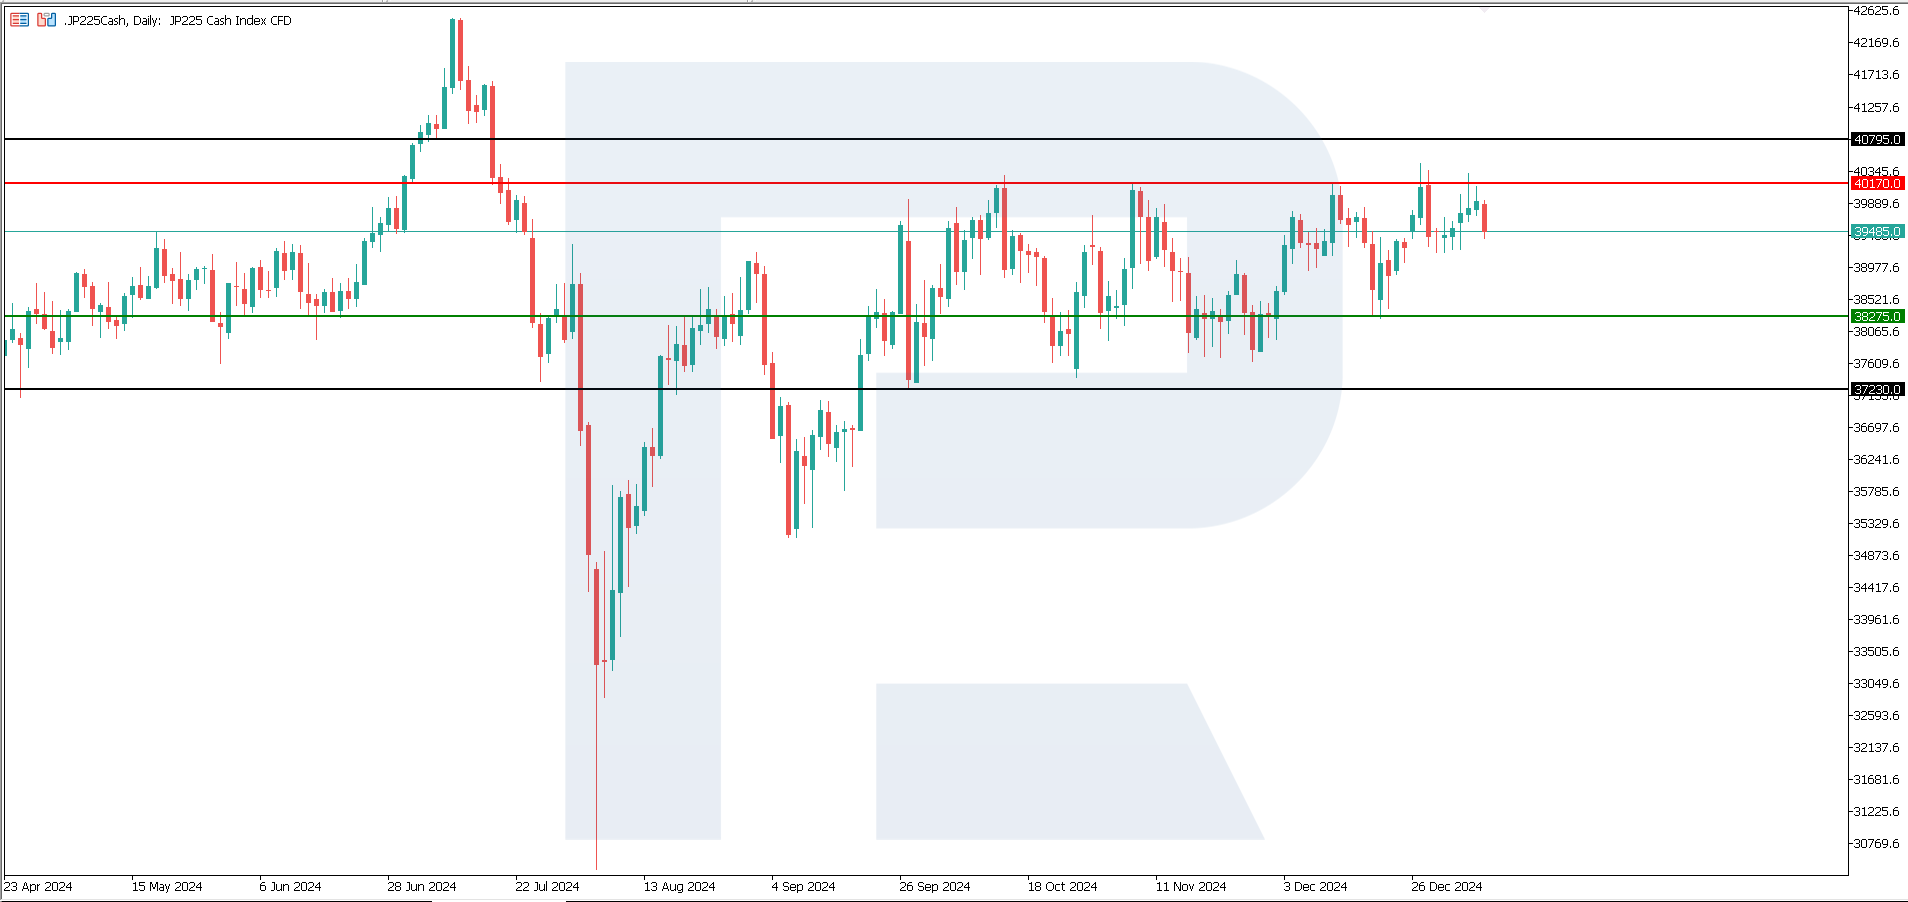
The JP 225 stock index is trading within a sideways channel. According to the JP 225 technical analysis, there are no prerequisites for breaking the boundaries of this channel in the medium term. Given Japan’s weak economic data, the uptrend is highly unlikely.
The following scenarios are considered for the JP 225 price forecast:
- Pessimistic JP 225 forecast: a breakout below the 38,275.0 support level could send the index down to 37,230.0
- Optimistic JP 225 forecast: a breakout above the 40,170.0 resistance level could push the index to 40,795.0
European index forecast: DE 40
- Recent data: Germany’s industrial production in November rose by 1.5% from October
- Market impact: an increase in the indicator may bolster shares of manufacturing-dependent companies, especially in industries such as machinery, automotive industry, and equipment
Fundamental analysis
The 1.5% increase in industrial production in November (expected +0.5%, previously at -1.0%) points to a serious recovery in the manufacturing sector. The stronger-than-forecast figure shows that manufacturing facilities have increased their activity faster than expected.
The 2.8% decrease from last year’s corresponding period indicates that the total production output is still below last year’s levels despite a monthly recovery. The German stock market will likely see a positive reaction in the short term, especially in sectors dependent on industrial production. However, weak annual indicators cannot maintain investor optimism in the long term.
DE 40 technical analysis
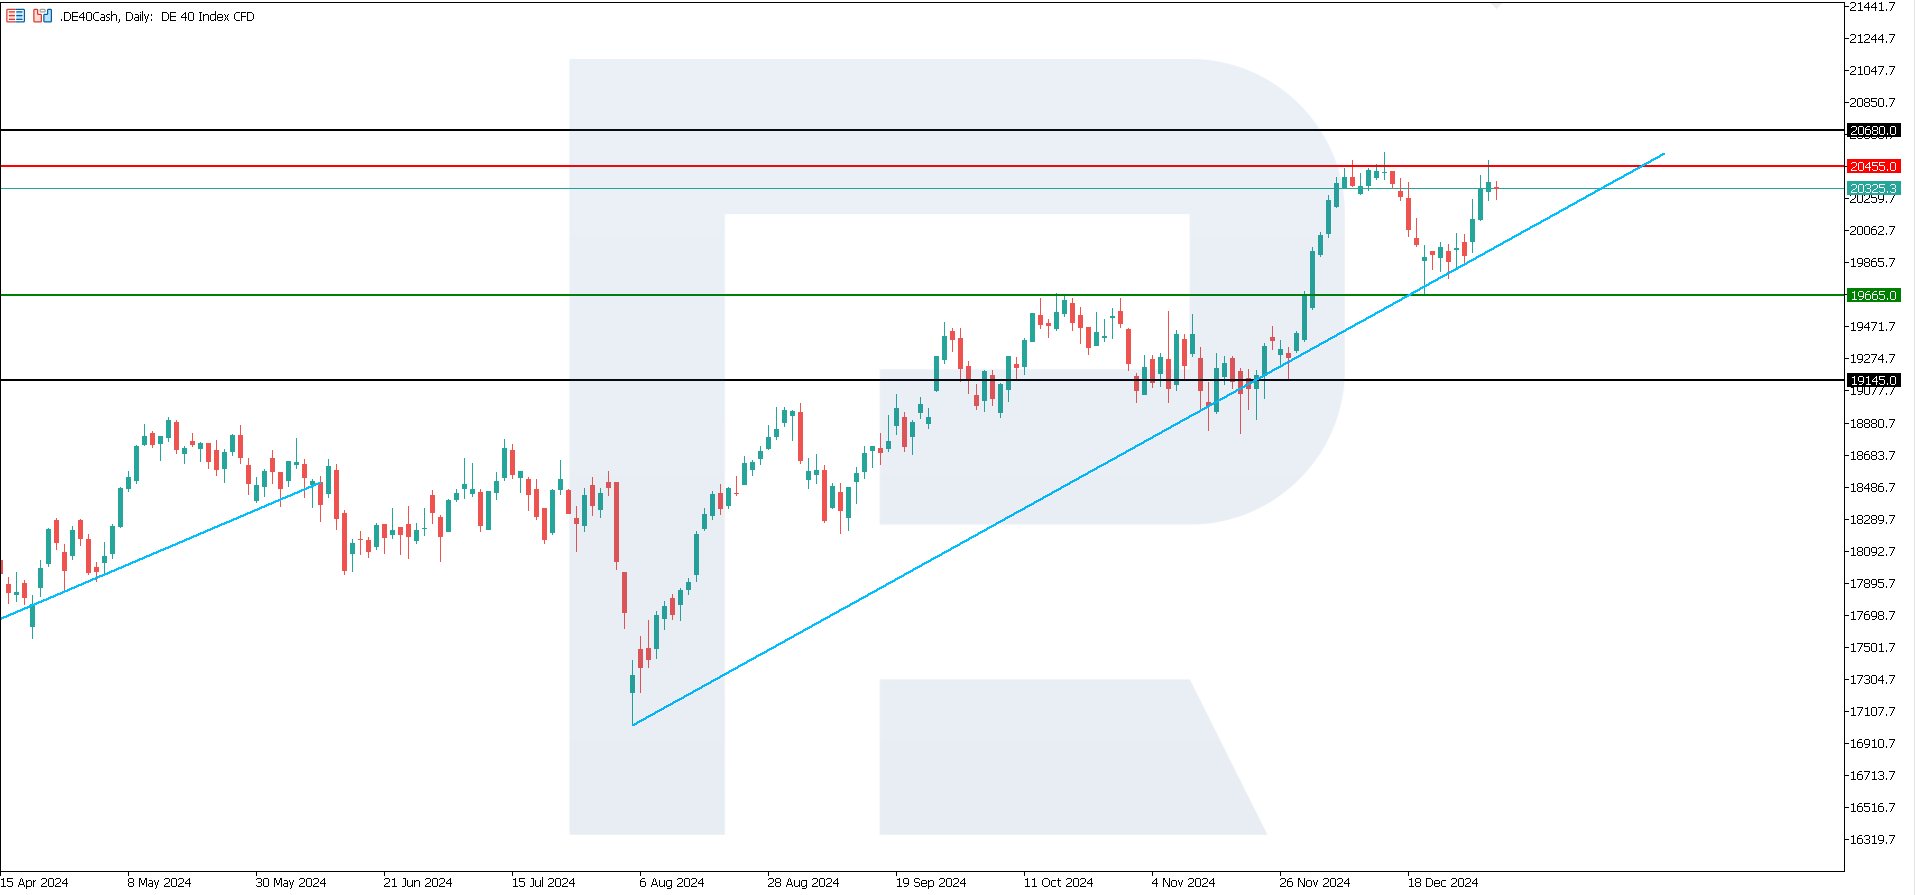
The DE 40 stock index maintains its uptrend, rising by 4.21% after a decline. Nevertheless, according to the DE 40 technical analysis, the uptrend may be short-lived, and a sideways channel could form with a subsequent fall.
The following scenarios are considered for the DE 40 price forecast:
- Pessimistic DE 40 forecast: a breakout below the 19,665.0 support level could send the index down to 19,145.0
- Optimistic DE 40 forecast: if the price breaks above the 20,455.0 resistance level, it could climb to 20,680.0
Summary
Most stock indices are in a downtrend, with the DE 40 index being the only exception due to the ECB’s soft monetary policy. US labour market data, which will affect the future Fed monetary policy parameters, will be crucial. The US 30, US 500, and US Tech indices may see increased volatility. The JP 225 stock index will likely continue trading within a sideways channel.
Forecasts presented in this section only reflect the author’s private opinion and should not be considered as guidance for trading. RoboForex bears no responsibility for trading results based on trading recommendations described in these analytical reviews.

