
Stock market outlook for the week of 19–23 October 2026: key levels for world indices
Stock market outlook for 19–23 October 2026: Tesla and Meta earnings will be key drivers for the US Tech, US 500, and US 30. US housing market data, unemployment claims, and consumer sentiment will help assess the outlook for the US economy.
Key levels for the week
| Instrument | Week | Support | Resistance | Scenario |
|---|---|---|---|---|
| US 500 | +2.5% | 7,595.0 | 7,805.0 | Buyfrom7,745.0 |
| US Tech | −4.8% | 28,880.0 | 29,780.0 | Sellfrom29,005.0 |
| US 30 | −3.8% | 50,680.0 | 52,410.0 | Sellfrom51,605.0 |
| DE 40 | −4.6% | 25,055.0 | 25,525.0 | Sellfrom25,155.0 |
| JP 225 | +9.7% | 63,205.0 | 67,045.0 | Buyfrom63,820.0 |
Events that can move indices this week
| Date | Event | Instruments affected |
|---|---|---|
| Tuesday, 20 October 2026 | Germany's ZEW economic sentiment index for October | The indicator reflects investors' expectations for the German economy and could set the direction for the DE 40. |
| Tuesday, 20 October 2026 | US housing starts and building permits for September | The figures reflect the state of the US housing market and could affect the US 500, US Tech, and US 30. |
| Thursday, 22 October 2026 | US initial jobless claims | The indicator reflects labour market conditions and could shift expectations for future Fed policy, affecting the US 500, US Tech, and US 30. |
| Friday, 23 October 2026 | University of Michigan US consumer sentiment index for October | The data reflects consumer confidence and inflation expectations, which could affect the US 500, US Tech, and US 30. |
US indices forecast: US 30, US 500, US Tech
Fundamental analysis
Last week, the US stock market came under pressure from selling in the technology sector. During the trading week of 12–16 October, the S&P 500 lost approximately 1.9%, while the Dow Jones gained 0.7%. Shares of companies linked to artificial intelligence were the main source of weakness: the PHLX Semiconductor index fell by around 11.4%. Meanwhile, US inflation accelerated to 3.7% year-on-year in September, although the yield on 10-year Treasury bonds declined to approximately 5.09% by the end of the week.
This week, investors will turn their attention to earnings reports from major technology companies, including Tesla and Meta, as well as US macroeconomic data. Housing construction data will be released on Tuesday, jobless claims will be assessed on Thursday, and the University of Michigan's consumer sentiment data will be published on Friday. Strong corporate results and resilient business activity could support the US 500, US Tech, and US 30, whereas weak technology earnings or rising inflation concerns could intensify pressure on the indices, especially the US Tech.
US 500 technical analysis
The US 500 began the trading week with a decline. The price has rebounded from the key resistance level at 7,805, while key support is located at 7,595. There is a risk of a Wedge reversal pattern forming on the US 500 H4 chart.
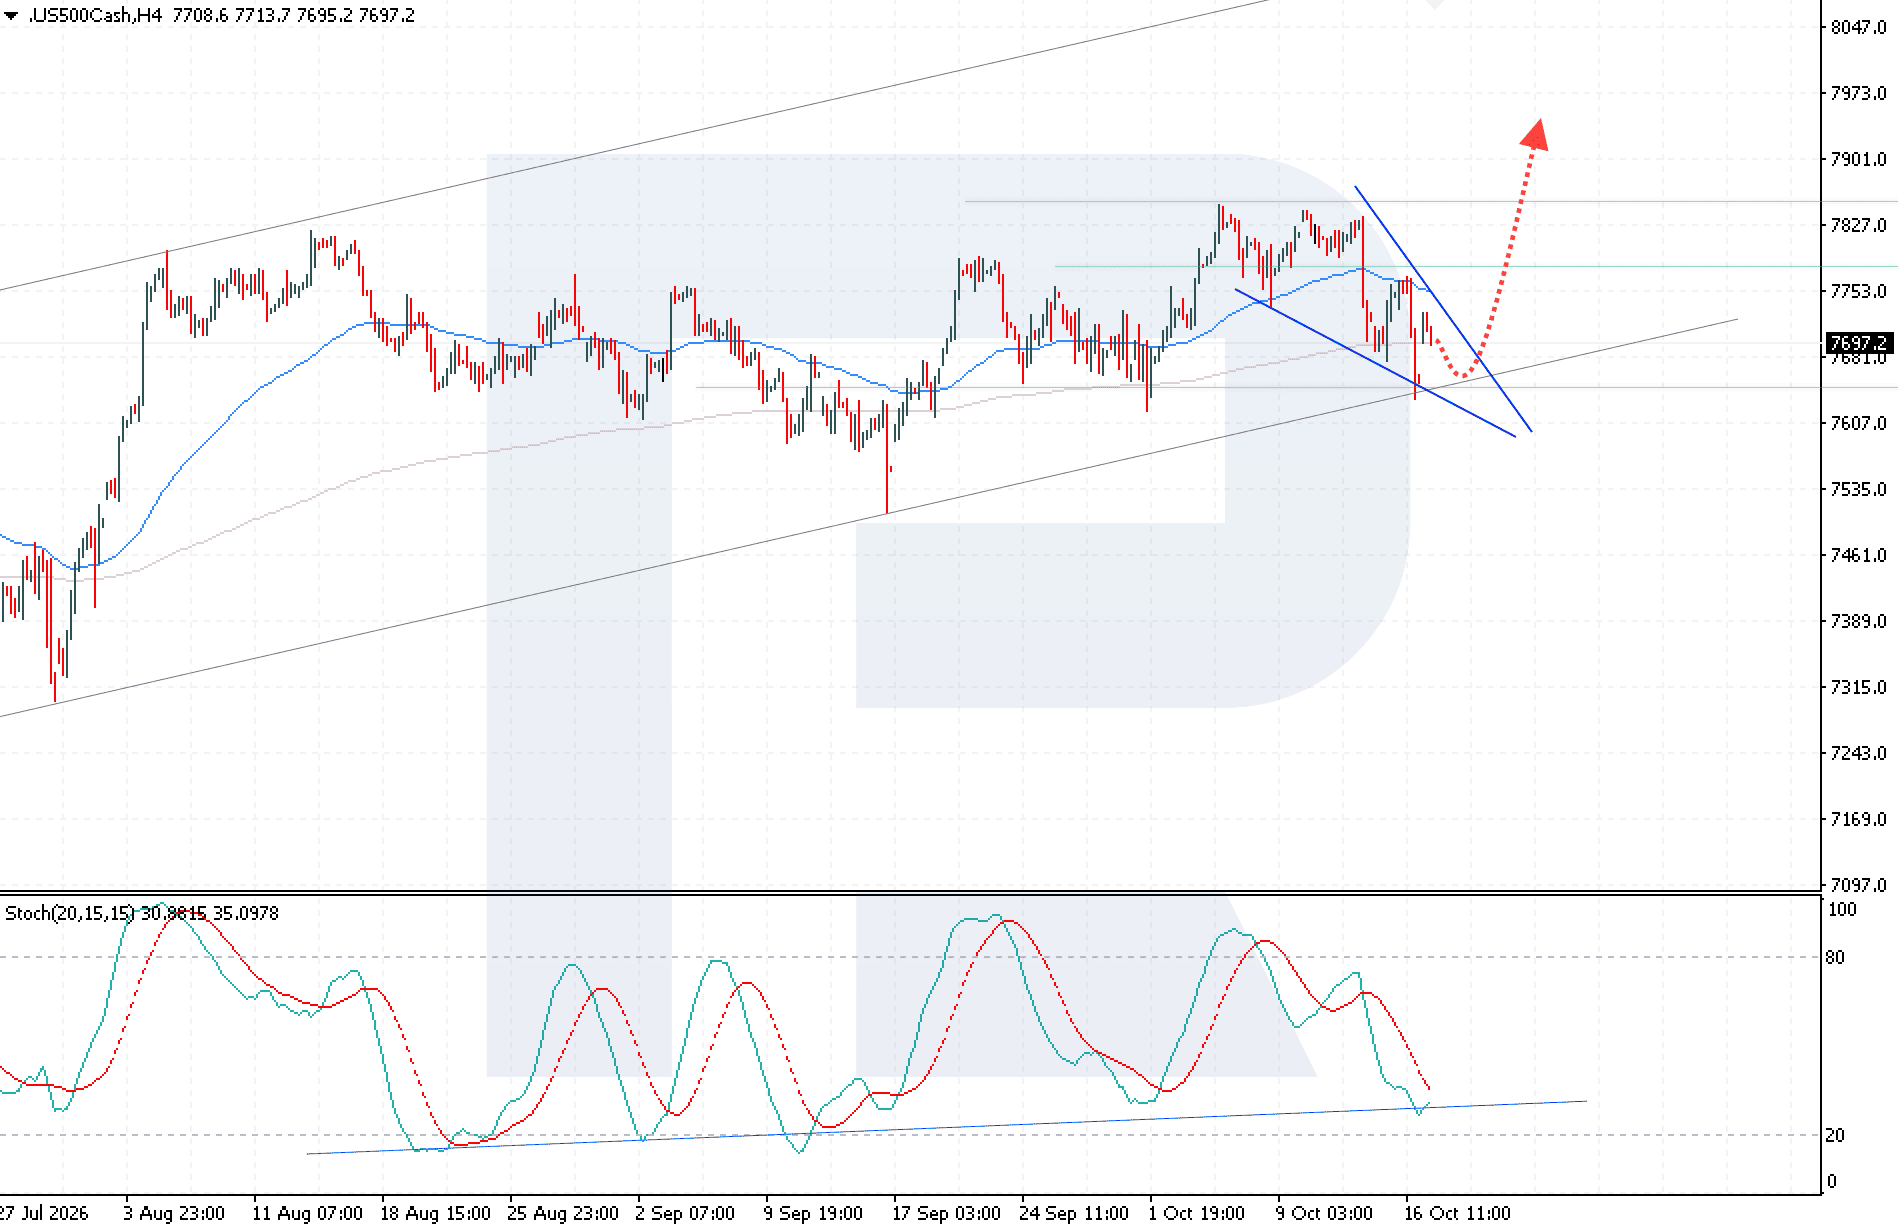
US 500 trading scenario
US Tech technical analysis
The US Tech index is undergoing a correction, approaching a key support level at 28,880, while a strong resistance level is located at 29,780. At the start of the trading week, there is a risk of testing support and attempting to consolidate below it.
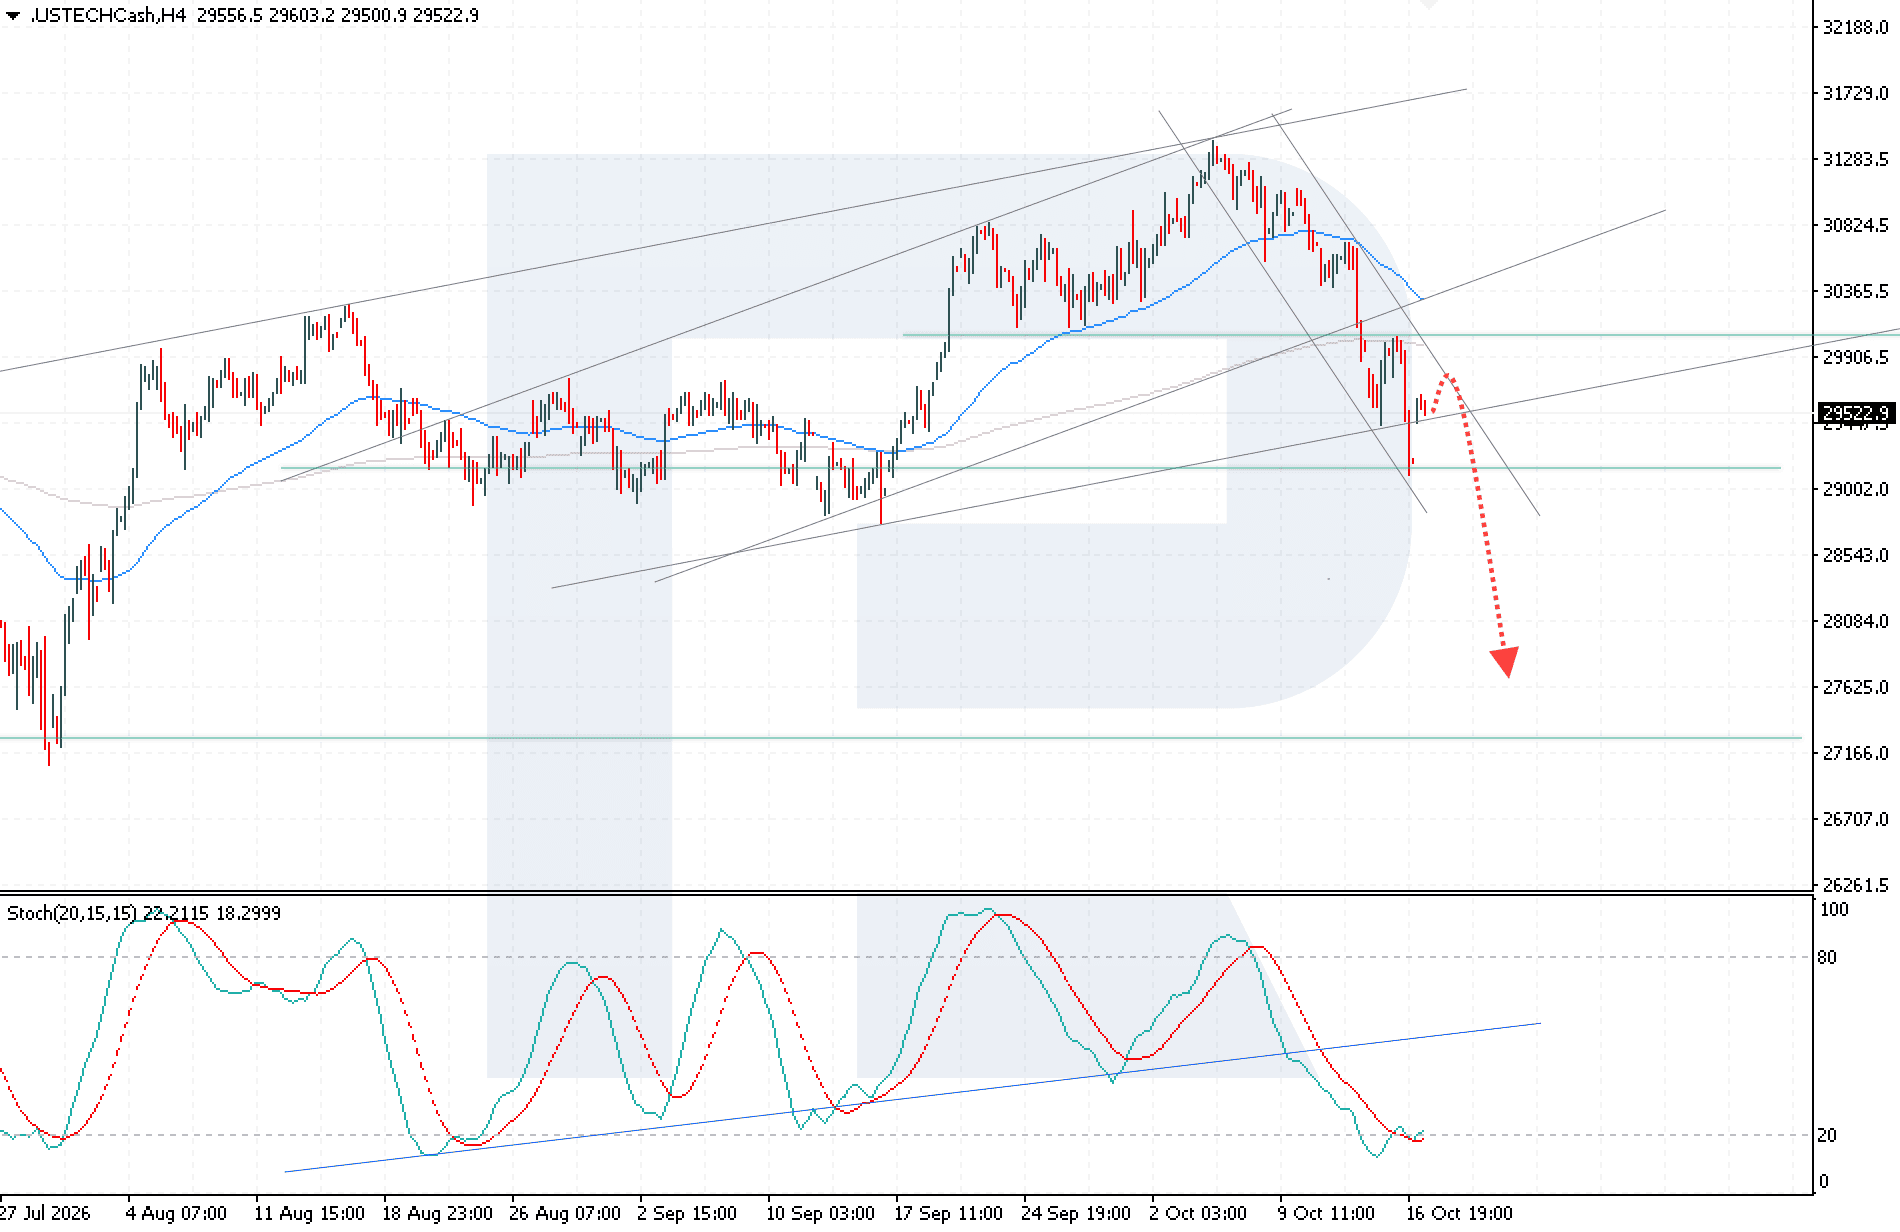
US Tech trading scenario
US 30 technical analysis
The US 30 is declining after two consecutive weeks of gains. Buyers have defended the key support level at 50,680, but bearish pressure persists. The key resistance level is located at 52,410.
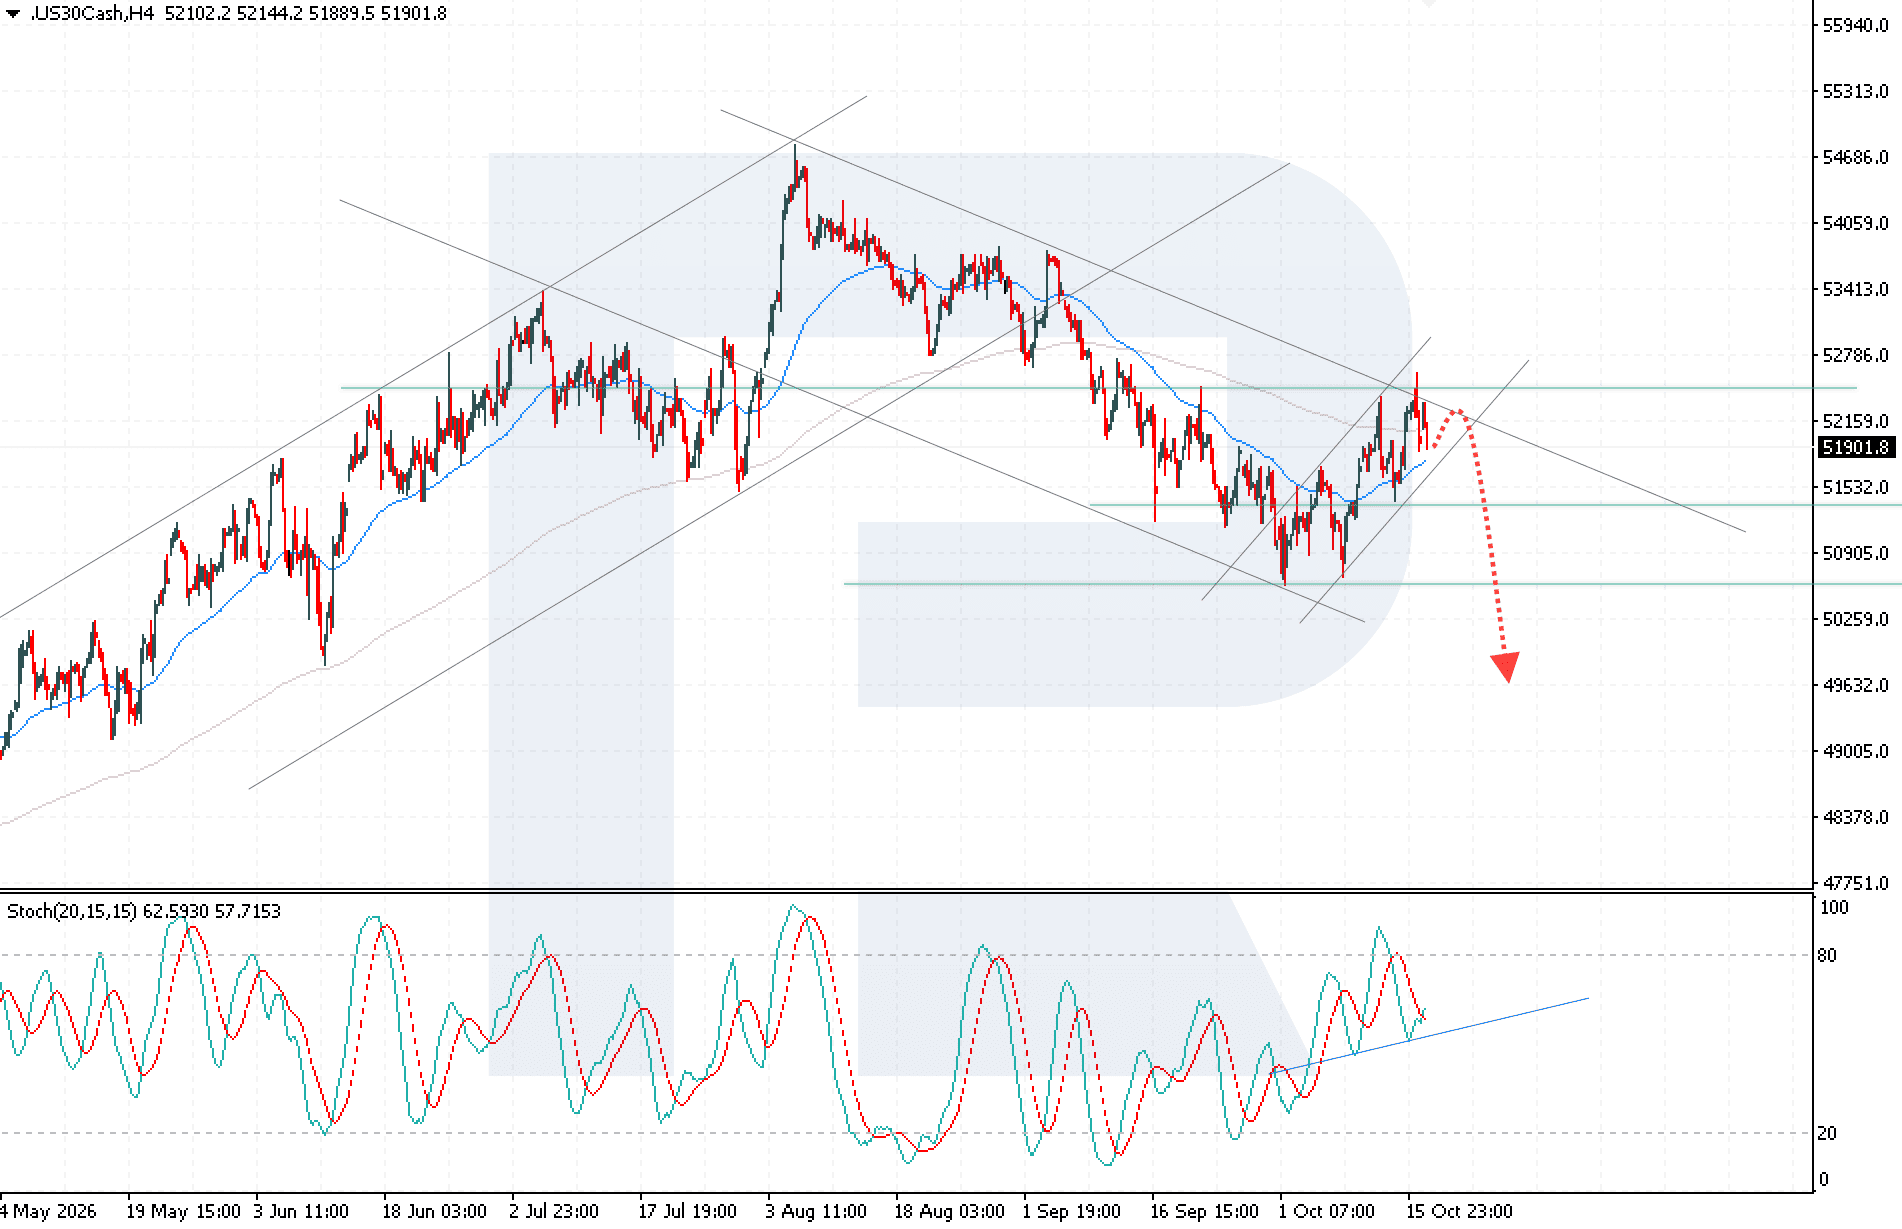
US 30 trading scenario
European index forecast: DE 40
Fundamental analysis
Last week, the German stock market staged a recovery. During 12–16 October, the DAX gained approximately 2.1% and reached 25,623 points on Friday, rising by 0.95% for the day. The market was supported by easing concerns about artificial intelligence spending and interest rates, as well as gains in industrial and automotive shares. However, prices are already declining.
This week, investors will focus on Germany's ZEW economic sentiment index, due on Tuesday, 20 October. The previous reading was 34.7 points, while the forecast suggests a decline to 30.2 points. A stronger result could support the DE 40 by indicating improved expectations for the German economy, while a further deterioration in sentiment could increase pressure on the index.
DE 40 technical analysis
The DE 40 index is falling after rebounding from the 25,525 resistance level. The key support area is located at 25,055. Bearish pressure persists.
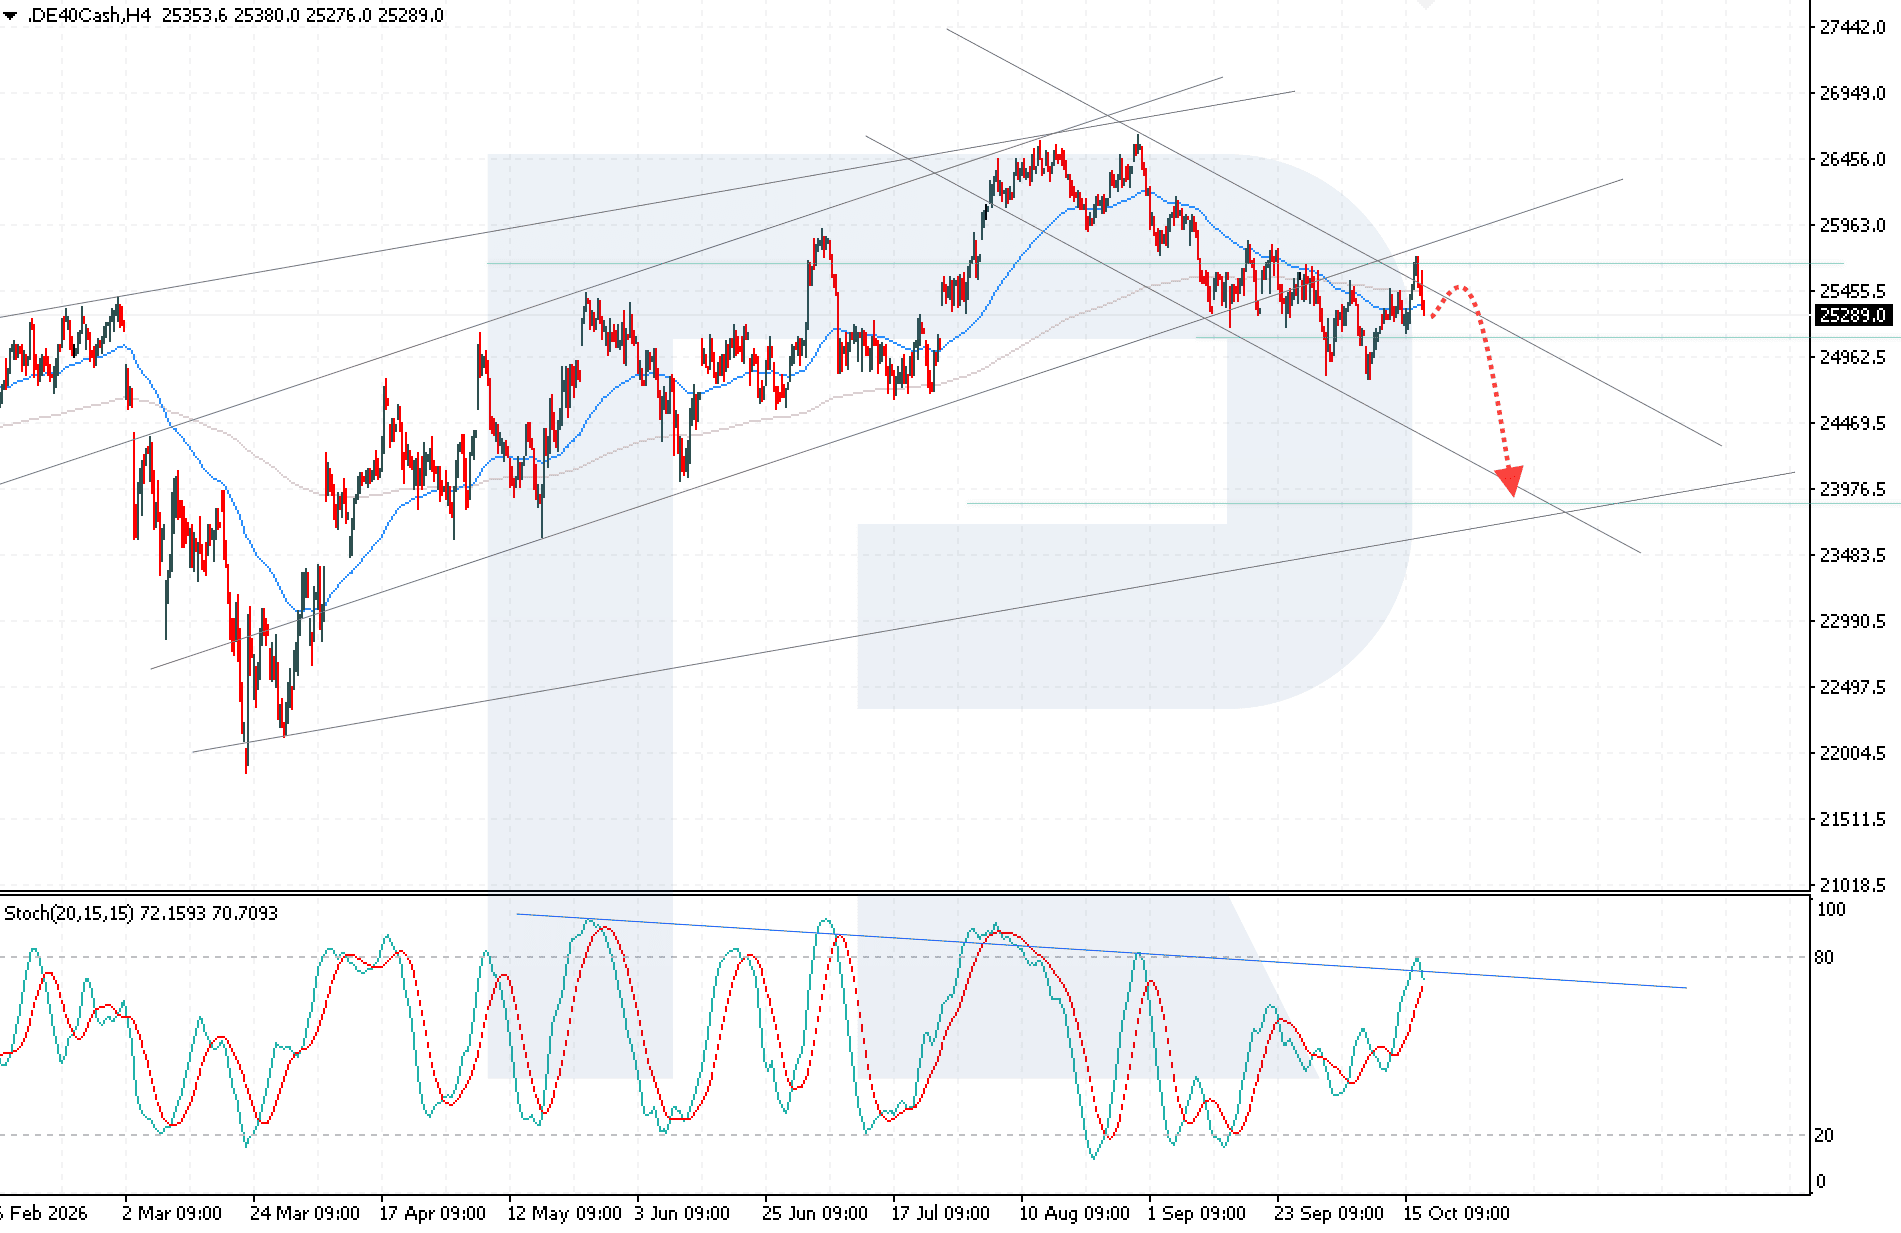
DE 40 trading scenario
Asian index forecast: JP 225
Fundamental analysis
Last week, the Japanese stock market faced significant selling pressure. During 12–16 October, the Nikkei 225 fell by 5.37% to 65,324 points following a sharp sell-off in technology stocks. On Thursday, the index lost almost 4.9% in a single session amid concerns over the sustainability of artificial intelligence investment and rising financing costs.
This week, investors will focus on Japan's September trade balance, scheduled for release on 21 October, and consumer inflation figures expected on 23 October. The previous core Consumer Price Index reading was 1.7% year-on-year, while the forecast suggests a decline to 1.4%. Higher inflation readings could fuel expectations of further monetary tightening by the Bank of Japan and put pressure on the JP 225.
JP 225 technical analysis
The JP 225 index is on the rise, with buyers holding on to the key support level at 63,205. Key resistance is located at 67,045. Despite a local decline, the bullish trend is expected to remain intact.
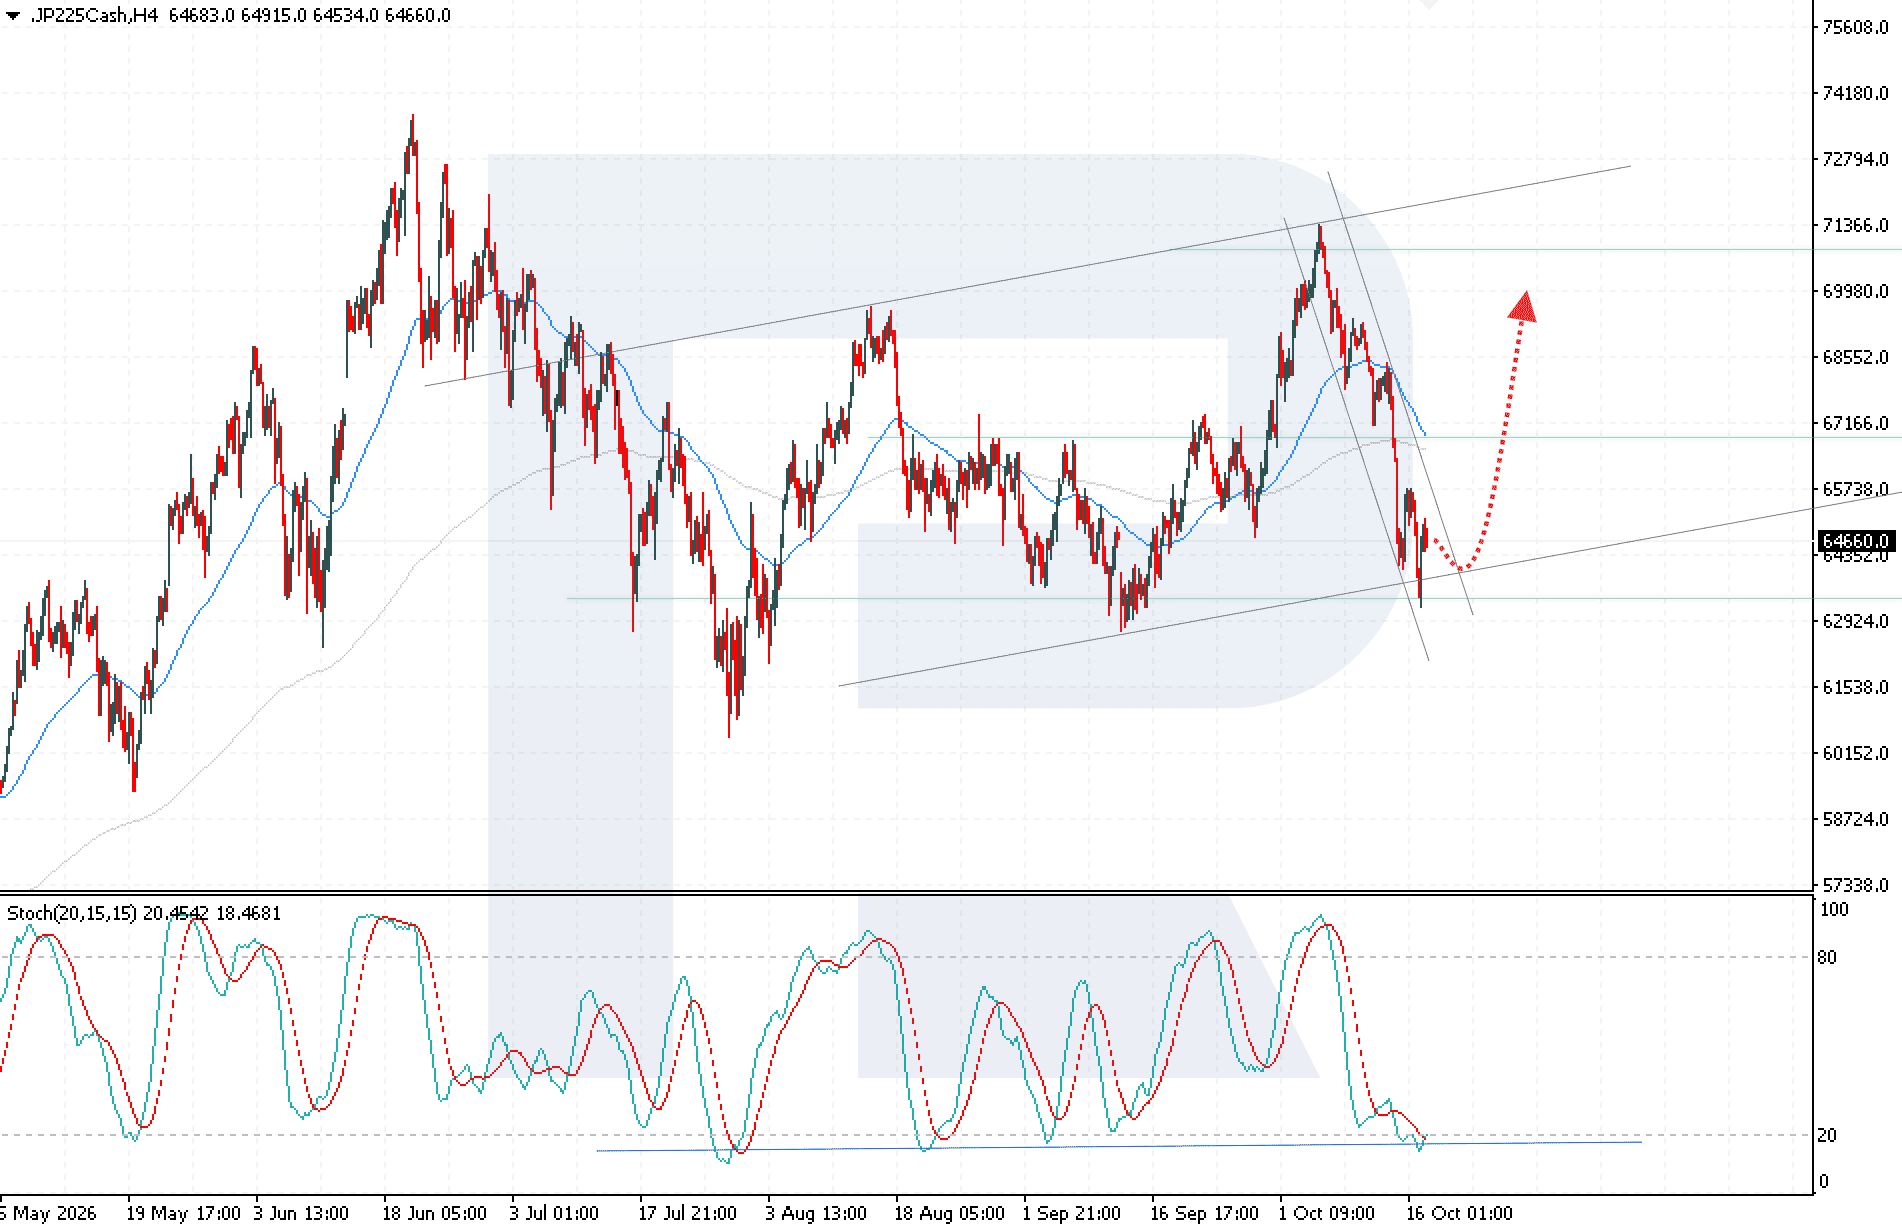
JP 225 trading scenario
Summary and what to watch this week
Overall stock market sentiment remains cautious following a broad sell-off in technology shares. This week, the focus will be on Tesla and Meta's quarterly earnings due on Wednesday, US housing and labour market data, and the consumer sentiment index on Friday. For the DE 40, the key event will be Tuesday's ZEW index release, while Japan's trade statistics and inflation data will be crucial for the JP 225.
Editors’ picks


EURUSD forecast 2026–2027: technical analysis, price levels & predictions
The EURUSD outlook for 2026 and 2027: key levels on the daily chart, three trading scenarios and the policy gap between the Fed and the ECB that drives the pair.

Gold (XAUUSD) forecast 2026: technical analysis, price levels & predictions
Where gold could trade in 2026: key levels, three trading scenarios with entry triggers and the forecasts from J.P. Morgan, Deutsche Bank and Goldman Sachs.
Forecasts presented in this section only reflect the author’s private opinion and should not be considered as guidance for trading. RoboForex bears no responsibility for trading results based on trading recommendations described in these analytical reviews.