
Stock market outlook for the week of 26–30 October 2026: key levels for world indices
Stock market outlook for 26–30 October 2026: the Fed and ECB meetings, inflation trends, and corporate earnings will have the greatest impact on global stock markets this week. For US indices, the main drivers remain expectations surrounding the Fed's interest rate decision and earnings reports from major technology companies. The German market is particularly dependent on the state of the eurozone economy. In Japan, the yen exchange rate and Bank of Japan policy play a key role.
Key levels for the week
| Instrument | Week | Support | Resistance | Scenario |
|---|---|---|---|---|
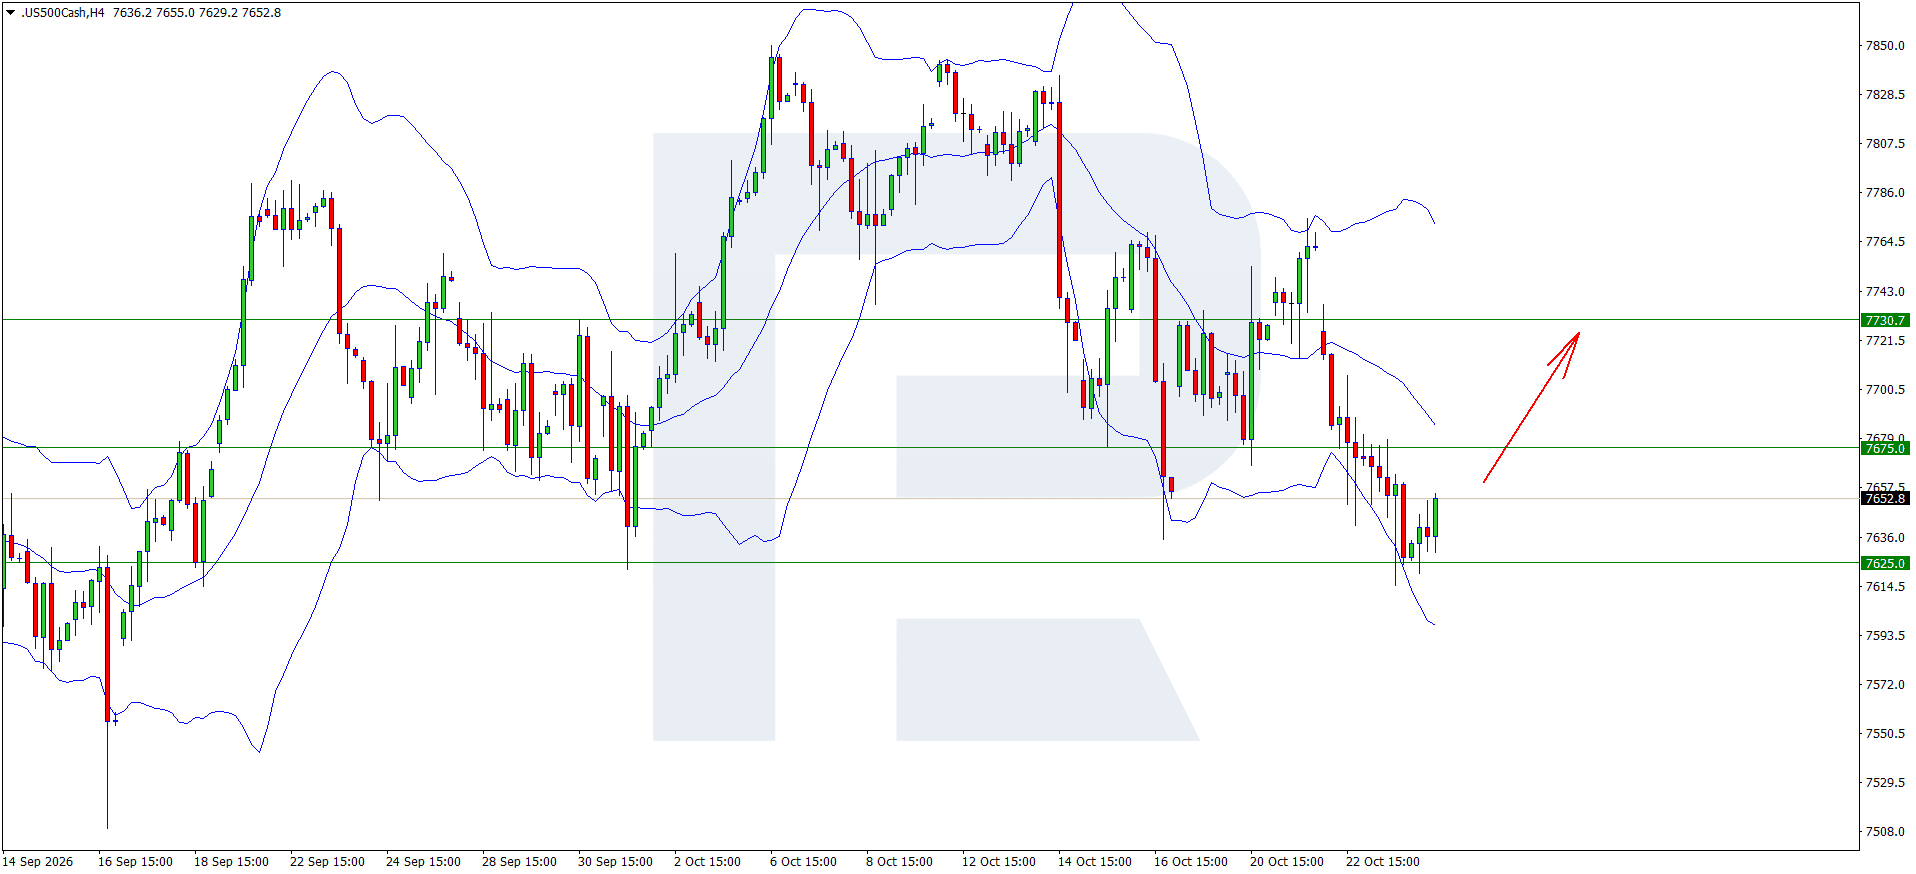
| US 500 | +1.01% | 7,625.0 | 7,730.0 | Buy from 7,625.0 |
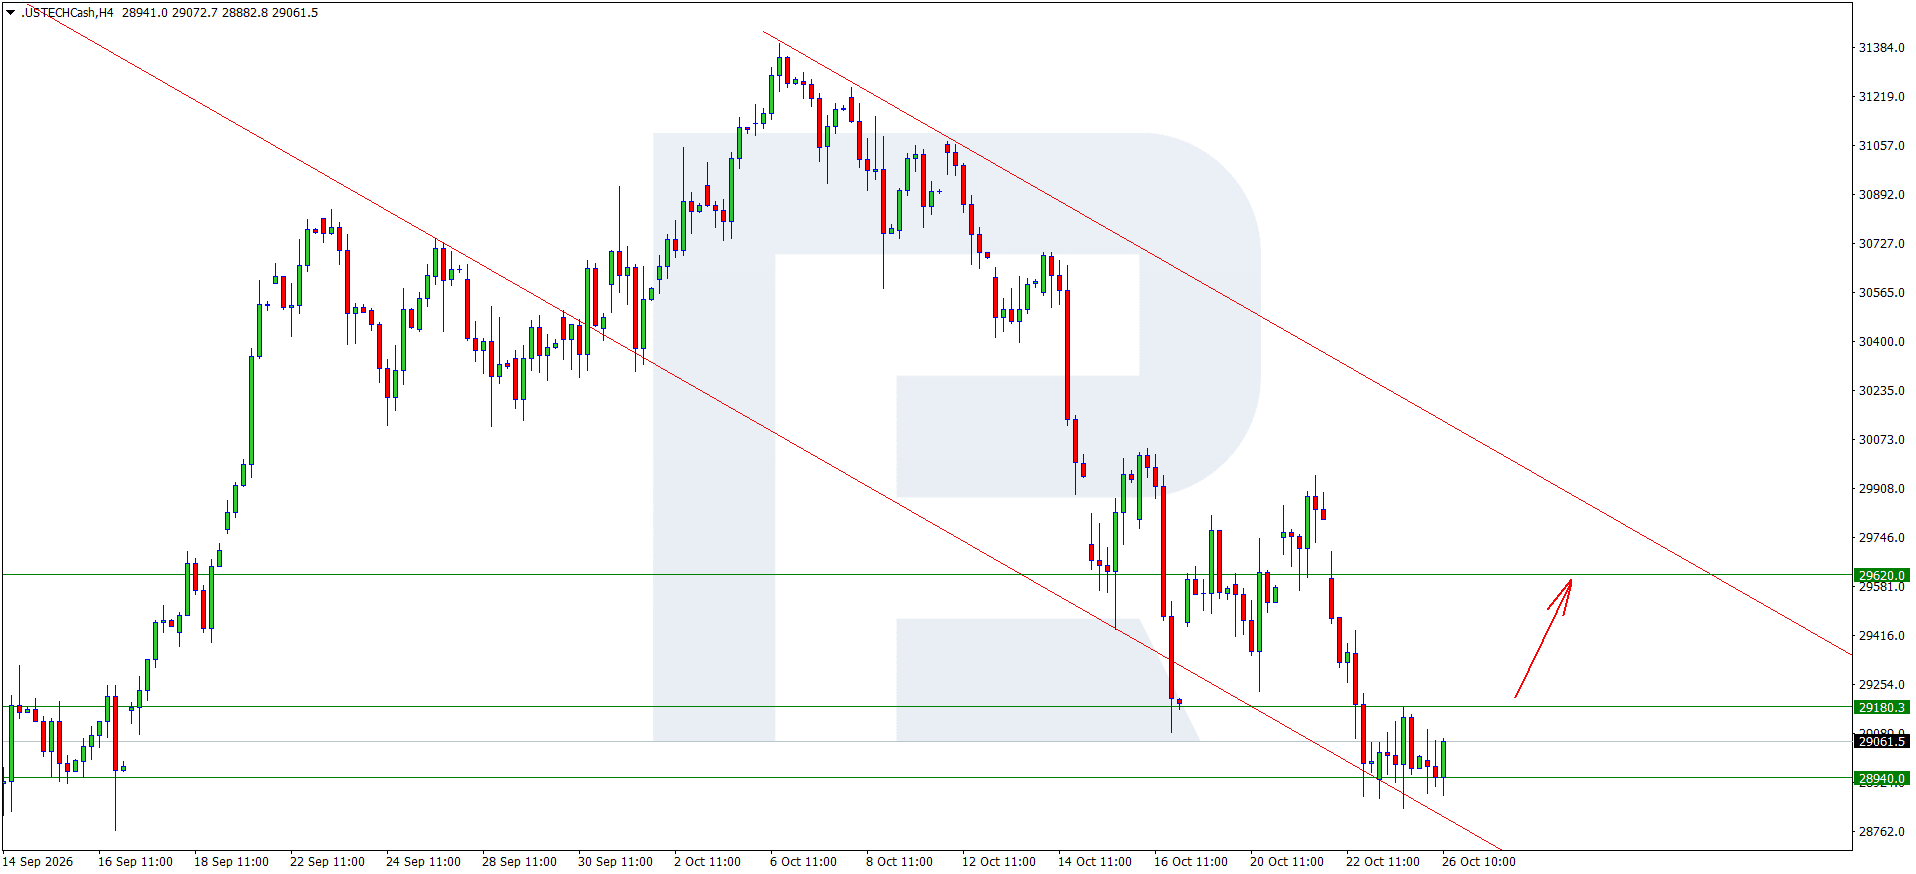
| US Tech | +1.78% | 28,940.0 | 29,620.0 | Buy from 29,180.0 |
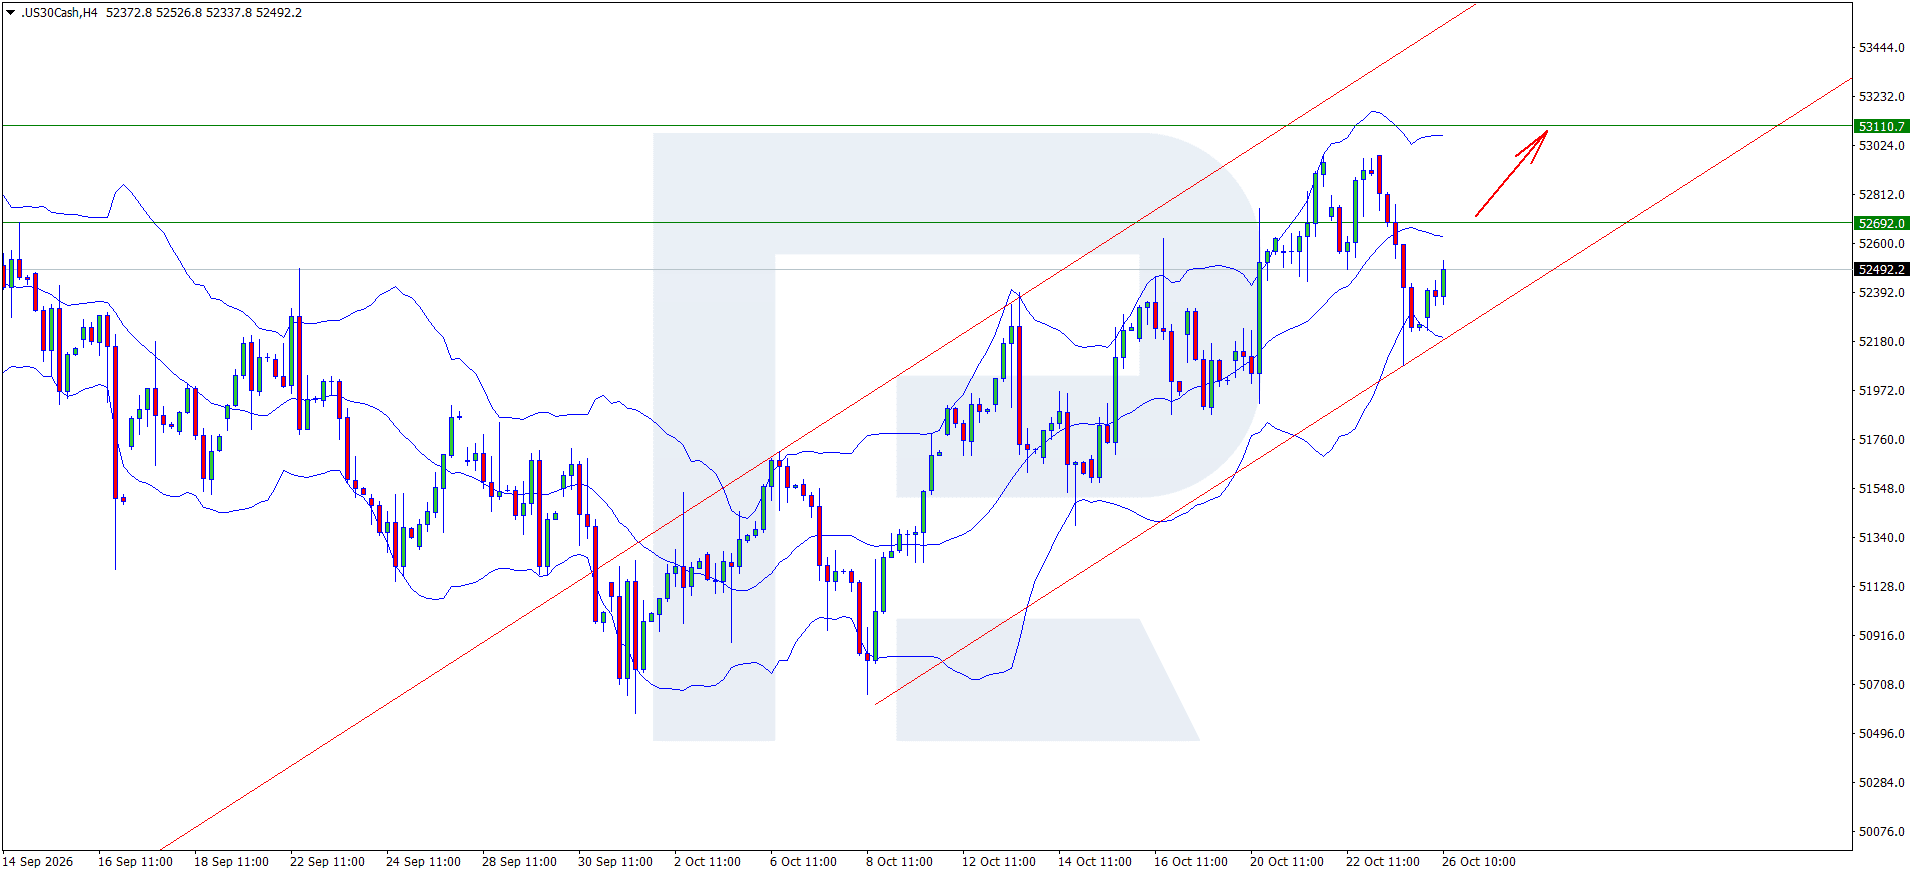
| US 30 | +1.17% | 52,230.0 | 53,110.0 | Buy from 52,692.0 |
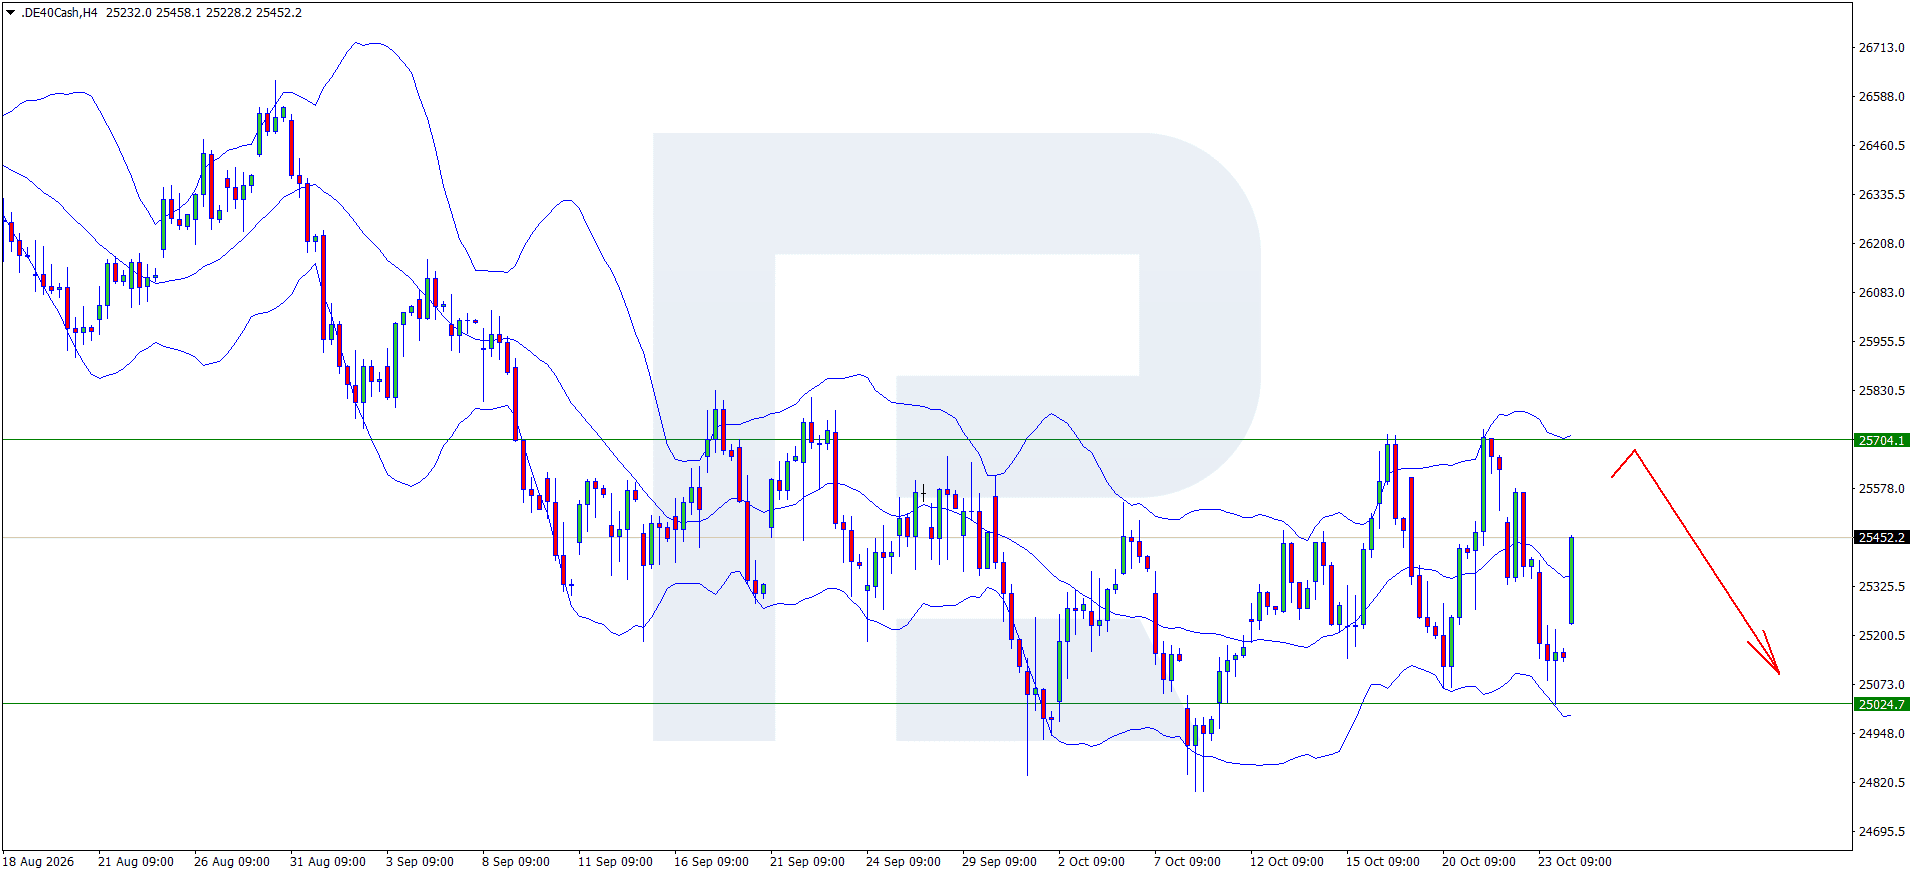
| DE 40 | +5.59% | 25,024.0 | 25,704.0 | Sell from 25,704.0 |
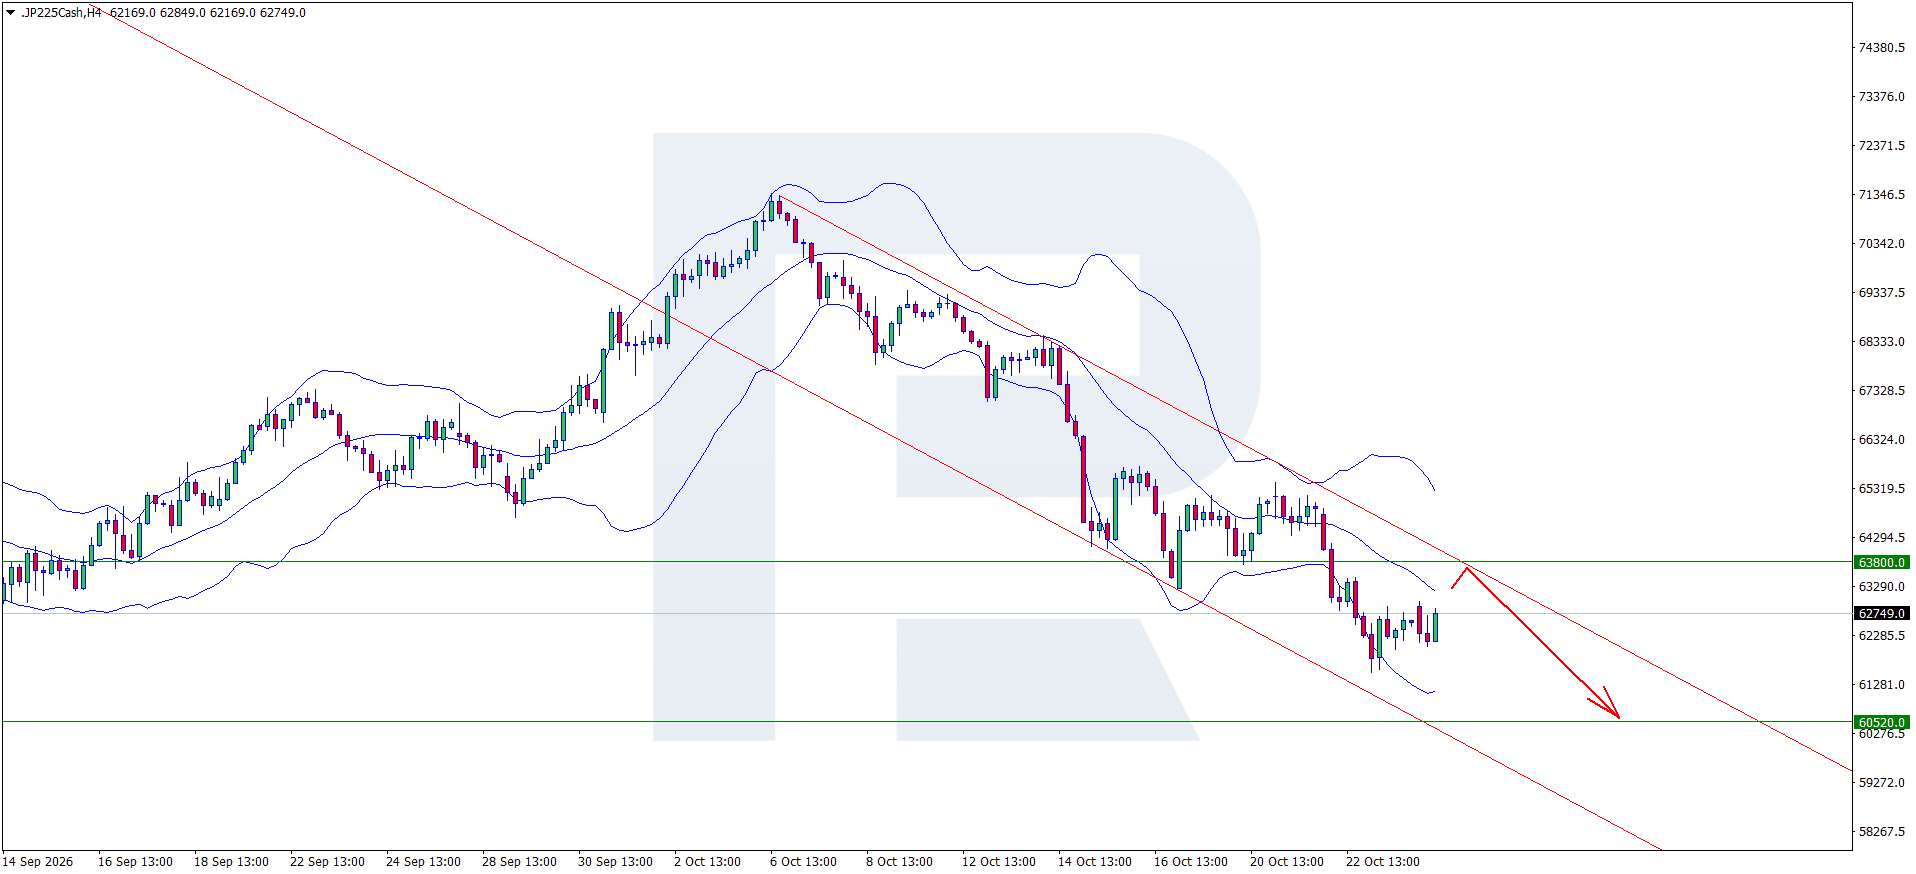
| JP 225 | +1.33% | 60,520.0 | 63,800.0 | Sell from 63,800.0 |
Events that can move indices this week
| Date | Event | Instruments affected |
|---|---|---|
| Wednesday, 28 October 2026 | Fed interest rate decision | The indicator reflects the strength of the USD and the state of the US economy. |
| Wednesday, 28 October 2026 | Microsoft and Alphabet earnings reports after the US market close | Positive earnings figures could generally support the US 500, the US Tech, and the US 30. |
| Thursday, 29 October 2026 | US Q3 GDP | The figures reflect the state of the US economy and could affect the US 500, the US Tech, and the US 30. |
| Thursday, 29 October 2026 | ECB interest rate decision | The indicator reflects the strength of the euro and the state of the eurozone economy. |
| Friday, 30 October 2026 | BoJ interest rate decision | The indicator reflects the strength of the yen and the state of Japan's economy. |
US indices forecast: US 30, US 500, US Tech
Fundamental analysis
The overall backdrop remains mixed, and the market is paying particularly close attention to corporate earnings. As the week begins, investors in US equities are focused on two key questions: how resilient corporate profits will prove to be and what to expect from the Federal Reserve regarding interest rates. Equally important is the impact of high energy prices on inflation and consumer spending. If bond yields continue to rise, appetite for equities could weaken further. At the same time, strong earnings and confident corporate guidance could support the market. However, rising costs, expensive energy, and more cautious signals from the Fed could intensify pressure on shares.
For technology companies, the main question now is whether the huge investments in AI, cloud services, and computing infrastructure are paying off. The market is becoming increasingly demanding when it comes to results. Even if a company beats expectations, this may not be enough unless management demonstrates that growth will continue to accelerate. Strong performance in cloud businesses and tangible benefits from AI investment could support the sector.
For the industrial index, not only Federal Reserve decisions matter, but also the resilience of demand, growth in corporate costs, and trends in energy prices. High energy prices could create additional difficulties for transport and industrial companies. Conversely, robust consumer spending would support a broad range of businesses. Strong reports from industrial and consumer companies could help the US 30. At the same time, weak demand, rising production costs, and persistently high interest rates will weigh on the index.
US 500 technical analysis
The US 500 began the trading week with gains, rebounding from the 7,625 support level. There is a possibility that the price will break above the first resistance level at 7,675 and continue its upward trajectory, with the next upside target on the US 500 H4 chart at the 7,730 resistance level.
US 500 trading scenario
US Tech technical analysis
The US Tech index is undergoing a correction and attempting to rebound from the key support level at 28,940. Resistance is located at 29,180, and a breakout above it could signal a continued correction. The next upside target lies at 29,620.
US Tech trading scenario
US 30 technical analysis
The US 30 is forming another upward wave following a correction. The price could break through 52,692 and head towards the next resistance level at 53,110, continuing the uptrend.
US 30 trading scenario
European index forecast: DE 40
Fundamental analysis
For the German market, industrial conditions, export demand, and energy costs are particularly important. Rising fuel and transport costs could worsen conditions for companies with high production expenses. At the same time, improving business expectations could revive interest in German equities and support the German market.
DE 40 technical analysis
The DE 40 index continues to rise after rebounding from the 25,024 support level. Key resistance is located at 26,704. A rebound from this resistance level would set the stage for another downward wave and the opening of short positions.
DE 40 trading scenario
Asian index forecast: JP 225
Fundamental analysis
The Japanese market is heading into a crucial week, with attention focused primarily on inflation, energy prices, and the yen exchange rate. A weak yen benefits domestic exporters, as it makes their products more competitive, but it also raises the cost of imported fuel and raw materials.
According to preliminary assessments, the Bank of Japan is unlikely to change interest rates, but its comments on further policy tightening and the potential trajectory of inflation will attract just as much attention. If the tone is more hawkish, the yen could strengthen, posing an additional risk to exporters. Resilient demand for Japanese products and strong corporate earnings could support the JP 225. However, if the yen strengthens sharply, external demand weakens, or unexpected hints of rate hikes emerge, the index could come under additional pressure.
JP 225 technical analysis
The JP 225 is undergoing a correction amid the broader downtrend. A rebound from the support level could take the index towards 63,800. The price could then rebound from the 63,800 resistance level and resume its decline, with the downside target at the 60,520 support level.
JP 225 trading scenario
Summary and what to watch this week
The week promises to be packed with fundamental events. The main risk for all five indices is a combination of persistent inflation and high energy prices with a possible tightening of monetary conditions. For US indices, earnings from leading technology companies and the Fed's decision will provide additional catalysts, while signals about domestic economic conditions and the outlook for interest rates will be important for Japan and Germany.
Editors’ picks


EURUSD forecast 2026–2027: technical analysis, price levels & predictions
The EURUSD outlook for 2026 and 2027: key levels on the daily chart, three trading scenarios and the policy gap between the Fed and the ECB that drives the pair.

Gold (XAUUSD) forecast 2026: technical analysis, price levels & predictions
Where gold could trade in 2026: key levels, three trading scenarios with entry triggers and the forecasts from J.P. Morgan, Deutsche Bank and Goldman Sachs.
Forecasts presented in this section only reflect the author’s private opinion and should not be considered as guidance for trading. RoboForex bears no responsibility for trading results based on trading recommendations described in these analytical reviews.