
Stock market outlook for the week of 2–6 November 2026: key levels for world indices
Global stock markets enter November amid heightened political and economic uncertainty. The main event of the week will be the US congressional midterm elections on 3 November, which could change investors' expectations regarding fiscal, tax, and trade policy. On Friday, attention will shift to the US labour market, with the October Nonfarm Payrolls report serving as an important guide for further forecasts of the Federal Reserve's interest rate.
The election results, macroeconomic data, and corporate earnings could determine the direction of global indices over the coming trading sessions.
Key levels for the week
| Instrument | Week | Support | Resistance | Scenario |
|---|---|---|---|---|
| US 500 | −2.09% | 7,535.0 | 7,745.0 | Sell below 7,580.0 |
| US Tech | −3.70% | 27,900.0 | 29,650.0 | Sell below 28,380.0 |
| US 30 | −2.08% | 51,430.0 | 52,780.0 | Sell below 51,750.0 |
| DE 40 | 3.29% | 25,335.0 | 26,305.0 | Buy from 26,050.0 |
| JP 225 | −3.29% | 61,080.0 | 64,240.0 | Sell below 62,650.0 |
Events that can move indices this week
| Date | Event | Instruments affected |
|---|---|---|
| Monday, 2 November 2026 | US ISM manufacturing PMI for October | US 500 and US 30: assesses the state of manufacturing and demand prospects |
| Tuesday, 3 November 2026 | US congressional midterm elections | All five indices: political uncertainty and global risk appetite |
| Tuesday, 3 November 2026 | US JOLTS job openings | US 500, US Tech, and US 30: expectations regarding Fed policy |
| Wednesday, 4 November 2026 | Eurozone preliminary inflation for October | DE 40: inflation expectations and the outlook for ECB interest rates |
| Wednesday, 4 November 2026 | US ISM services PMI | US 500, US Tech, and US 30: activity in the largest sector of the US economy |
| Thursday, 5 November 2026 | Bank of England interest rate decision | DE 40: sentiment on the European stock market |
| Friday, 6 November 2026 | US Nonfarm Payrolls and unemployment for October | All indices: bond yields, the dollar, and global risk appetite |
US indices forecast: US 30, US 500, and US Tech
Fundamental analysis
The US stock market enters the first week of November amid heightened political uncertainty. The midterm elections on 3 November will determine the future balance of power in Congress and could change investors' expectations regarding tax initiatives, government spending, and trade restrictions. A divided Congress could limit the scope for new legislation while also increasing the risk of budget disputes. Market reaction will therefore depend not only on the final distribution of seats but also on how closely the results match investors' prior expectations.
The second key factor will be US employment data. The October Nonfarm Payrolls report is due on Friday: according to the calendar provided, the forecast is for employment to rise by 40 thousand after a previous increase of 29 thousand, while unemployment may remain at 4.2%. Weak figures could fuel expectations of further monetary easing by the Federal Reserve. However, an excessively sharp deterioration in the labour market would also increase concerns about the resilience of the US economy. Strong data, by contrast, would support economic growth forecasts but could push up government bond yields and intensify pressure on equities.
For the technology sector, corporate earnings, and the assessment of returns on AI investment will remain additional factors. Investors are becoming more demanding about profit forecasts and the pace at which spending on cloud services, computing infrastructure, and AI is monetised. Even strong financial results may not be enough to sustain share price gains unless companies confirm expectations of further business acceleration.
The industrial US 30 will be sensitive to manufacturing activity, consumer demand, and corporate spending. Improving ISM figures could support cyclical companies, while labour market weakness, high energy prices, and high borrowing costs will limit the potential for recovery. Overall, the week is likely to bring elevated volatility for US indices, with the primary risk coming from a combination of political uncertainty and signs of economic slowdown.
US 500 technical analysis
The US 500 ended October near 7,594.5, falling below the middle Bollinger Band and approaching the crucial support area at 7,535–7,540. Recent trading sessions indicate growing selling pressure following a failure to consolidate above 7,745. MACD is moving into negative territory, while the Stochastic Oscillator reflects weakening short-term momentum.
A breakout below 7,580 could confirm a downward correction, with the nearest target at 7,435. If selling pressure intensifies further, the price could fall to 7,330. However, the long-term ascending trendline runs near 7,535, so a sustained rebound from this area and a recovery above 7,745 could revive buying interest.
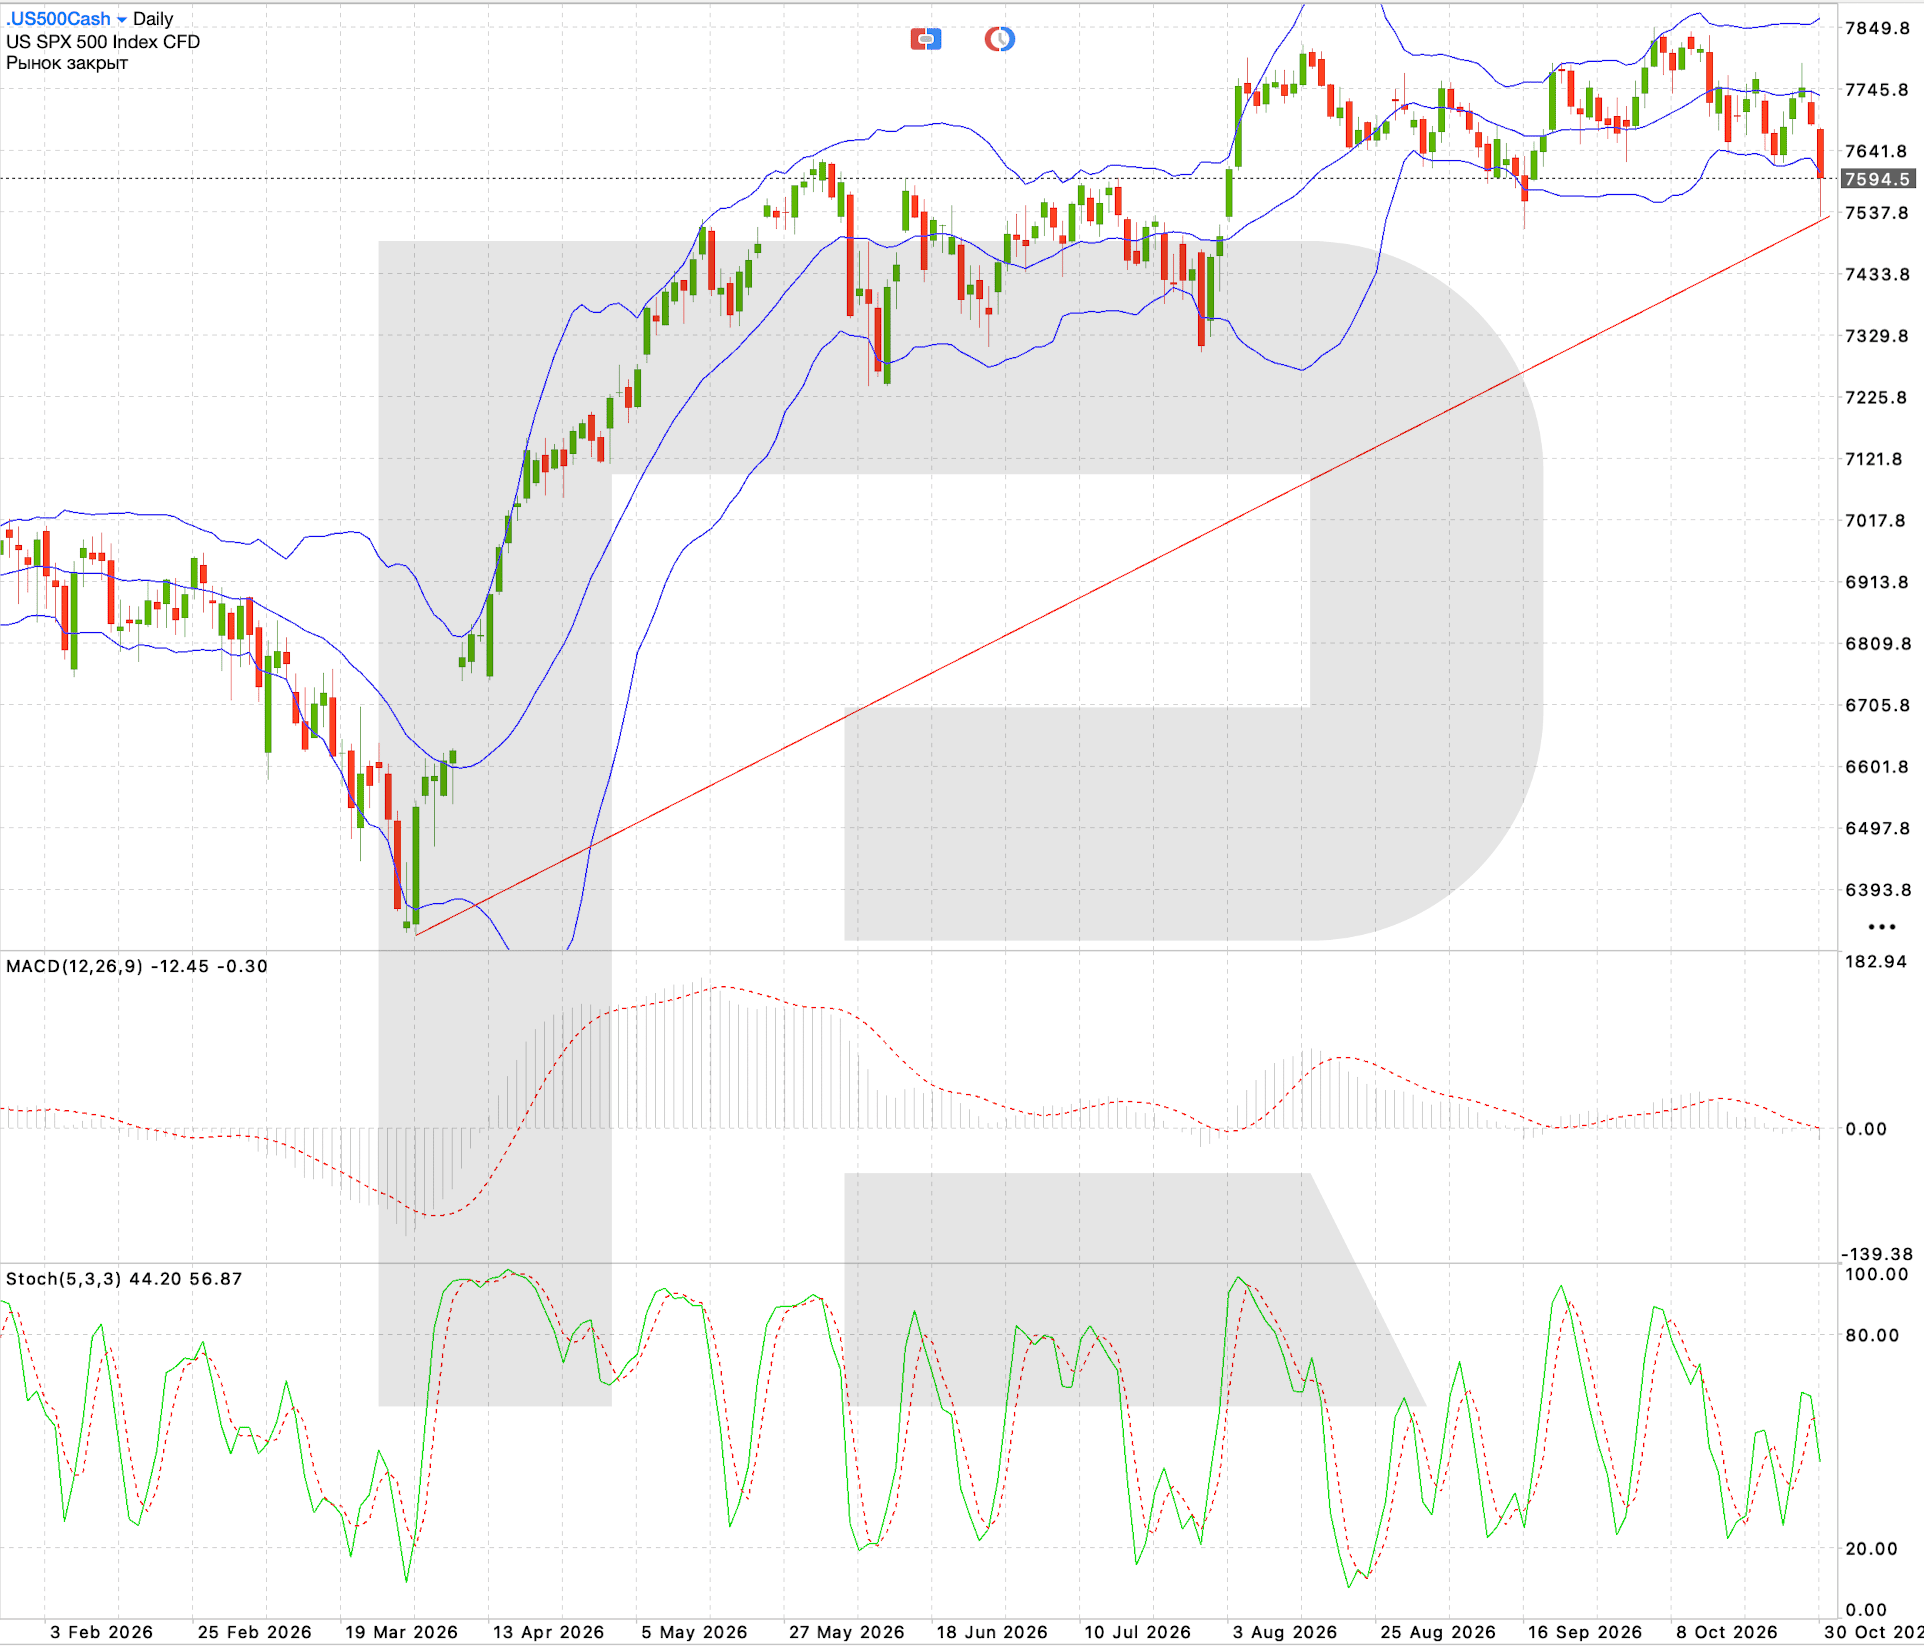
US 500 trading scenario
US Tech technical analysis
The US Tech index is showing the steepest decline among US stock indices. The price has fallen to 28,433.2, breaking below the middle Bollinger Band and approaching the lower boundary of the trading range. MACD remains in negative territory, indicating persistent selling pressure. The Stochastic Oscillator also confirms weakness in short-term momentum.
A consolidation below 28,380 would open the door for a further decline, first towards 27,900 and then 27,380. The nearest significant resistance level is around 29,070, while a stronger supply zone lies near 29,650. A recovery above these levels could signal the end of the current correction, but for now the technical outlook remains predominantly bearish.
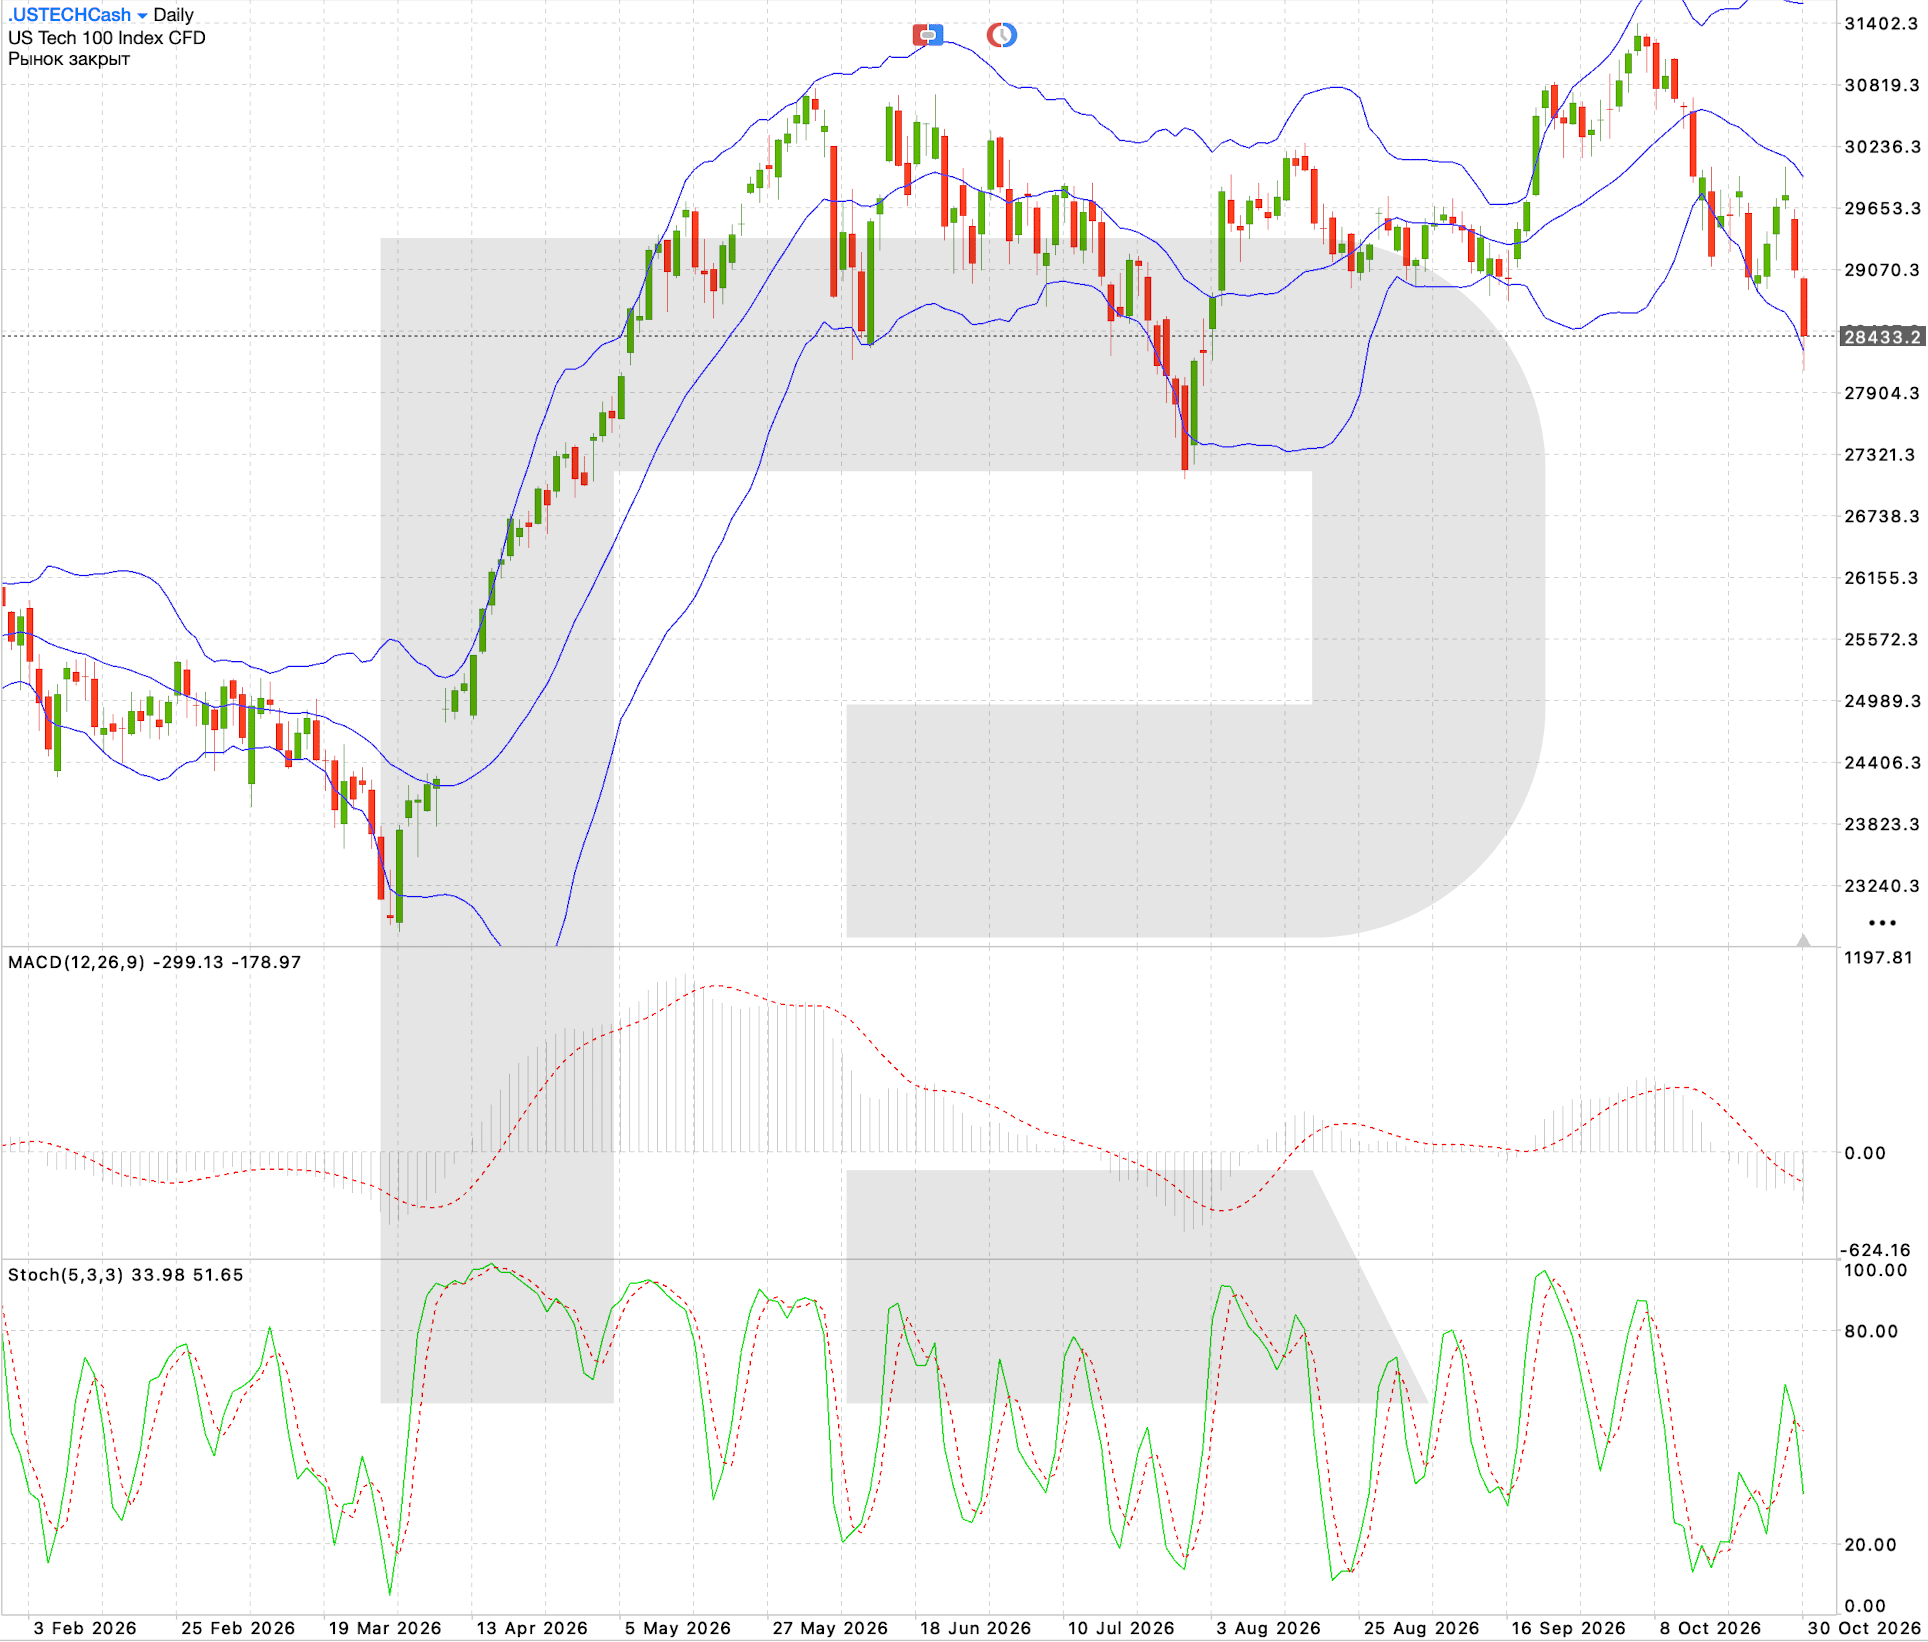
US Tech trading scenario
US 30 technical analysis
The US 30 index ended October near 51,828.2 after failing to recover towards 52,800. The price has dropped below the middle Bollinger Band again, indicating weakening buying activity. MACD remains positive, but recovery momentum is slowing, while the Stochastic Oscillator is turning down.
The 51,750–51,430 area is key support. A breakout below 51,750 could trigger another downward wave towards 50,750. Meanwhile, a recovery above 52,250 would set the stage for a retest of the 52,780 resistance level and weaken the short-term bearish scenario.
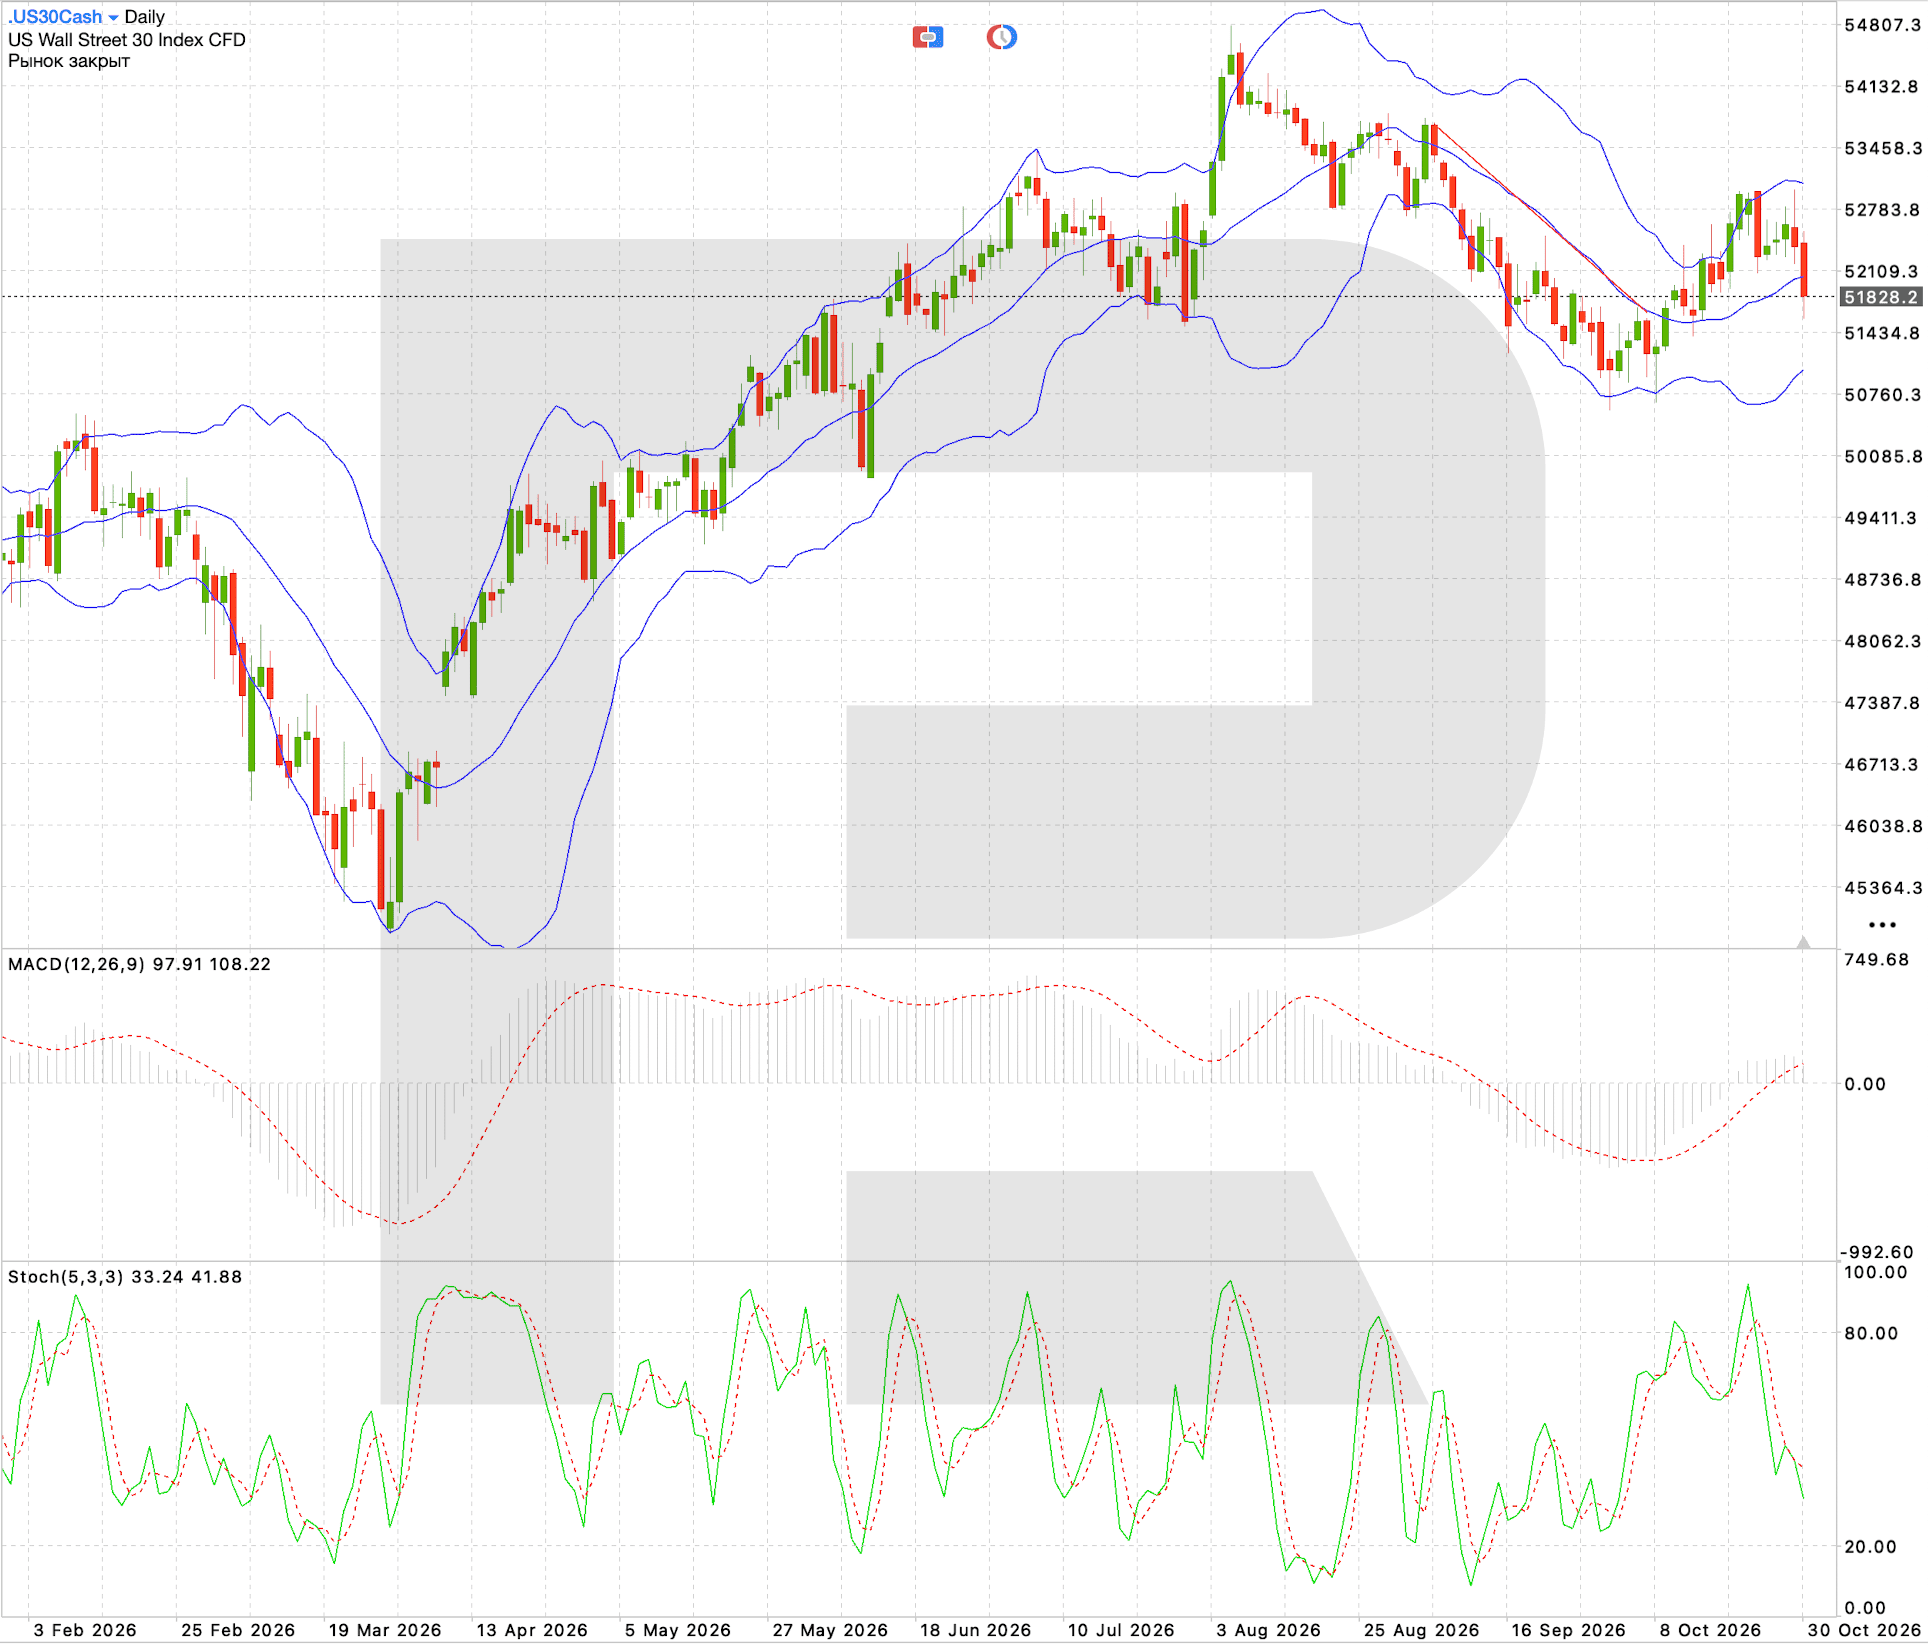
US 30 trading scenario
European index forecast: DE 40
Fundamental analysis
The German stock market begins November attempting to recover amid inflation risks and uncertainty in industry. The key event in Europe this week will be the publication of the preliminary inflation estimate for the eurozone for October. According to the calendar provided, the figure could reach 3.8% year-on-year, keeping the question of the ECB's future interest rate path in focus. Higher inflation could limit expectations of monetary easing and put pressure on European equities.
For Germany, industrial conditions, export demand, and energy costs are also important. High production costs continue to create difficulties for engineering, chemical, and automotive companies. At the same time, improving business expectations and signs of stabilisation in global trade could support interest in German stocks.
A favourable scenario for the DE 40 would combine moderate inflation, a stable euro, and a recovery in industrial demand. However, a deteriorating external backdrop could limit the current upward momentum.
DE 40 technical analysis
The DE 40 index closed October near 25,802.4, maintaining an attempt to recover after a correction towards the 25,010 area. The price is hovering above the middle Bollinger Band, while MACD is gradually building positive momentum. The Stochastic Oscillator is near overbought territory, increasing the likelihood of a short-term pullback before growth resumes.
A consolidation above 26,050 would pave the way for a move towards the 26,305 resistance level, followed by a test of 26,650. The nearest support is located at 25,335. A loss of the 25,750 level would weaken the recovery momentum and increase the likelihood of another decline towards the range’s lower boundary.
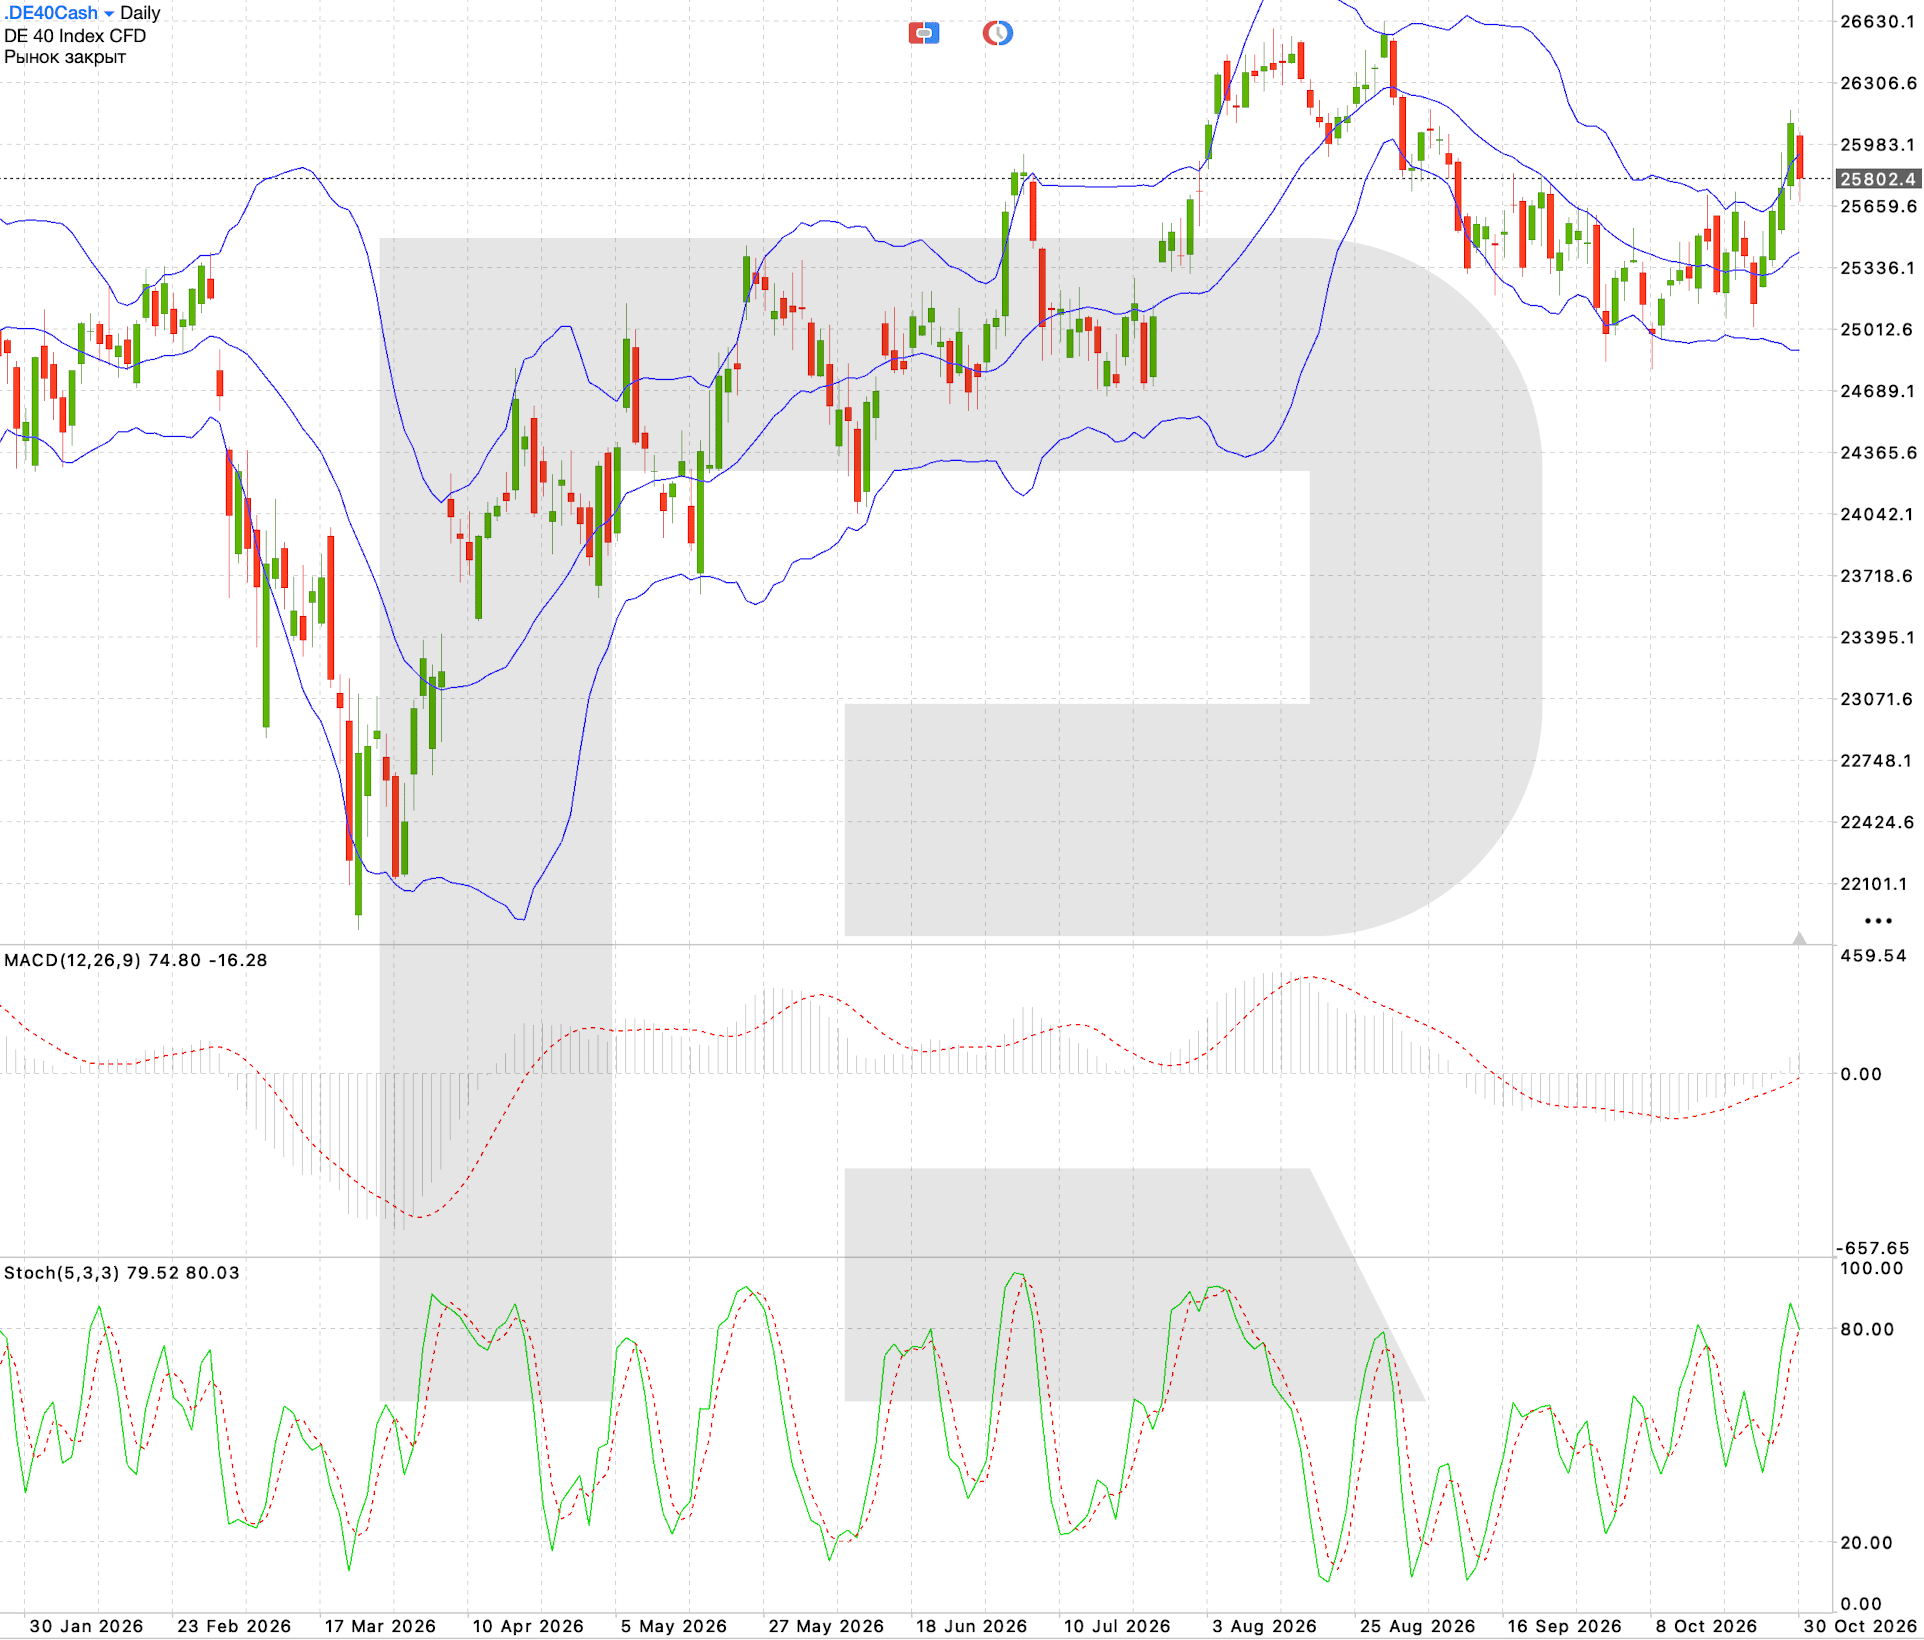
DE 40 trading scenario
Asian index forecast: JP 225
Fundamental analysis
The Japanese stock market enters November under pressure from the technology sector correction and uncertainty over the Bank of Japan's future actions. Following the central bank's October meeting, investors continue to assess the outlook for monetary policy, inflation trends, and the potential impact of interest rates on borrowing costs. The yen exchange rate remains particularly significant, as a stronger yen reduces Japanese exporters' competitiveness and limits their profit growth.
A further risk factor is the global correction in shares of semiconductor manufacturers and companies involved in artificial intelligence. Weakness in the US technology sector could spread to Japan through deteriorating sentiment and revisions to corporate earnings forecasts. At the same time, strong results from Japanese companies and stabilising external demand could support certain market segments.
This week, the US midterm election results and Friday's employment figures will also affect the JP 225. These events could alter the direction of the dollar, government bond yields, and global risk appetite. For now, the balance of factors remains largely unfavourable for the Japanese index, although technical rebounds after an extended decline cannot be ruled out.
JP 225 technical analysis
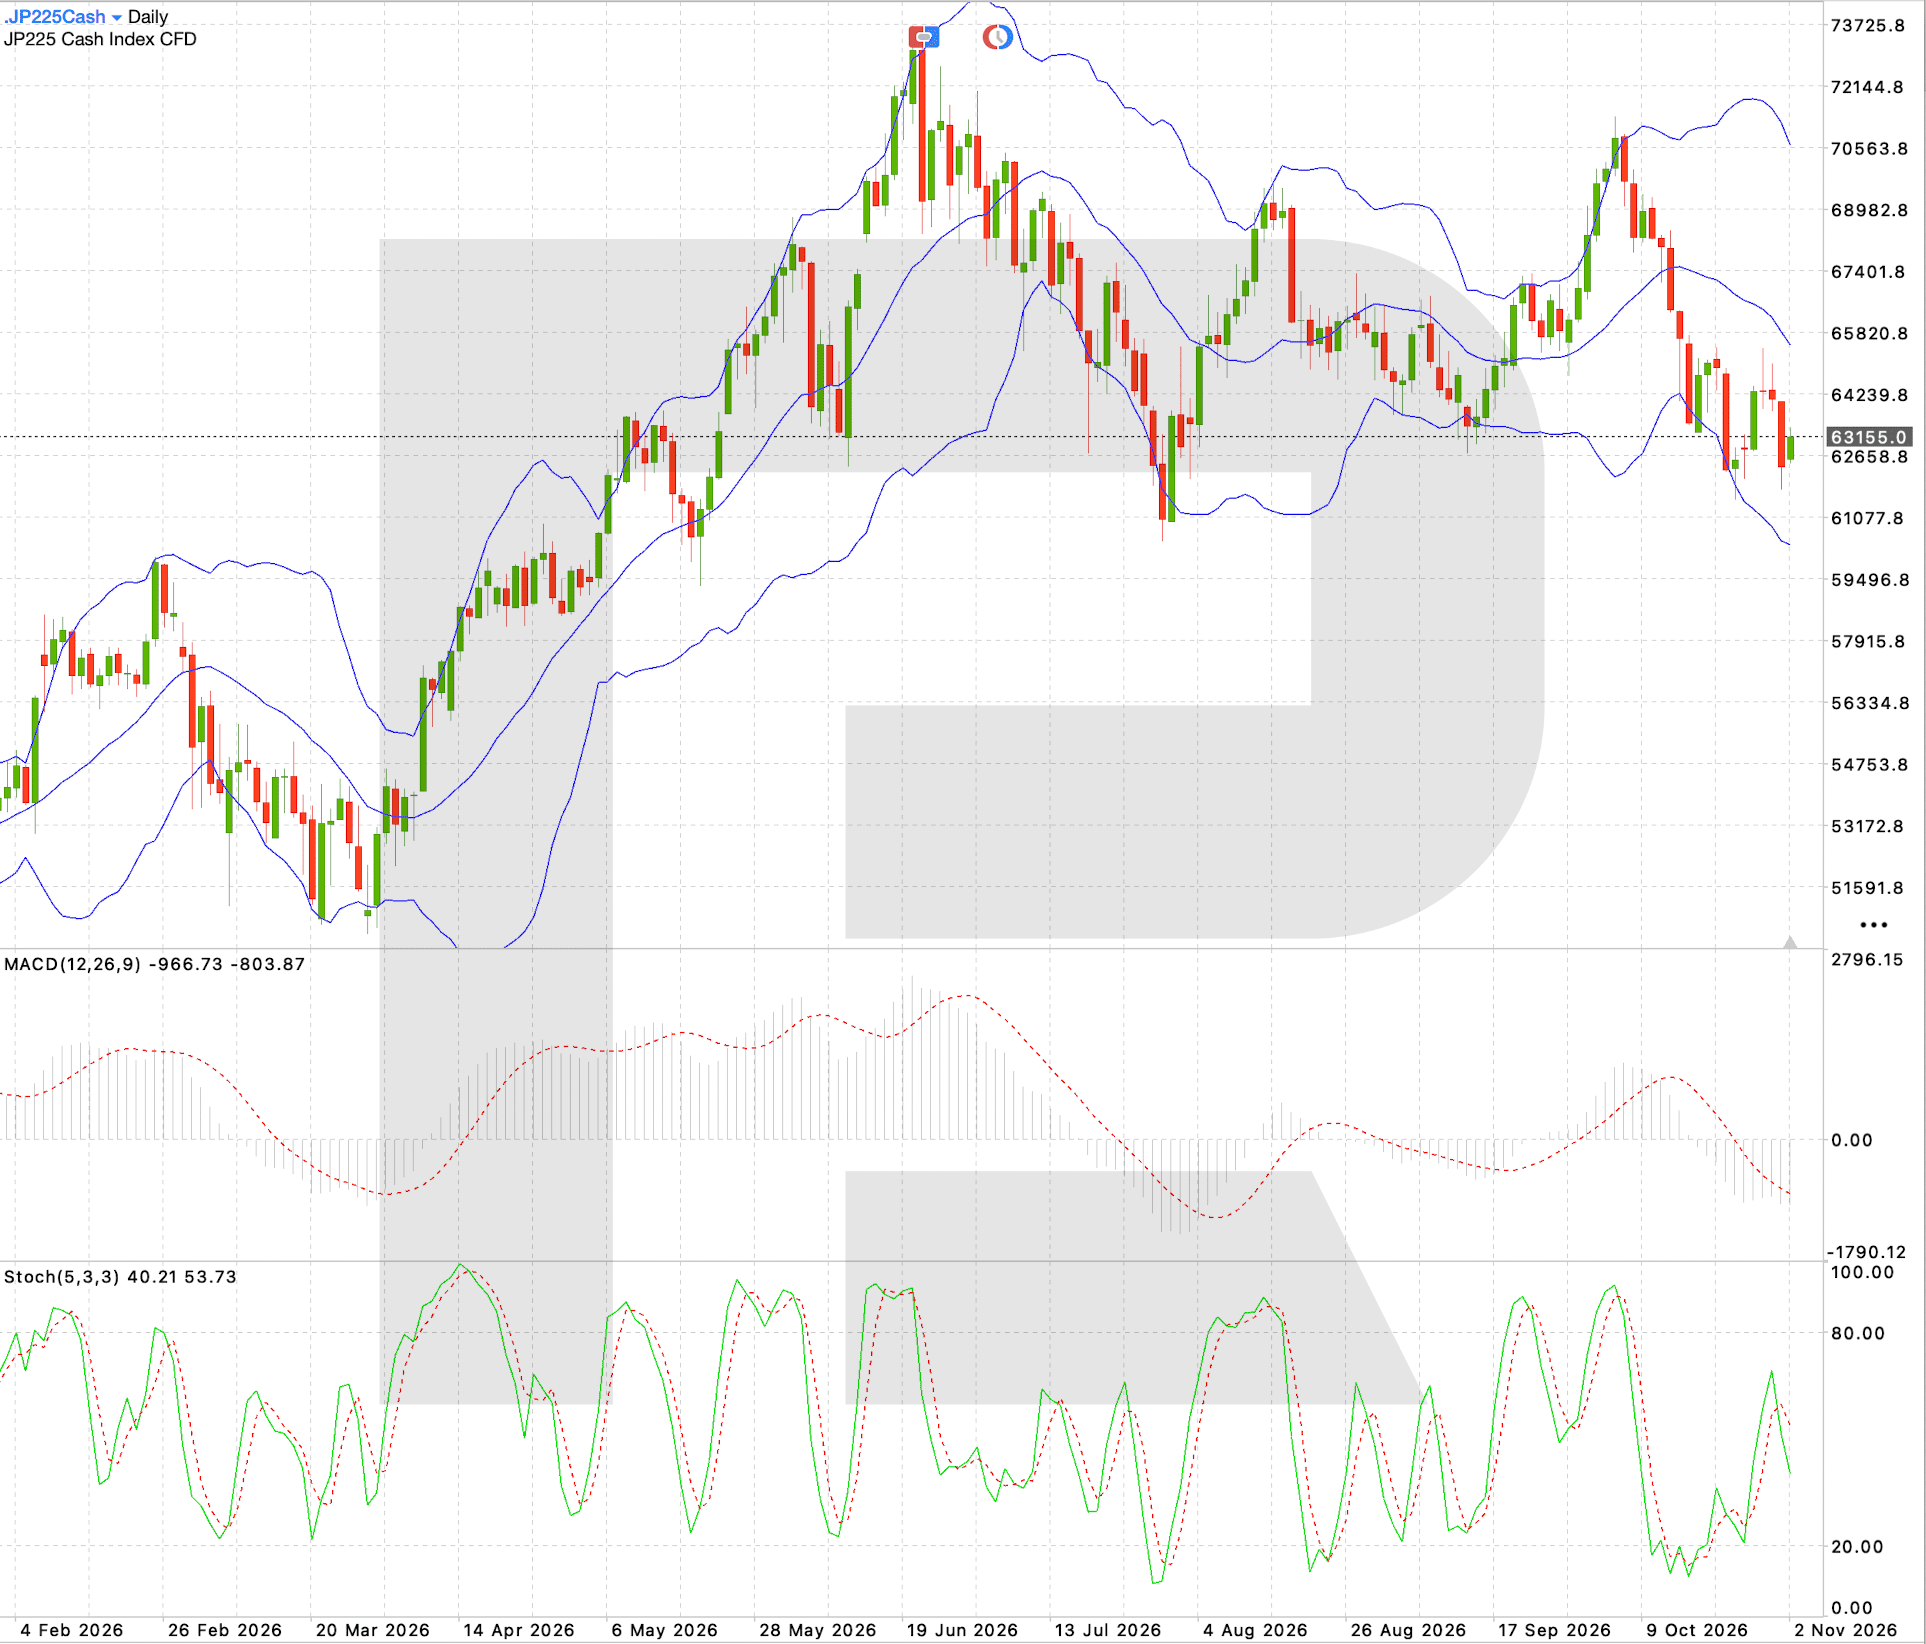
The JP 225 index is trading near 63,155.0 following another decline from local highs. The price remains below the middle Bollinger Band, and a recent recovery attempt failed to develop sustained momentum. MACD remains in negative territory, confirming sellers' dominance. The Stochastic Oscillator is turning down, signalling weakening short-term upward momentum.
The nearest support lies in the 62,660–61,080 area. A breakout below 62,650 could intensify the decline, with the next target at 61,080. The nearest resistance level is located at 64,240, while a stronger supply zone has formed near 65,820. A decisive consolidation above 64,240 could ease selling pressure and open the door for a more substantial recovery.
JP 225 trading scenario
Summary and what to watch this week
The week of 2–6 November could prove decisive for short-term sentiment in global stock markets. The US midterm elections are creating political uncertainty, while Friday's employment report will serve as a key test of expectations for the Federal Reserve's future policy. The US Tech remains the most vulnerable of the US indices, while the US 500 and the US 30 also face risks of a continued correction.
Europe's DE 40 is attempting to recover, but further gains will depend on inflation expectations and external demand. Japan's JP 225 remains under pressure amid a weak technical outlook and risks of yen appreciation. For all five indices, key factors to watch will be market reactions to the election results, bond yield movements, and Friday's US employment figures.
Editors’ picks


EURUSD forecast 2026–2027: technical analysis, price levels & predictions
The EURUSD outlook for 2026 and 2027: key levels on the daily chart, three trading scenarios and the policy gap between the Fed and the ECB that drives the pair.

Gold (XAUUSD) forecast 2026: technical analysis, price levels & predictions
Where gold could trade in 2026: key levels, three trading scenarios with entry triggers and the forecasts from J.P. Morgan, Deutsche Bank and Goldman Sachs.
Forecasts presented in this section only reflect the author’s private opinion and should not be considered as guidance for trading. RoboForex bears no responsibility for trading results based on trading recommendations described in these analytical reviews.