US 30 forecast: the index is trading sideways after the decline
The US 30 correction turned into a decline and then into a sideways trend. The US 30 forecast for today is negative.
US 30 forecast: key takeaways
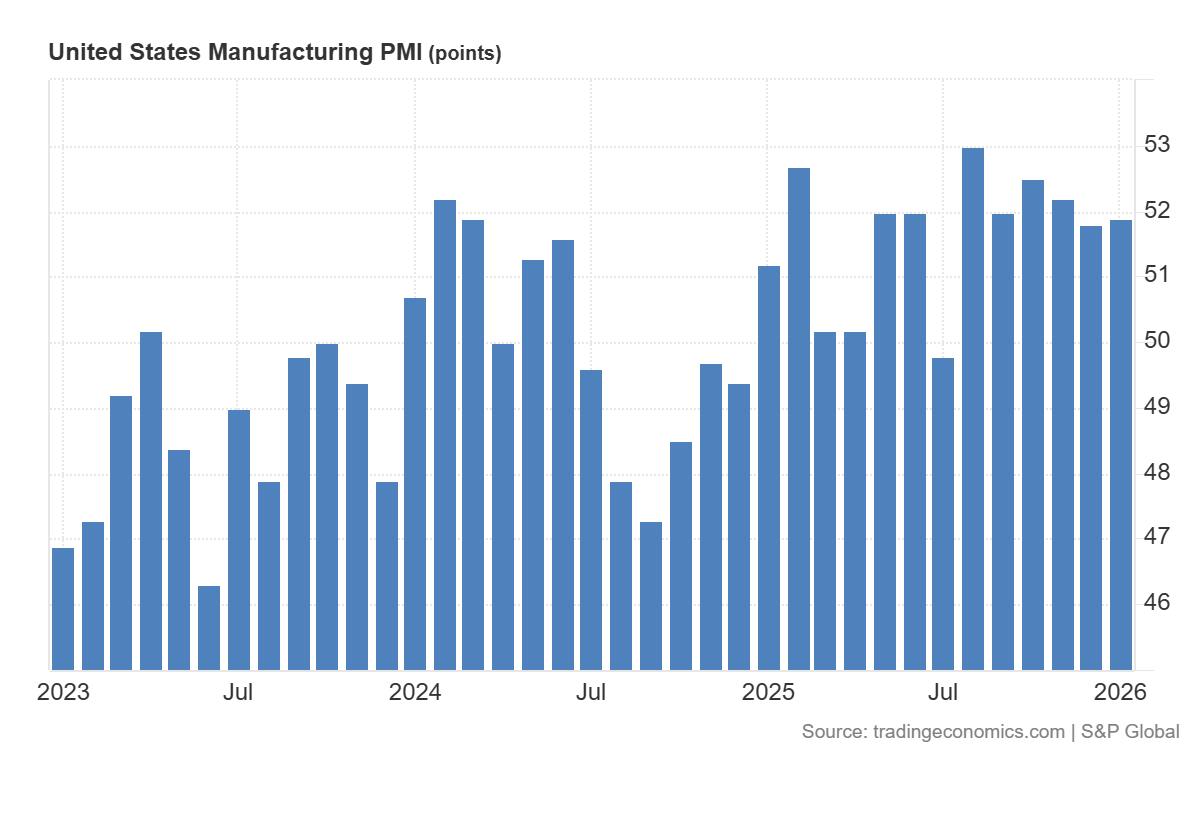
- Recent data: US manufacturing PMI for December came in at 51.9
- Market impact: the data is moderately positive for the stock market
US 30 fundamental analysis
The manufacturing PMI index shows whether business activity in the manufacturing sector is expanding or contracting. A reading above 50.0 indicates growth, while a reading below 50.0 signals contraction. In the latest release, the indicator came in at 51.9, in line with the forecast of 51.9 and above the previous value of 51.8, meaning manufacturing remains in a zone of moderate growth, with a slight improvement in dynamics but no surprise for the market. For the US equity market, such a result is generally perceived as confirmation of economic cycle stability: demand and production activity are not deteriorating, which supports expectations for corporate revenues and profits.
For the US 30 index, the impact is typically slightly more noticeable than for the broader market, because it has a higher share of large cyclical companies, including industrials and the financial sector, which are sensitive to economic conditions and interest rate levels. In this situation, the signal of manufacturing growth itself is moderately positive for the US 30, but due to the lack of surprise, the effect is likely to be limited and may quickly be offset by overall bond yield dynamics and expectations regarding Federal Reserve policy.
US 30 technical analysis
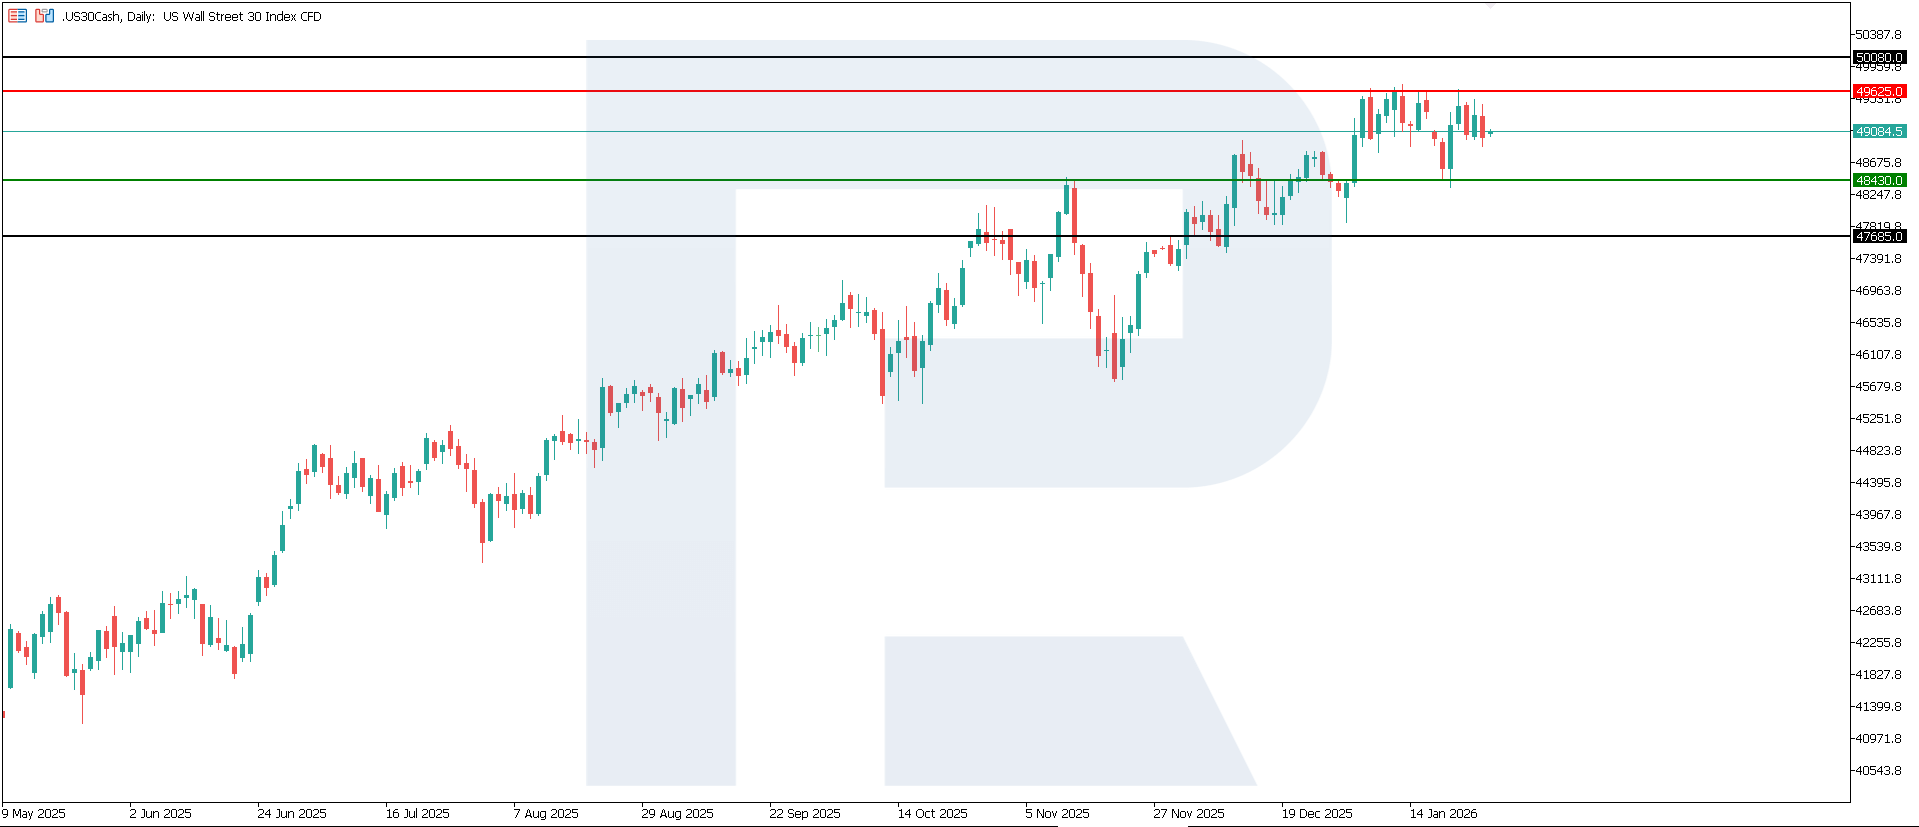
The US 30 index has entered a downward phase, with a key support level forming around 48,430.0 and a resistance level shifting to 49,625.0. The nearest downside target is located near 47,685.0.
The US 30 price forecast considers the following scenarios:
- Pessimistic US 30 scenario: a breakout below the 48,430.0 support level could push the index down to 47,685.0
- Optimistic US 30 scenario: a breakout above the 49,980.0 resistance level could boost the index up to 50,080.0
Summary
The latest manufacturing PMI confirms moderate expansion in US manufacturing and is generally neutral-to-positive for US stocks. For the US 30 index, this serves as a weak supporting factor, but without significant momentum, as the data came in line with market expectations. The broader trend for the index remains downward, with the nearest downside target at the 47,685.0 level.
Editors’ picks
 EURUSD 2026-2027 forecast: key market trends and future predictions
This article provides the EURUSD forecast for 2026 and 2027 and highlights the main factors determining the direction of the pair’s movements. We will apply technical analysis, take into account the opinions of leading experts, large banks, and financial institutions, and study AI-based forecasts. This comprehensive insight into EURUSD predictions should help investors and traders make informed decisions.
 Gold (XAUUSD) forecast 2026 and beyond: expert insights, price predictions, and analysis
Dive deep into the Gold (XAUUSD) price outlook for 2026 and beyond, combining technical analysis, expert forecasts, and key macroeconomic factors. It explains the drivers behind gold’s recent surge, explores potential scenarios including a move toward 4,500 to 5,000 USD per ounce, and highlights why the metal remains a strong hedge during global uncertainty.
Forecasts presented in this section only reflect the author’s private opinion and should not be considered as guidance for trading. RoboForex bears no responsibility for trading results based on trading recommendations described in these analytical reviews.