US 30 forecast: the index is poised for trend reversal
In the US 30 index, prices are testing the support level and may break below it, which would signal the beginning of a downtrend. The US 30 forecast for today is negative.
US 30 forecast: key takeaways
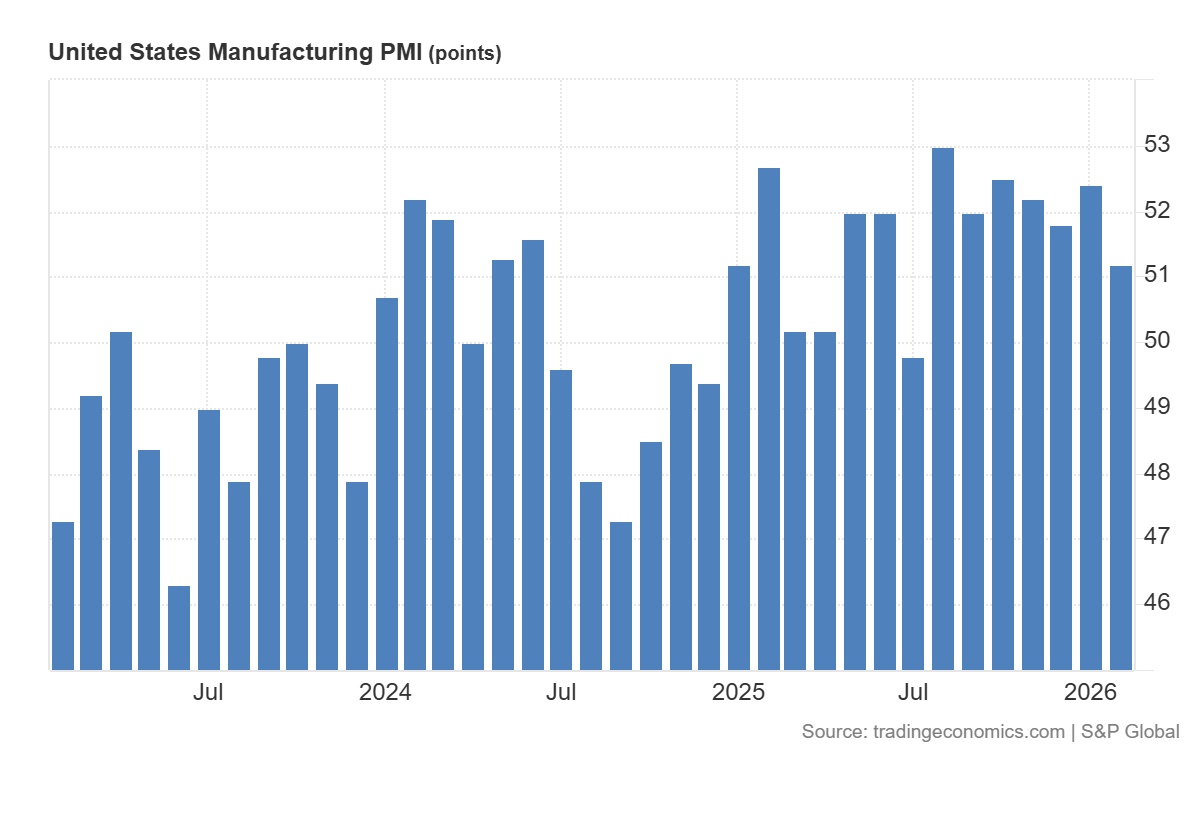
- Recent data: US manufacturing PMI came in at 51.2 in February
- Market impact: the data has a mixed impact on the stock market
US 30 fundamental analysis
The release of the US manufacturing PMI at 51.2 points, below expectations of 52.4 and the previous reading of 52.4, is moderately negative for short-term sentiment, as it indicates a slowdown in the pace of industrial activity growth. However, the indicator remains above the 50-point threshold, meaning the sector is still formally expanding; the issue is more about a loss of momentum than a shift into contraction. Such a combination is typically perceived by the market as a signal of more cautious demand and order dynamics in the manufacturing segment of the economy.
For the US 30, the impact is typically reflected in moderate pressure, as the index has significant exposure to industrial and cyclical companies, for which production rates, orders, and business confidence are key drivers of financial performance. A weaker-than-expected PMI reading may reinforce doubts about companies’ ability to maintain strong revenue growth in the coming quarters, limiting the index’s upside potential. At the same time, the fact that the PMI remains above 50 partially mitigates the negative effect, as it does not confirm a scenario of sharp economic deterioration.
US 30 technical analysis
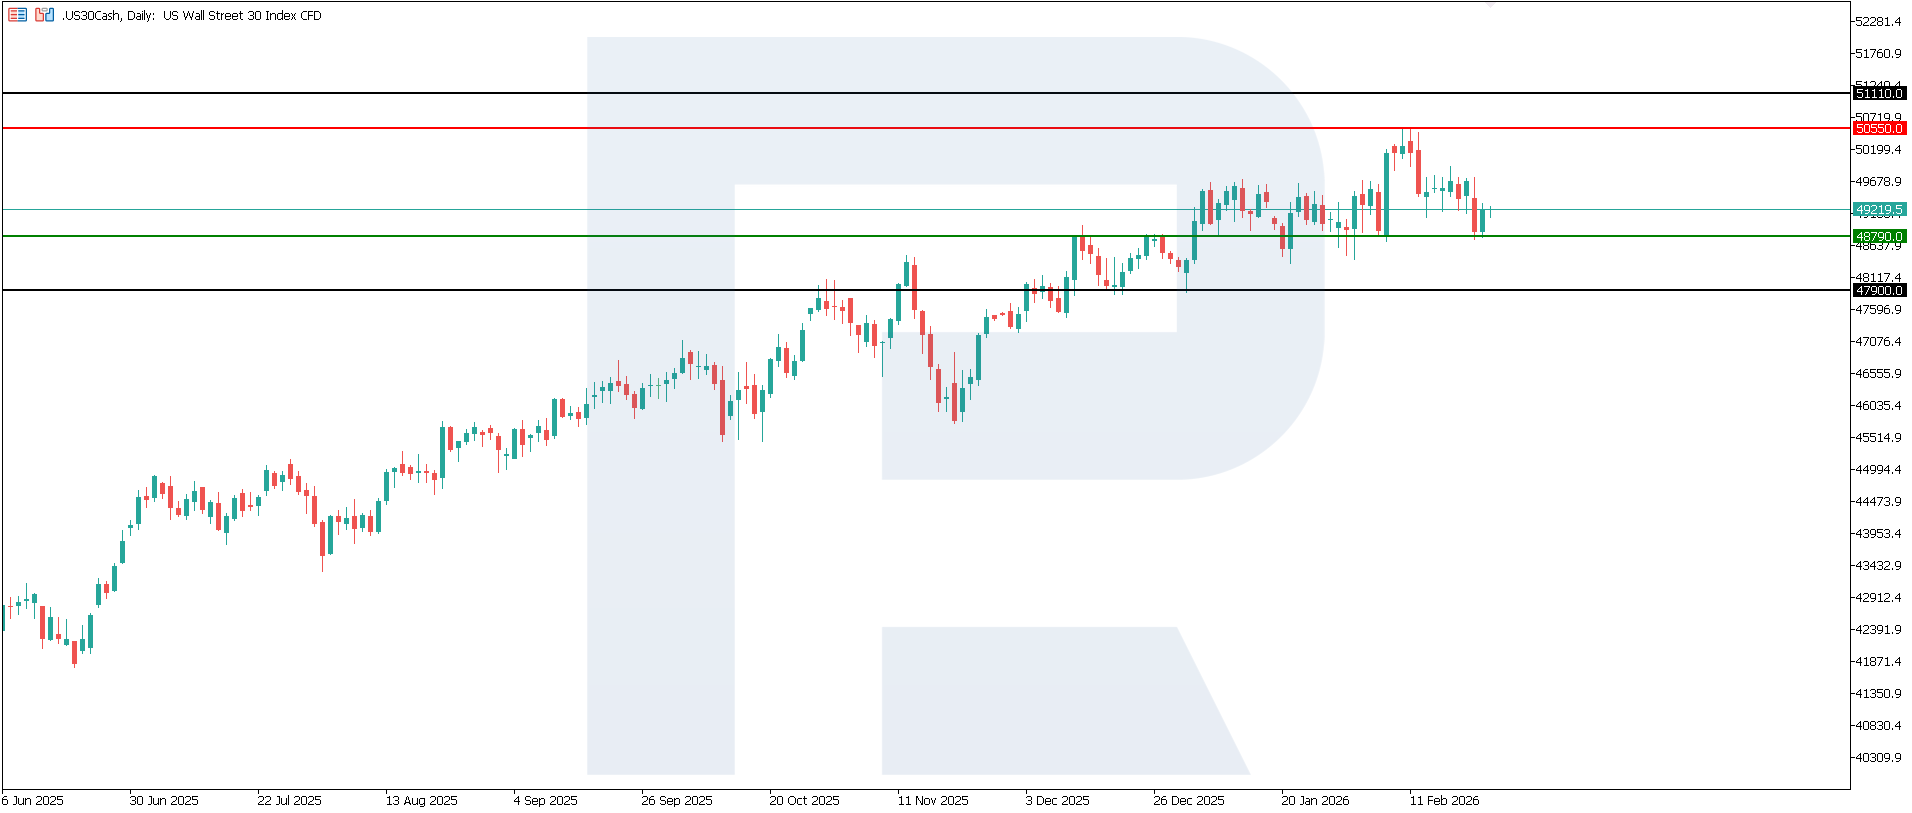
The US 30 index has entered an uptrend, with a key support level at 48,790.0 and a resistance level at 50,550.0. The price is currently testing the support level and gearing up to break below it. The nearest downside target is located near 47,900.0.
The US 30 price forecast considers the following scenarios:
- Pessimistic US 30 scenario: a breakout below the 48,790.0 support level could push the index down to 47,900.0
- Optimistic US 30 scenario: a breakout above the 50,550.0 resistance level could drive the index to 51,110.0
Summary
The data is moderately unfavourable for the US 30 but does not signal a large-scale downturn, as the PMI remains in expansion territory. The most likely market reaction is restrained price action with increased attention to upcoming data on demand, inflation, and the labour market. The nearest downside target may be 47,900.0.
Editors’ picks
 EURUSD 2026-2027 forecast: key market trends and future predictions
This article provides the EURUSD forecast for 2026 and 2027 and highlights the main factors determining the direction of the pair’s movements. We will apply technical analysis, take into account the opinions of leading experts, large banks, and financial institutions, and study AI-based forecasts. This comprehensive insight into EURUSD predictions should help investors and traders make informed decisions.
 Gold (XAUUSD) forecast 2026 and beyond: expert insights, price predictions, and analysis
Dive deep into the Gold (XAUUSD) price outlook for 2026 and beyond, combining technical analysis, expert forecasts, and key macroeconomic factors. It explains the drivers behind gold’s recent surge, explores potential scenarios including a move toward 4,500 to 5,000 USD per ounce, and highlights why the metal remains a strong hedge during global uncertainty.
Forecasts presented in this section only reflect the author’s private opinion and should not be considered as guidance for trading. RoboForex bears no responsibility for trading results based on trading recommendations described in these analytical reviews.