US 30 forecast: the index dipped by nearly 3%
The US 30 index is experiencing its sharpest decline since mid-autumn 2025. The US 30 forecast for today is negative.
US 30 forecast: key takeaways
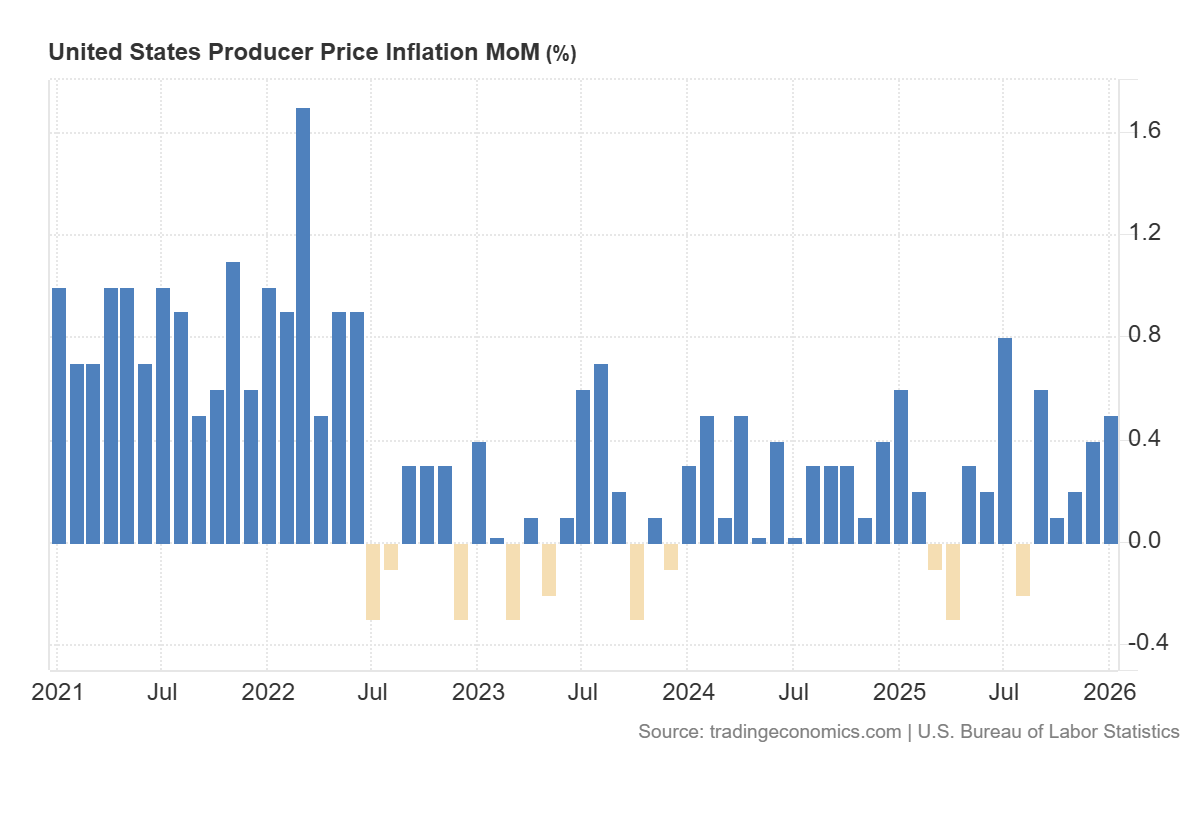
- Recent data: US PPI came in at 0.5% in January
- Market impact: the data has a mixed effect on the equity market
US 30 fundamental analysis
A stronger-than-expected Producer Price Index (PPI) is typically perceived by the market as a signal that inflationary pressure at the producer level persists. This increases the likelihood that price growth will continue to filter through other segments of the economy. In practical terms, investors are more likely to revise monetary policy expectations towards a longer period of elevated interest rates. In financial markets, this is typically accompanied by rising government bond yields and a stronger US dollar, which makes equities less attractive than higher-yielding and less risky instruments.
For the US 30, the current data generally implies an increased risk of a short-term decline or more subdued performance. The reason is that more persistent inflation typically leads the market to price in higher borrowing costs and tighter financial conditions. This negatively affects the valuation of future corporate profits and raises investor requirements regarding earnings quality. Additionally, geopolitical tensions in the Middle East are adding to pressure. However, such risks are difficult to forecast in the short term.
US 30 technical analysis
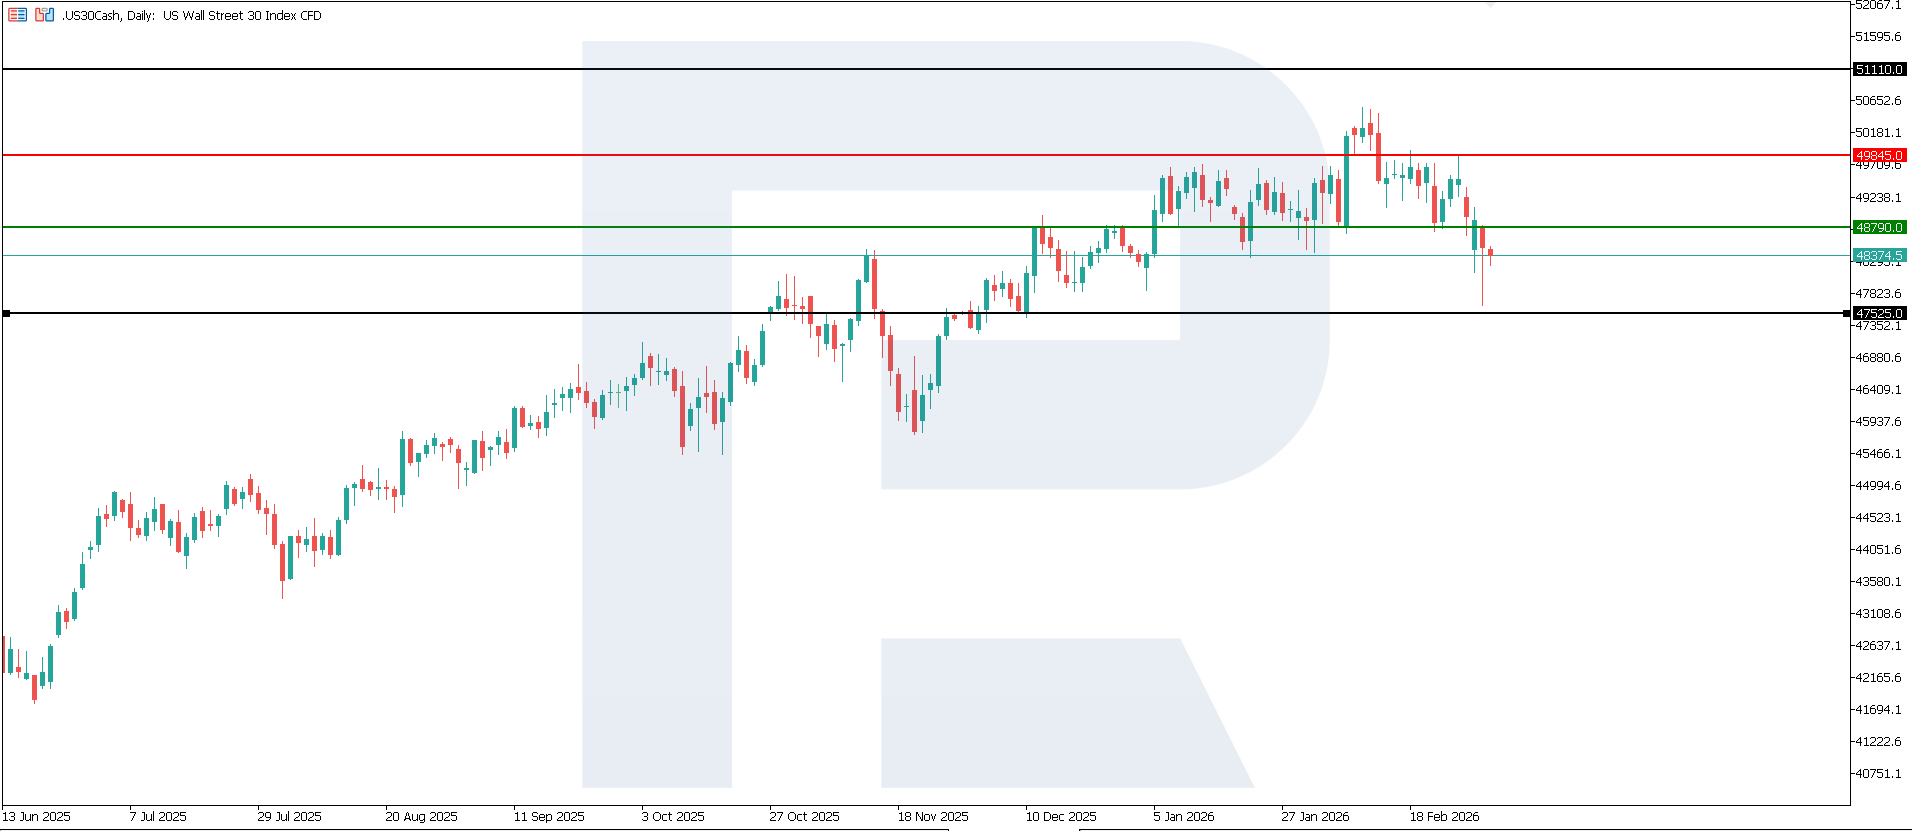
The US 30 index has entered a downtrend, with the key support level at 48,790.0 having been broken. The resistance level has formed at 49,845.0. The decline is currently accelerating, and volatility is increasing. The nearest downside target is located around 47,525.0.
The US 30 price forecast considers the following scenarios:
- Pessimistic US 30 scenario: if the price consolidates below the breached support level at 48,790.0, the index could fall to 47,525.0
- Optimistic US 30 scenario: a breakout above the 49,845.0 resistance level could boost the index to 51,110.0
Summary
Better-than-expected PPI data increases the likelihood of restrained performance in the US equity market in the near term. In such conditions, companies with stable earnings and controlled costs tend to outperform, while sectors sensitive to borrowing costs and changes in interest rate expectations become more vulnerable. The nearest downside target could be 47,525.0.
Editors’ picks
 EURUSD 2026-2027 forecast: key market trends and future predictions
This article provides the EURUSD forecast for 2026 and 2027 and highlights the main factors determining the direction of the pair’s movements. We will apply technical analysis, take into account the opinions of leading experts, large banks, and financial institutions, and study AI-based forecasts. This comprehensive insight into EURUSD predictions should help investors and traders make informed decisions.
 Gold (XAUUSD) forecast 2026 and beyond: expert insights, price predictions, and analysis
Dive deep into the Gold (XAUUSD) price outlook for 2026 and beyond, combining technical analysis, expert forecasts, and key macroeconomic factors. It explains the drivers behind gold’s recent surge, explores potential scenarios including a move toward 4,500 to 5,000 USD per ounce, and highlights why the metal remains a strong hedge during global uncertainty.
Forecasts presented in this section only reflect the author’s private opinion and should not be considered as guidance for trading. RoboForex bears no responsibility for trading results based on trading recommendations described in these analytical reviews.