US 30 forecast: the index may break above resistance
The US 30 index is testing the resistance level and may break above it. The US 30 forecast for today is negative.
US 30 forecast: key takeaways
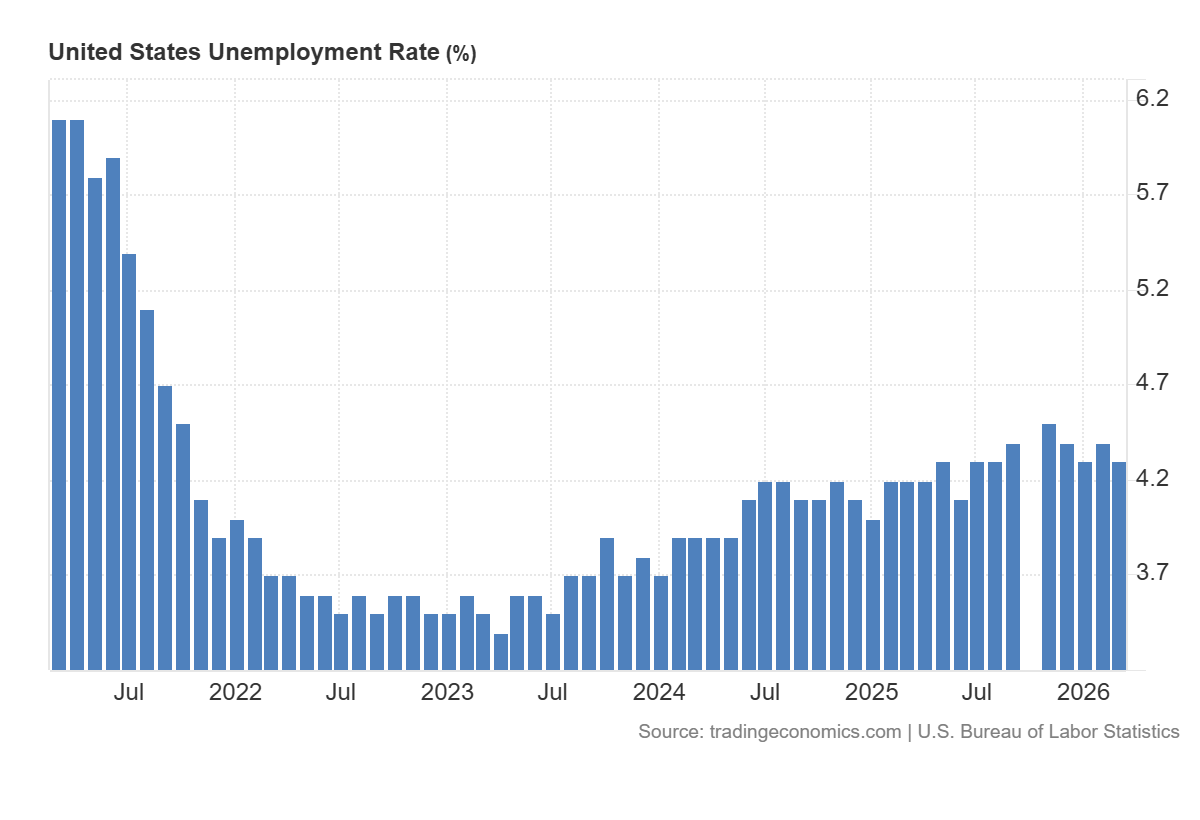
- Recent data: US unemployment rate declined to 4.3% in March
- Market impact: the data is positive for the equity market
US 30 fundamental analysis
The US unemployment rate at 4.3%, below the forecast of 4.4% and the previous reading of 4.4%, can generally be interpreted by the market as a moderately positive signal for the US 30 index. This outcome suggests the labour market is slightly more resilient than expected. This is important for investors, as employment remains one of the key indicators of overall US economic health. A lower unemployment rate typically indicates that business activity is holding up, companies are retaining staff, and consumer demand is supported by household income.
For the US 30 index, this data typically creates a favourable backdrop, as it includes large, mature companies sensitive to the overall health of the US economy. If the market interprets the release as confirmation of economic resilience without signs of a sharp slowdown, it may support industrial, financial, consumer, and technology segments represented in the index.
US 30 technical analysis
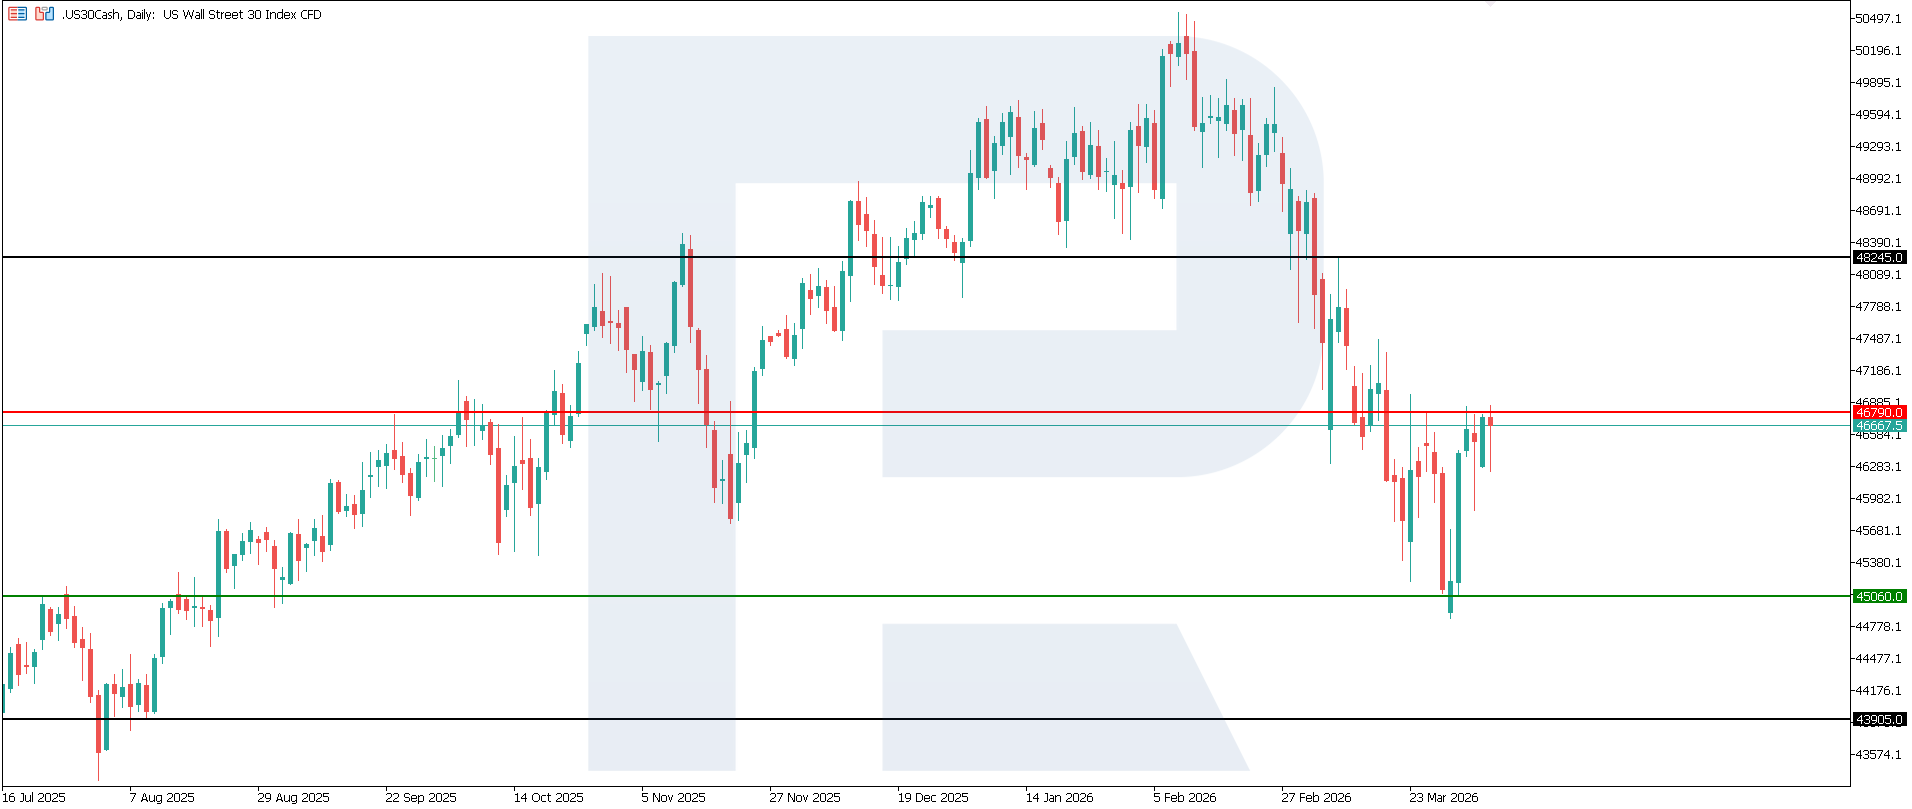
The US 30 index has entered a correction phase. The nearest support level has formed at 45,060.0, while resistance stands at 46,790.0. The price is currently moving towards the resistance level, but there are still not enough signs of a sustainable trend reversal. If the current momentum persists, the nearest downside target could be the 43,905.0 area.
The US 30 price forecast considers the following scenarios:
- Pessimistic US 30 scenario: a breakout below the 45,050.0 support level could send the index down to 43,905.0
- Optimistic US 30 scenario: a breakout above the 46,790.0 resistance level could boost the index up to 48,245.0
Summary
Overall, this release creates a constructive backdrop for the US market. The unemployment rate came in better than expected, reducing fears of a sharp economic slowdown. For the US 30, this is a supportive signal, as its composition is closely tied to the resilience of the real economy, consumption, and large-company earnings. The most likely baseline reaction is moderately positive for the US 30 and broadly favourable for the US stock market. The nearest downside target could be 43,905.0.
Editors’ picks
 EURUSD 2026-2027 forecast: key market trends and future predictions
This article provides the EURUSD forecast for 2026 and 2027 and highlights the main factors determining the direction of the pair’s movements. We will apply technical analysis, take into account the opinions of leading experts, large banks, and financial institutions, and study AI-based forecasts. This comprehensive insight into EURUSD predictions should help investors and traders make informed decisions.
 Gold (XAUUSD) forecast 2026 and beyond: expert insights, price predictions, and analysis
Dive deep into the Gold (XAUUSD) price outlook for 2026 and beyond, combining technical analysis, expert forecasts, and key macroeconomic factors. It explains the drivers behind gold’s recent surge, explores potential scenarios including a move toward 4,500 to 5,000 USD per ounce, and highlights why the metal remains a strong hedge during global uncertainty.
Forecasts presented in this section only reflect the author’s private opinion and should not be considered as guidance for trading. RoboForex bears no responsibility for trading results based on trading recommendations described in these analytical reviews.