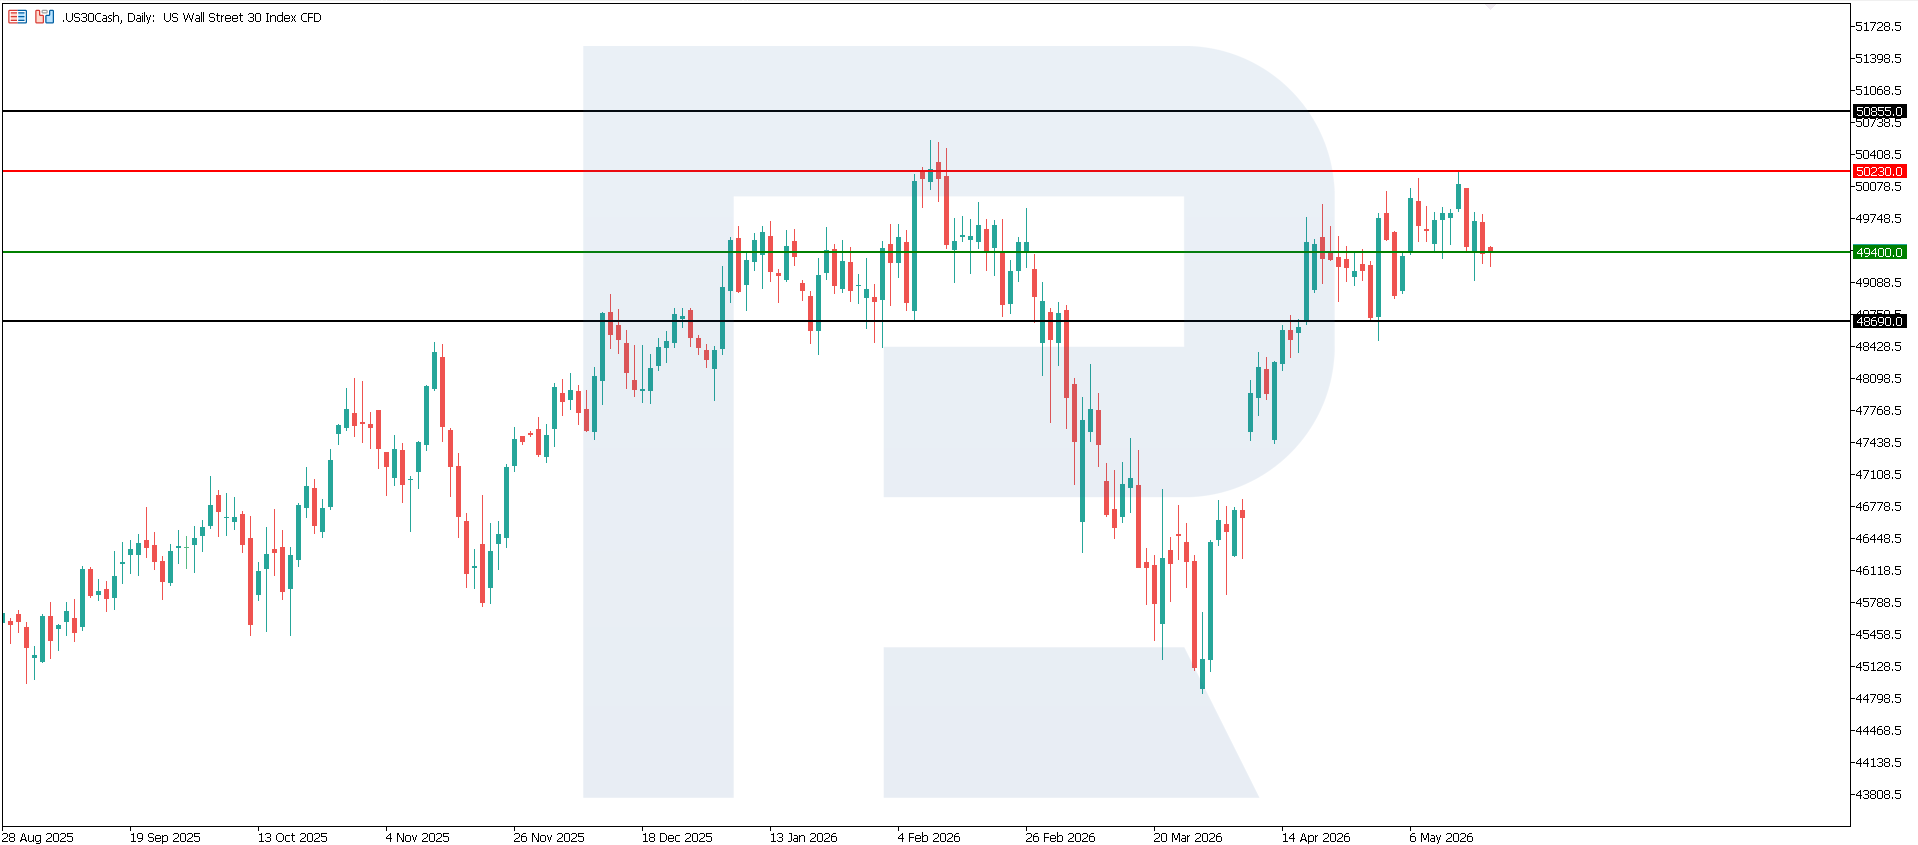
US 30 index forecast: the index has moved very close to its all-time high
The US 30 index approached its all-time high and entered a correction; the trend is highly unstable. The US 30 forecast for today is positive.
US 30 forecast: key takeaways
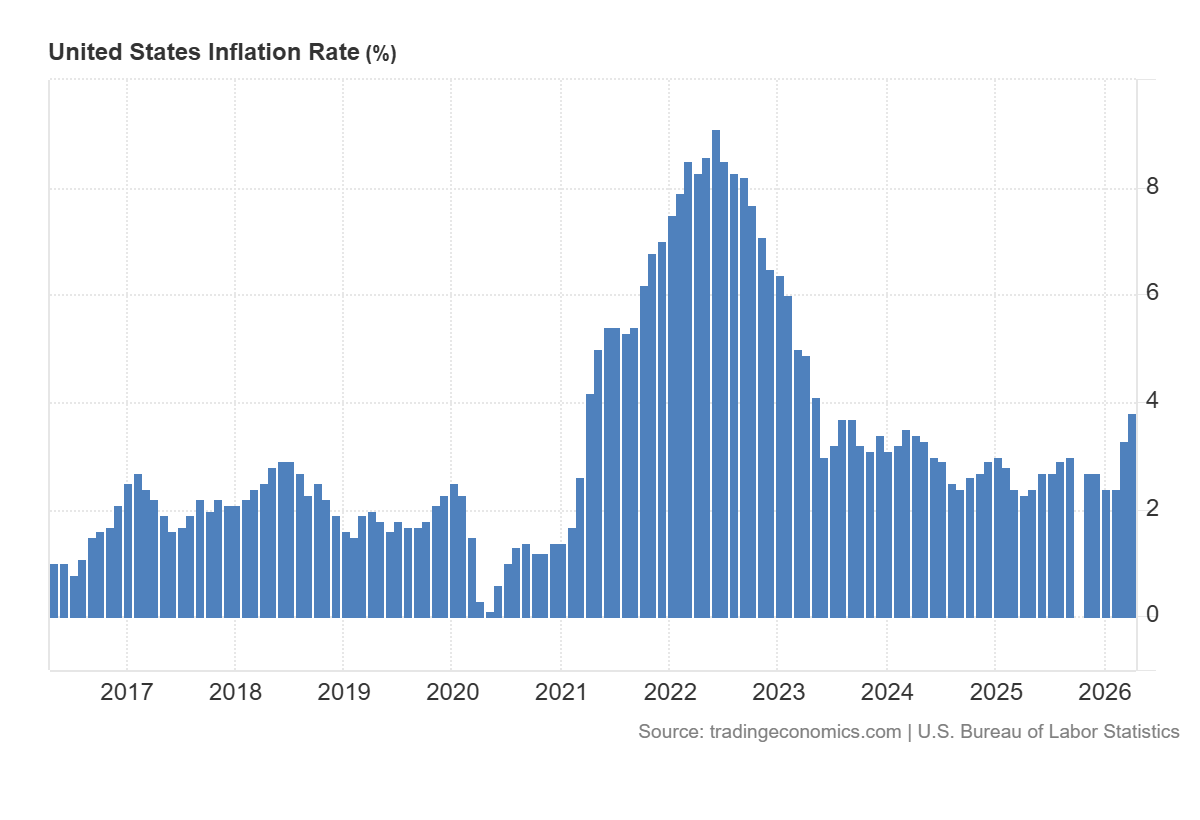
- Recent data: US CPI for April came in at 3.8% year-on-year
- Market impact: the data is positive for the stock market
US 30 fundamental analysis
The acceleration of US annual inflation to 3.8% versus the forecast of 3.7% and the previous 3.3% is a negative macroeconomic signal for the market. Higher inflation increases concerns that price pressures will remain elevated longer than expected, meaning the Federal Reserve may keep interest rates higher for longer. For investors, this reduces the appeal of equities, as higher borrowing costs weigh on corporate profits, constrain consumer activity, and raise bond yields as an alternative to stocks.
For the US 30 index, this news may have a moderately negative impact. The index includes large industrial, financial, consumer, and technology companies that are sensitive to changes in interest rates and expectations for economic growth. Faster inflation can increase pressure on prices, as investors price in a more restrictive monetary policy stance and more cautious corporate earnings forecasts.
US 30 technical analysis
The US 30 index is slowly advancing towards its all-time high, with some pullbacks. The nearest support level has formed at 49,400.0, while the resistance level is located at 50,230.0. At the moment, prices continue to move towards all-time highs. If the current momentum persists, the nearest upside target could be 50,855.0.
The US 30 price forecast considers the following scenarios:
- Pessimistic US 30 scenario: a breakout below the 49,400.0 support level could send the index down to 48,690.0
- Optimistic US 30 scenario: a breakout above the 50,230.0 resistance level could boost the index to 50,855.0
Summary
The faster-than-expected rise in US inflation is a negative signal for the stock market. For the US 30, this can mean short-term pressure and higher volatility, especially if investors decide the Federal Reserve will have to maintain a tighter stance for longer. However, the extent of any decline will depend on further data on inflation, the labour market, and consumer activity. If upcoming figures confirm persistent price pressures, the US stock market may face a longer period of caution. The nearest upside target could be 50,855.0.
Editors’ picks
 EURUSD 2026-2027 forecast: key market trends and future predictions
This article provides the EURUSD forecast for 2026 and 2027 and highlights the main factors determining the direction of the pair’s movements. We will apply technical analysis, take into account the opinions of leading experts, large banks, and financial institutions, and study AI-based forecasts. This comprehensive insight into EURUSD predictions should help investors and traders make informed decisions.
 Gold (XAUUSD) forecast 2026 and beyond: expert insights, price predictions, and analysis
Dive deep into the Gold (XAUUSD) price outlook for 2026 and beyond, combining technical analysis, expert forecasts, and key macroeconomic factors. It explains the drivers behind gold’s recent surge, explores potential scenarios including a move toward 4,500 to 5,000 USD per ounce, and highlights why the metal remains a strong hedge during global uncertainty.
Forecasts presented in this section only reflect the author’s private opinion and should not be considered as guidance for trading. RoboForex bears no responsibility for trading results based on trading recommendations described in these analytical reviews.