
US 30 rises as the US labour market cools
The US 30 is staging a local recovery after holding a local support level. The price currently stands at 51,655.
US 30 forecast: key takeaways
- The Conference Board Consumer Confidence Index fell in September to its lowest level since 2014
- John Williams said the Federal Reserve may not need to rush into another interest rate hike
- US 30 forecast for 30 September 2026: 50,605
US 30 fundamental analysis
The US 30 index is showing upward momentum, with buyers once again defending the key 51,245 support level from a breakout. The market has moved into a local recovery, seeking to offset recent selling pressure amid softer monetary policy expectations.
The main driver of the shift in market sentiment was weak US economic data. Job openings in August unexpectedly fell by 256 thousand to 7.079 million, significantly below analysts' forecast of 7.225 million. The Conference Board Consumer Confidence Index acted as an additional cooling factor, plunging in September to its lowest level since 2014.
Against this backdrop, Federal Reserve officials have taken diverging positions. New York Fed President John Williams struck a moderate tone, saying that the Federal Reserve may not need to rush into another rate hike, in sharp contrast with hawkish comments from other officials, including Kevin Warsh. As a result, market expectations for the regulator's October move weakened sharply: according to the latest data, the probability of another policy tightening dropped to 44.8% from 70% earlier this week.
The short-term US 30 outlook for today remains bearish, although the final trend will be determined after the release of key inflation and employment data.
US 30 technical analysis
The US 30 is rising after rebounding from a strong support level; however, the index remains within a descending channel, indicating persistent selling pressure. The US 30 forecast for today suggests a continued downward move towards the 50,605 target.
The technical picture remains bearish. The Stochastic Oscillator has entered overbought territory, indicating a high probability that the upward correction will end and downward momentum will resume. An additional signal in favour of a decline would be a confident breakout below the local support level of 51,530, after which prices could consolidate below the EMA-65 and continue to move towards the target level.
At the same time, an alternative scenario remains possible. A breakout and consolidation above the 51,835 resistance level would weaken the current bearish signal and set the stage for a continued upward correction.
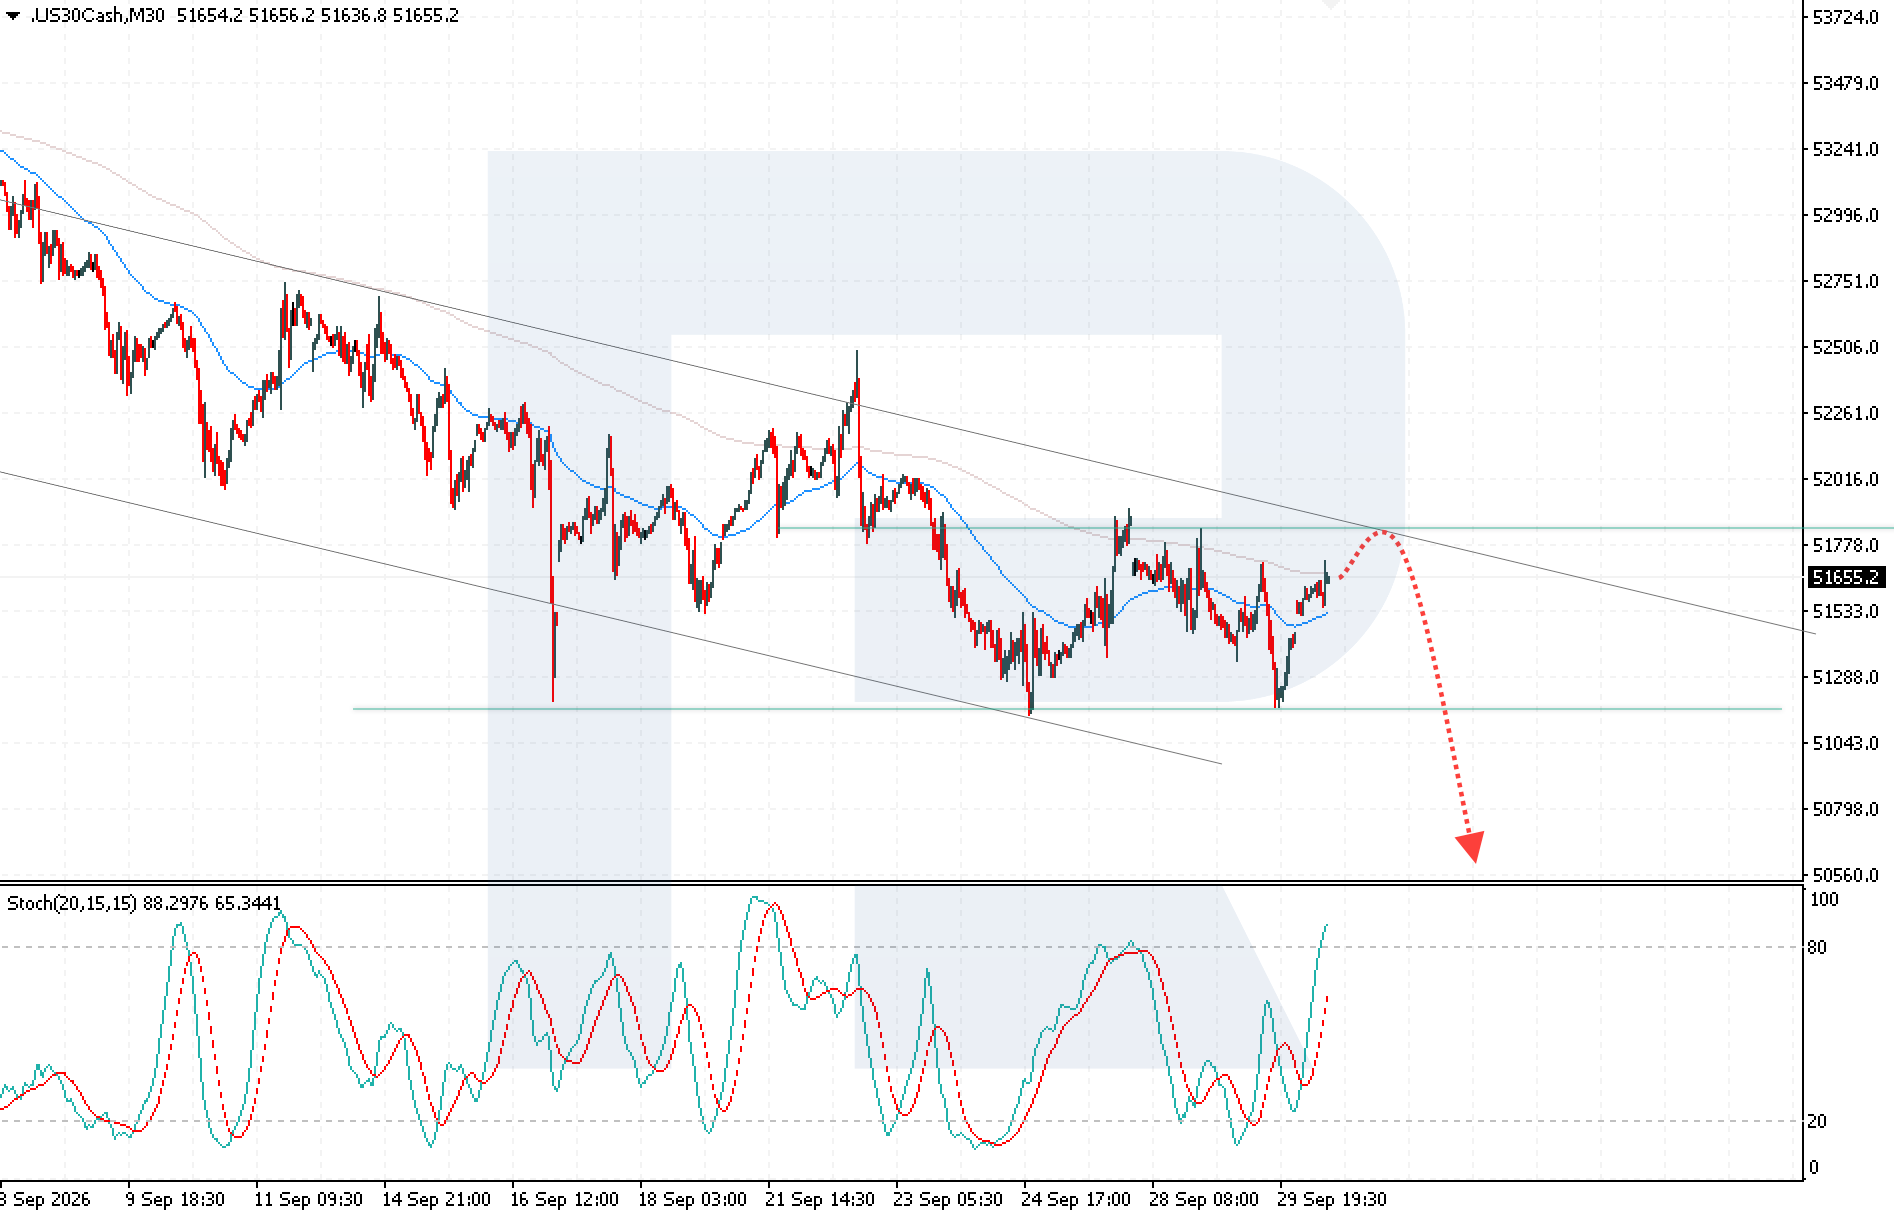
US 30 trading scenario for today
- Asset: US 30
- Timeframe: M30 (Intraday)
- Trend: bearish
- Key resistance levels: 51,835
- Key support levels: 51,530
Trading scenario (Sell Stop)
A consolidation below the local support level of 51,530 would increase selling pressure and create conditions for opening short positions with a target at 50,605.
- Current price: 51,655
- Entry level: 51,530
- Take profit: 50,605
- Stop loss: 51,705
- Risk-to-reward ratio: more than 1:5
The trade idea is valid until 8:00 AM on 6 October 2026 (server time, UTC+3).
Risk factors
The main risk to the US 30 downside scenario remains a breakout and consolidation above the 51,835 resistance level, which could lead to a continuation of the upward correction. A further decline in expectations of a Federal Reserve rate hike and weak US labour market data could provide additional support to buyers.
Summary
In the short term, the US 30 retains downside potential as long as it remains within the descending channel. A breakout below the 51,530 support level would strengthen the bearish scenario and open the way towards the 50,605 target.
Editors’ picks
 EURUSD forecast 2026–2027: technical analysis, price levels & predictions
The EURUSD outlook for 2026 and 2027: key levels on the daily chart, three trading scenarios and the policy gap between the Fed and the ECB that drives the pair.
 Gold (XAUUSD) forecast 2026: technical analysis, price levels & predictions
Where gold could trade in 2026: key levels, three trading scenarios with entry triggers and the forecasts from J.P. Morgan, Deutsche Bank and Goldman Sachs.
Forecasts presented in this section only reflect the author’s private opinion and should not be considered as guidance for trading. RoboForex bears no responsibility for trading results based on trading recommendations described in these analytical reviews.