
Tech rally drives Wall Street higher: US 30 at the trendline
The US 30 index is hovering around 51,512.20 after US indices rose in the previous session. A pause in rising yields and strong performance in the technology sector are supporting the market; however, the index has approached a key descending resistance trendline. For more details, see our analysis for 7 October 2026.
US 30 forecast: key takeaways
- The S&P 500 and Nasdaq reached new record highs in the previous session, while the Dow gained 0.49% amid strong demand for technology stocks
- A pause in the rise in Treasury yields eased pressure on the market, but investors are still awaiting the minutes of the latest Federal Reserve meeting
- US 30 forecast for 7 October 2026: 52,073.50
US 30 fundamental analysis
US stock index futures are little changed on Wednesday after a strong previous session. On Tuesday, the S&P 500 rose 0.58%, the Nasdaq Composite gained 0.45%, with both indices closing at record highs. The Dow Jones added 0.49%.
The technology sector was once again the main driver of the rally. Among semiconductor companies, AMD rose 2.8%, Marvell Technology gained 5.8%, and Broadcom advanced 3.7%. Strong interest in companies linked to AI and artificial intelligence infrastructure continues to support overall risk appetite.
An additional positive factor was the pause in the recent rise in bond yields. The stabilisation of the debt market reduces pressure on corporate funding costs and is particularly favourable for the technology sector, which is sensitive to interest rate changes.
Meanwhile, oil prices recovered amid persistent risks to energy supplies from the Middle East. Higher oil prices could reignite inflation concerns and limit the stock market's upside potential. Today, investors will focus on the minutes of the latest Federal Reserve meeting, which may clarify the regulator's stance on the future path of interest rates.
The US 30 outlook is positive.
US 30 technical analysis
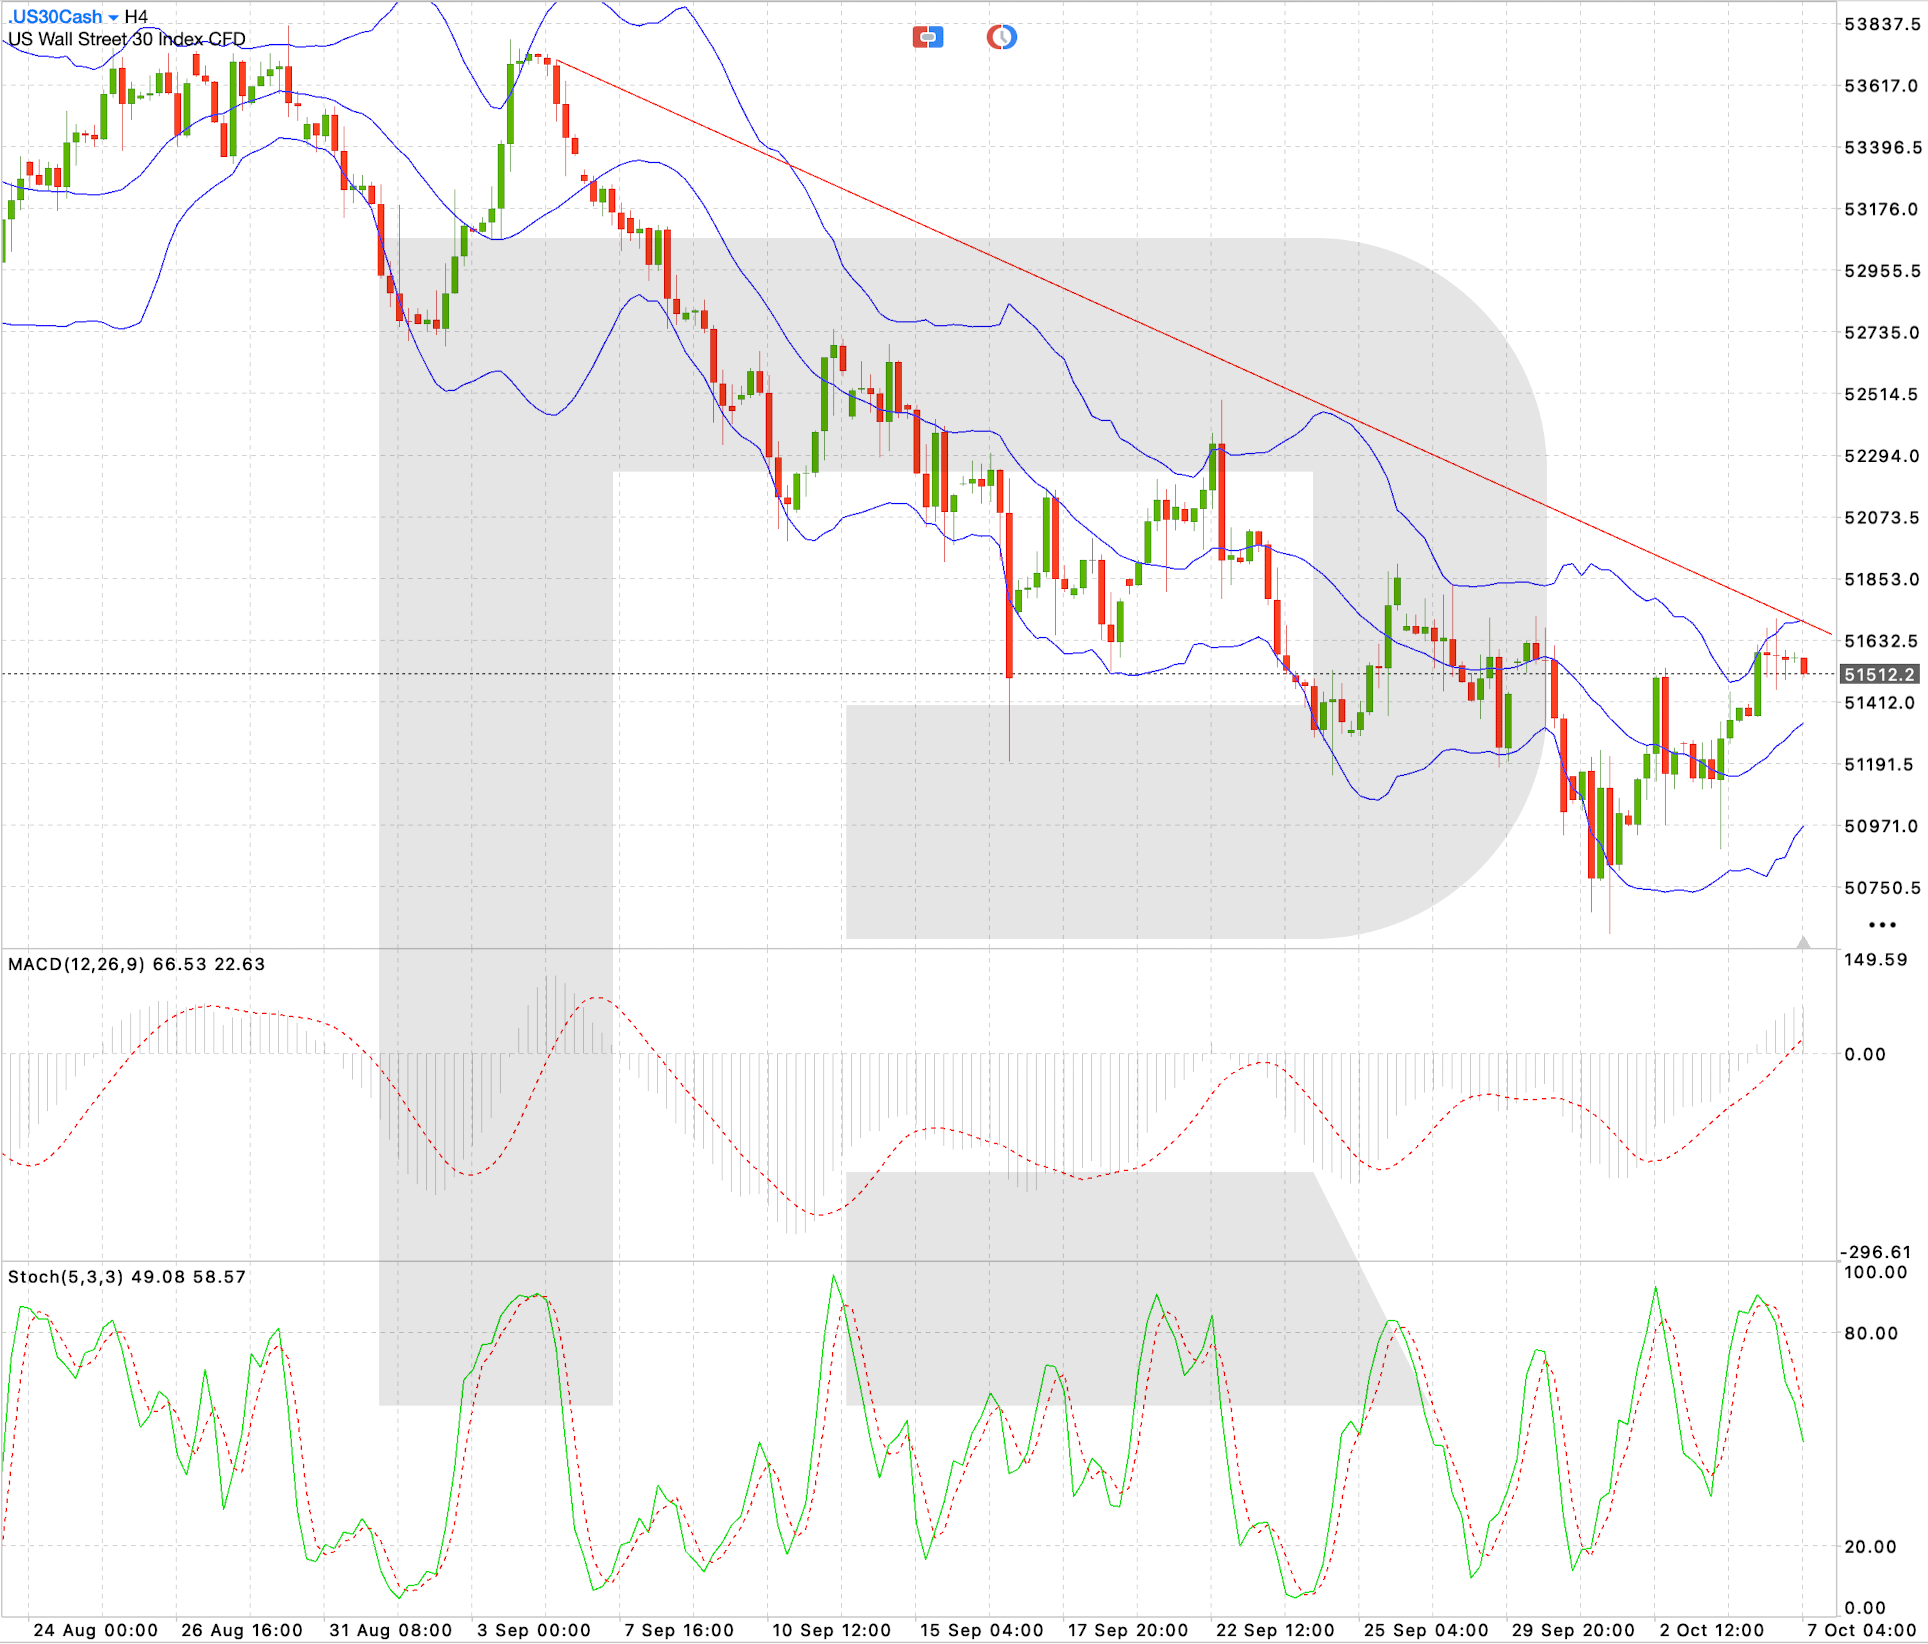
On the H4 timeframe, the US 30 is recovering after rebounding from the 50,750.50 area. The price has formed a series of higher local lows and moved above the middle Bollinger Band, but it is now approaching the descending trendline that has capped gains since early September.
MACD has risen above the zero line, with the indicator line above the signal line, confirming strengthening recovery momentum. At the same time, the Stochastic Oscillator is beginning to decline from the upper part of the neutral zone. This warns of a possible local correction before another attempt to move higher.
The key resistance area remains 51,650.00–51,670.00, where the descending trendline is located. A breakout above it would confirm a change in the short-term structure and open the way towards 51,853.00 and then 52,073.50. A decline below 51,412.00 would weaken the recovery scenario and bring the 51,191.50 support level back into focus.
US 30 trading scenario for today
- Asset: US30
- Timeframe: H4 (Intraday)
- Trend: recovery within a medium-term downtrend
- Key resistance levels: 51,670.00 and 51,853.00
- Key support levels: 51,412.00 and 51,191.50
Trading scenario (Buy Stop)
A breakout above the descending trendline and a consolidation above 51,670.00 would confirm increasing buying pressure and open the door for an upward correction.
- Current price: 51,512.20
- Entry level: 51,670.00
- Take profit: 52,070.00
- Stop loss: 51,470.00
- Risk-to-reward ratio: 1:2.00
The trade idea is valid until 8:00 AM on 8 October 2026 (server time, UTC+3).
Risk factors
The main risk to the bullish US 30 scenario is a hawkish tone in the Federal Reserve minutes, which could push Treasury yields higher again and increase pressure on equities. A further risk is the recovery in oil prices and the associated inflation concerns. Failure to break above the descending trendline and a move back below 51,412.00 would increase the likelihood of a decline towards 51,191.50.
Summary
The US 30 index is recovering alongside the broader Wall Street rally, but it needs to break above the descending trendline to extend the move. The US 30 forecast for today, 7 October 2026, does not rule out a rise towards 51,853.00 and then 52,073.50.
Editors’ picks
 EURUSD forecast 2026–2027: technical analysis, price levels & predictions
The EURUSD outlook for 2026 and 2027: key levels on the daily chart, three trading scenarios and the policy gap between the Fed and the ECB that drives the pair.
 Gold (XAUUSD) forecast 2026: technical analysis, price levels & predictions
Where gold could trade in 2026: key levels, three trading scenarios with entry triggers and the forecasts from J.P. Morgan, Deutsche Bank and Goldman Sachs.
Forecasts presented in this section only reflect the author’s private opinion and should not be considered as guidance for trading. RoboForex bears no responsibility for trading results based on trading recommendations described in these analytical reviews.