
US 30: the index attempts to rise, but bears remain in control
The US 30 index is hovering around 51,870. The price has rebounded from the support level and is attempting to shift the trend upwards. Discover more in our analysis for 14 October 2026.
US 30 forecast: key takeaways
- US initial jobless claims came in at 197 thousand
- The rise in US government bond yields has paused, but further increases remain likely
- US 30 forecast for 14 October 2026: 53,150.00
US 30 fundamental analysis
The US initial jobless claims data published on 8 October 2026 indicates that the US labour market remains relatively resilient. New claims totalled 197 thousand, compared to an analyst forecast of 200 thousand and the previous reading of 199 thousand. Thus, the actual figure was 3 thousand below market expectations and declined by 2 thousand from the previous reporting period. This trend indicates no significant increase in layoffs and suggests that US companies continue to retain a substantial share of existing jobs.
For the US 30 index, which reflects the performance of 30 major US companies, the decline in initial jobless claims could provide support in the medium term. Labour market resilience reduces concerns about a potential economic downturn, which is particularly important for companies in the industrial, financial, and consumer sectors holding significant weight in the index. If employment remains high, companies can count on relatively steady domestic demand, continued implementation of investment programs, and sustained business activity. This sets the stage for improved financial performance among major US corporations and could support stronger demand for their shares.
The US 30 outlook is positive.
US 30 technical analysis
On the H4 chart, the US 30 index has formed a support level at 51,680.00 and a resistance level at 52,380.00. The broader trend remains bearish, although the price is attempting to move higher. On the D1 chart, a resistance level is located at 51,900.00, while support lies at 50,580.00. On the H4 chart, quotes have already formed an uptrend, with the first upside target at 53,150.00.
At the same time, the US 30 forecast also considers an alternative market scenario in which the price could break below 50,580.00 and move towards 49,790.00.
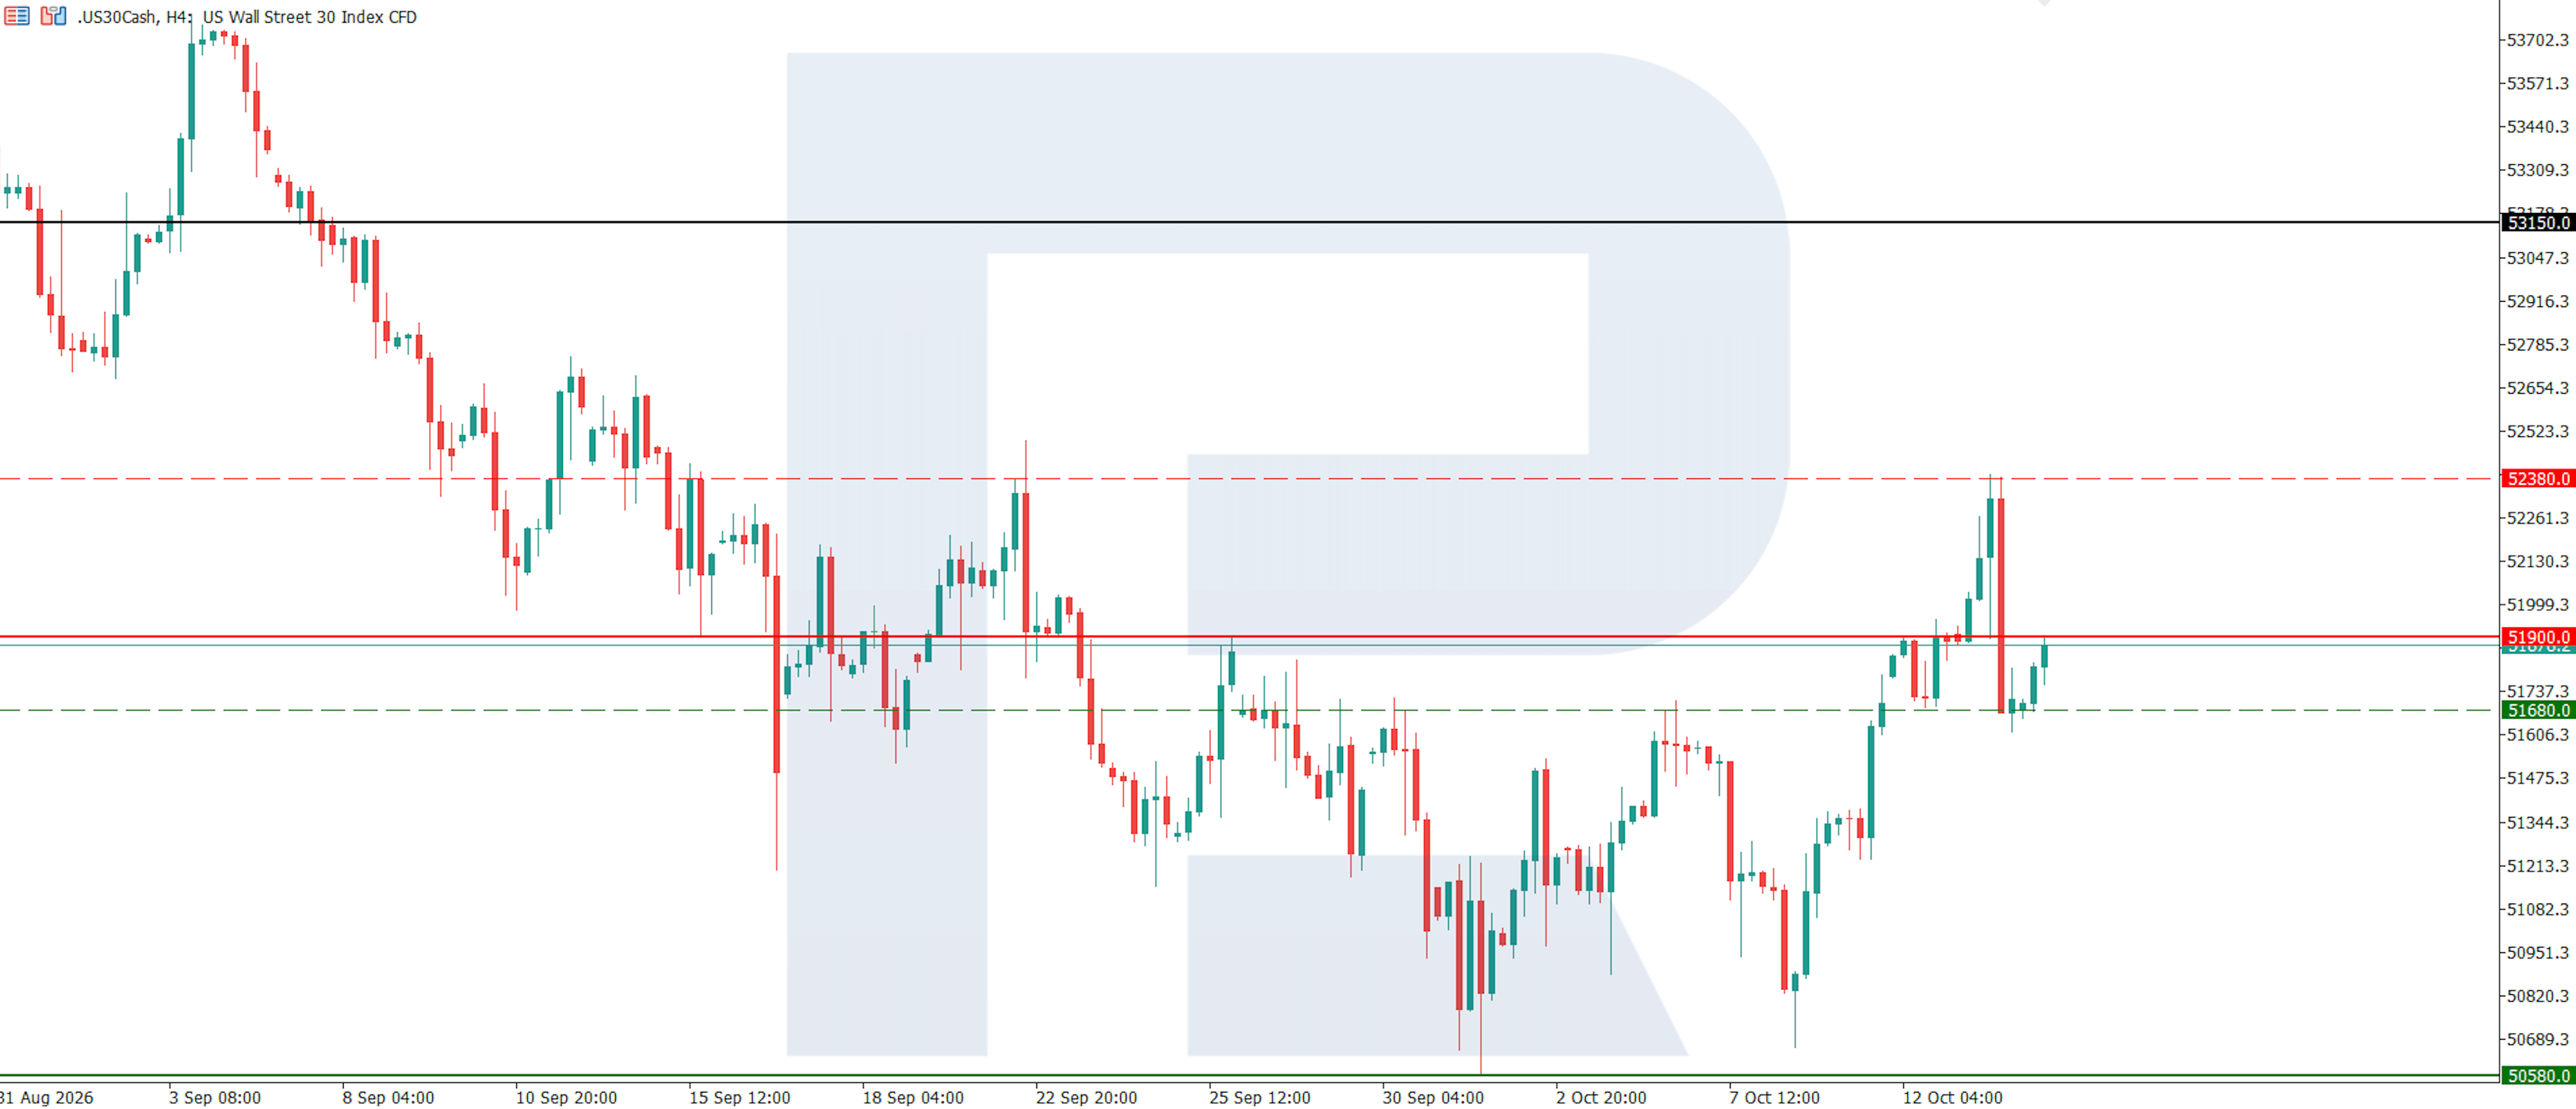
US 30 trading scenario for today
- Asset: US30
- Timeframe: H4 (Intraday)
- Trend: bullish
- Key resistance levels: 51,900.00 and 52,380.00
- Key support levels: 51,680.00 and 50,580.00
Trading scenario (Buy Stop)
A breakout above the descending trendline and a consolidation above 51,900.00 would confirm increasing buying pressure and create conditions for an upward correction.
- Current price: 51,870.00
- Entry level: 52,000.00
- Stop loss: 51,600.00
- Take profit: 53,150.00
- Risk-to-reward ratio: 1:2.88
The trade idea is valid until 8:00 AM on 21 October 2026 (server time, UTC+3).
Risk factors
The main risks for the US 30 index are linked to the possibility that the Federal Reserve maintains a restrictive monetary policy amid a resilient labour market. This could drive up US government bond yields, increase borrowing costs, and reduce the attractiveness of equities. Additional pressure on the stock market could come from slower job creation, weaker consumer demand, and deteriorating financial results of US companies.
Summary
The published US initial jobless claims data generally indicates continued economic resilience and is a moderately positive factor for the fundamental outlook of the US 30 index. Companies in the financial, industrial, and consumer sectors, whose financial results directly depend on domestic economic activity, stand to benefit the most. The US 30 forecast for today, 14 October 2026, suggests a rise towards the 53,150.00 target.
Editors’ picks
 EURUSD forecast 2026–2027: technical analysis, price levels & predictions
The EURUSD outlook for 2026 and 2027: key levels on the daily chart, three trading scenarios and the policy gap between the Fed and the ECB that drives the pair.
 Gold (XAUUSD) forecast 2026: technical analysis, price levels & predictions
Where gold could trade in 2026: key levels, three trading scenarios with entry triggers and the forecasts from J.P. Morgan, Deutsche Bank and Goldman Sachs.
Forecasts presented in this section only reflect the author’s private opinion and should not be considered as guidance for trading. RoboForex bears no responsibility for trading results based on trading recommendations described in these analytical reviews.