US 500 forecast: the index is trading sideways
The US 500 tested the support level and entered a sideways channel, although the downtrend still prevails. The US 500 forecast for today is negative.
US 500 forecast: key takeaways
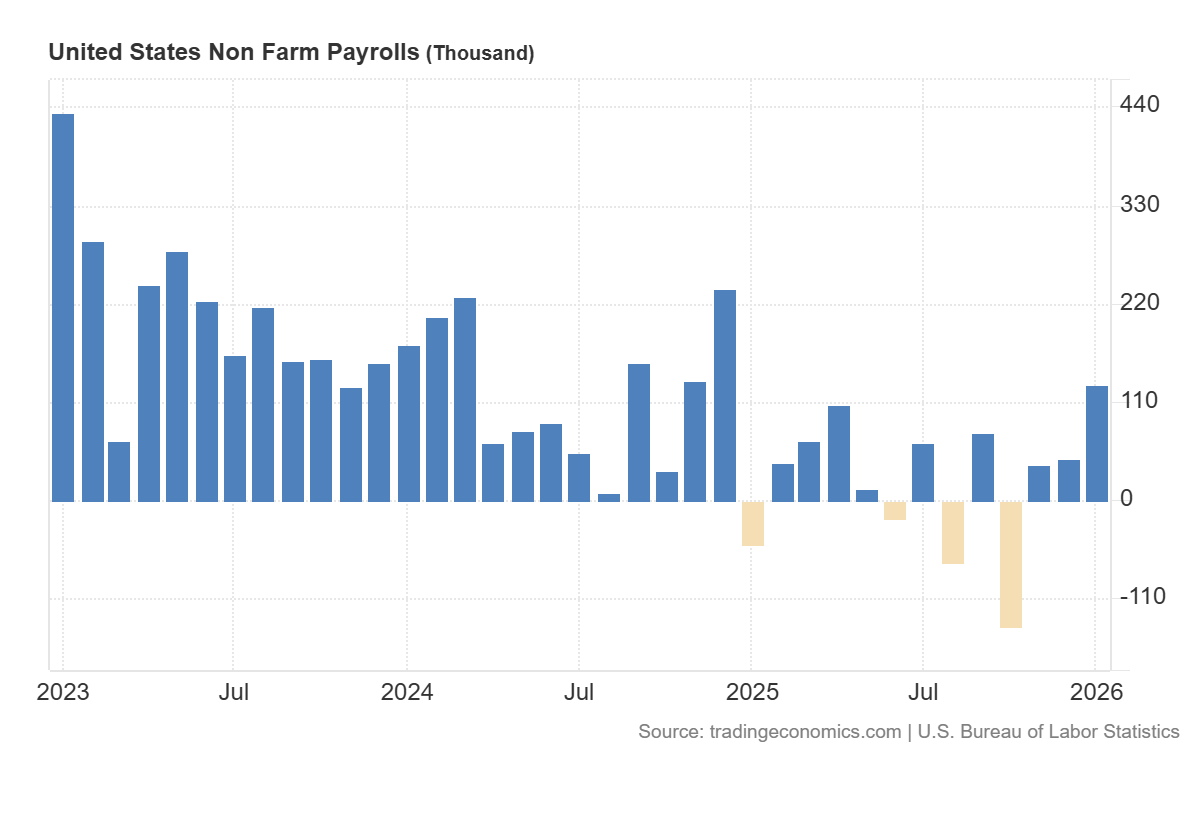
- Recent data: US Nonfarm Payrolls increased to 130 thousand in January
- Market impact: the data negatively impacts the equity market
US 500 fundamental analysis
The release of January US employment data forms a moderately positive yet mixed signal for the US 500 index. Job growth of 130 thousand versus an expected 66 thousand, along with a decline in unemployment to 4.3%, confirms economic resilience. This is important for the equity market, as a strong labour market typically supports consumer demand, corporate revenues, and earnings expectations for the coming quarters. For this reason, the baseline fundamental backdrop for US equities remains constructive.
At the same time, this report reduces the likelihood of rapid monetary easing. Stronger employment and lower unemployment imply that the Federal Reserve has fewer reasons to move quickly towards rate cuts. This may be accompanied by higher Treasury yields and an increased cost of capital for businesses. Under such conditions, the US 500 index typically does not receive a clear boost immediately after the release: solid macroeconomic conditions support corporate performance, while tighter rate expectations limit the growth of multiples.
US 500 technical analysis
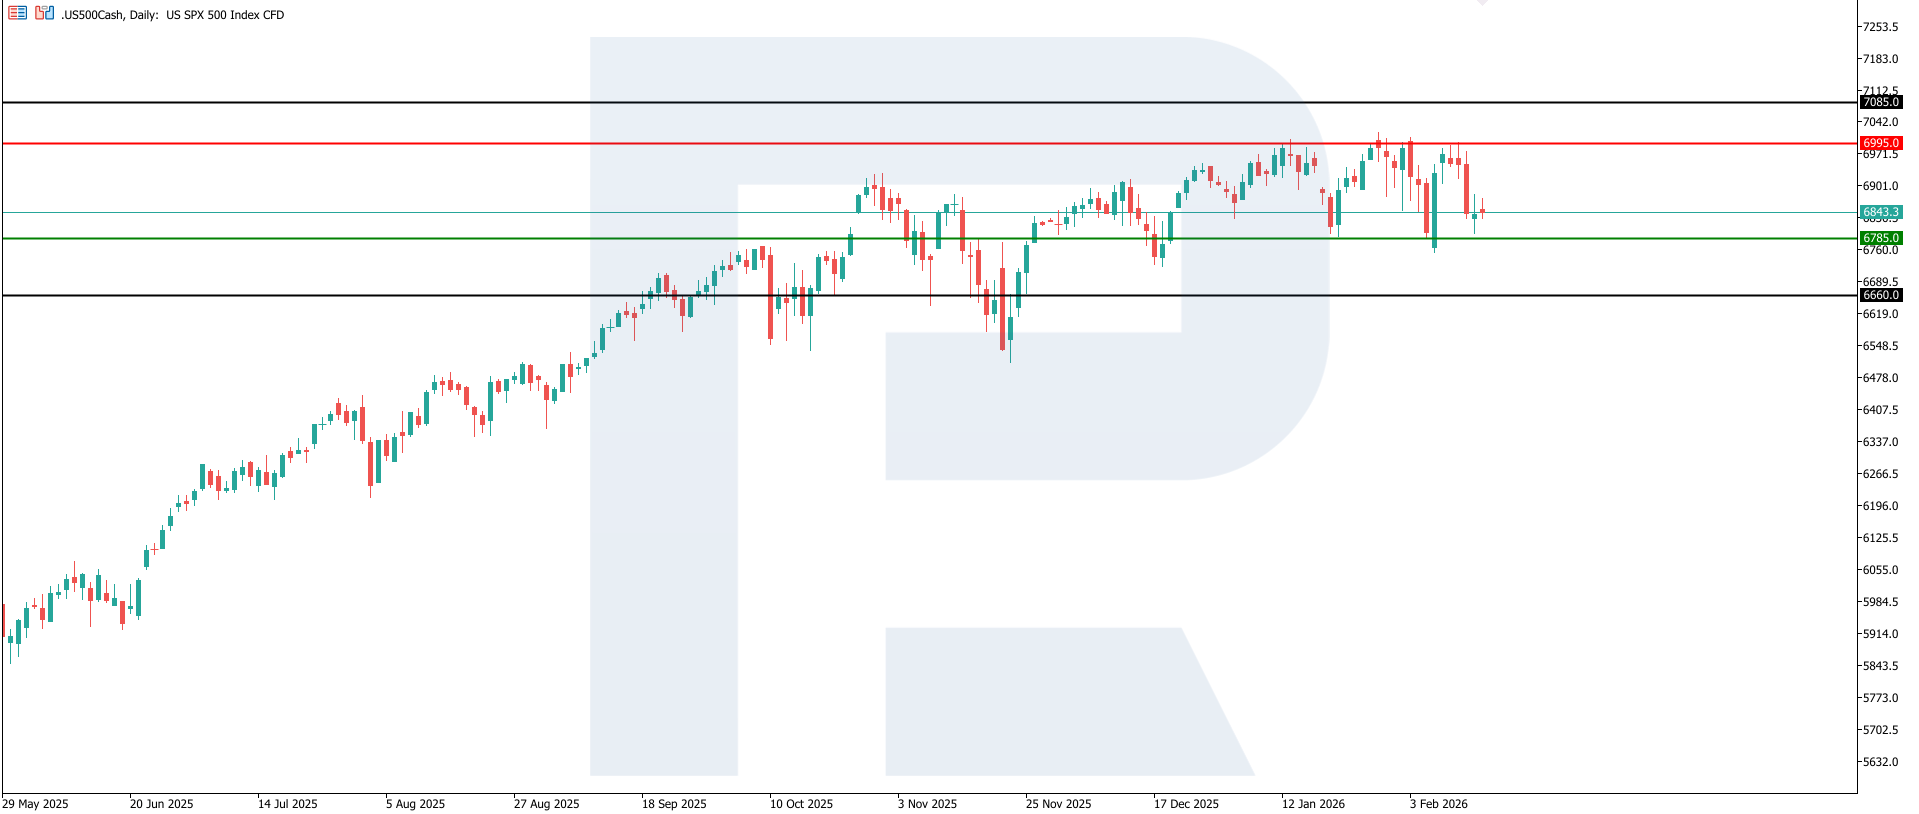
The US 500 index has formed a support level at 6,785.0 and a resistance level at 6,995.0. At this stage, volatility remains elevated: after shifting into a downtrend, the market entered an active correction phase and approached the upper resistance level. If the decline resumes, the downside target could be 6,660.0.
The US 500 price forecast considers the following scenarios:
- Pessimistic US 500 forecast: a breakout below the 6,785.0 support level could push the index down to 6,660.0
- Optimistic US 500 forecast: a breakout above the 6,995.0 resistance level could drive the index to 7,085.0
Summary
The release supports the broader economic backdrop and corporate earnings expectations but remains neutral-to-restrictive for the index itself due to the probable reassessment of the Federal Reserve’s rate trajectory. In the short term, upcoming inflation data and central bank commentary will be decisive: they will determine whether resilient economic growth or tighter financial conditions become the dominant driver for the US equity market. From a technical perspective, the US 500 index may decline to 6,660.0.
Editors’ picks
 EURUSD 2026-2027 forecast: key market trends and future predictions
This article provides the EURUSD forecast for 2026 and 2027 and highlights the main factors determining the direction of the pair’s movements. We will apply technical analysis, take into account the opinions of leading experts, large banks, and financial institutions, and study AI-based forecasts. This comprehensive insight into EURUSD predictions should help investors and traders make informed decisions.
 Gold (XAUUSD) forecast 2026 and beyond: expert insights, price predictions, and analysis
Dive deep into the Gold (XAUUSD) price outlook for 2026 and beyond, combining technical analysis, expert forecasts, and key macroeconomic factors. It explains the drivers behind gold’s recent surge, explores potential scenarios including a move toward 4,500 to 5,000 USD per ounce, and highlights why the metal remains a strong hedge during global uncertainty.
Forecasts presented in this section only reflect the author’s private opinion and should not be considered as guidance for trading. RoboForex bears no responsibility for trading results based on trading recommendations described in these analytical reviews.