US 500 forecast: the index failed to break out of the sideways channel
The US 500 continues to trade in a sideways trend. The US 500 forecast for today is negative.
US 500 forecast: key takeaways
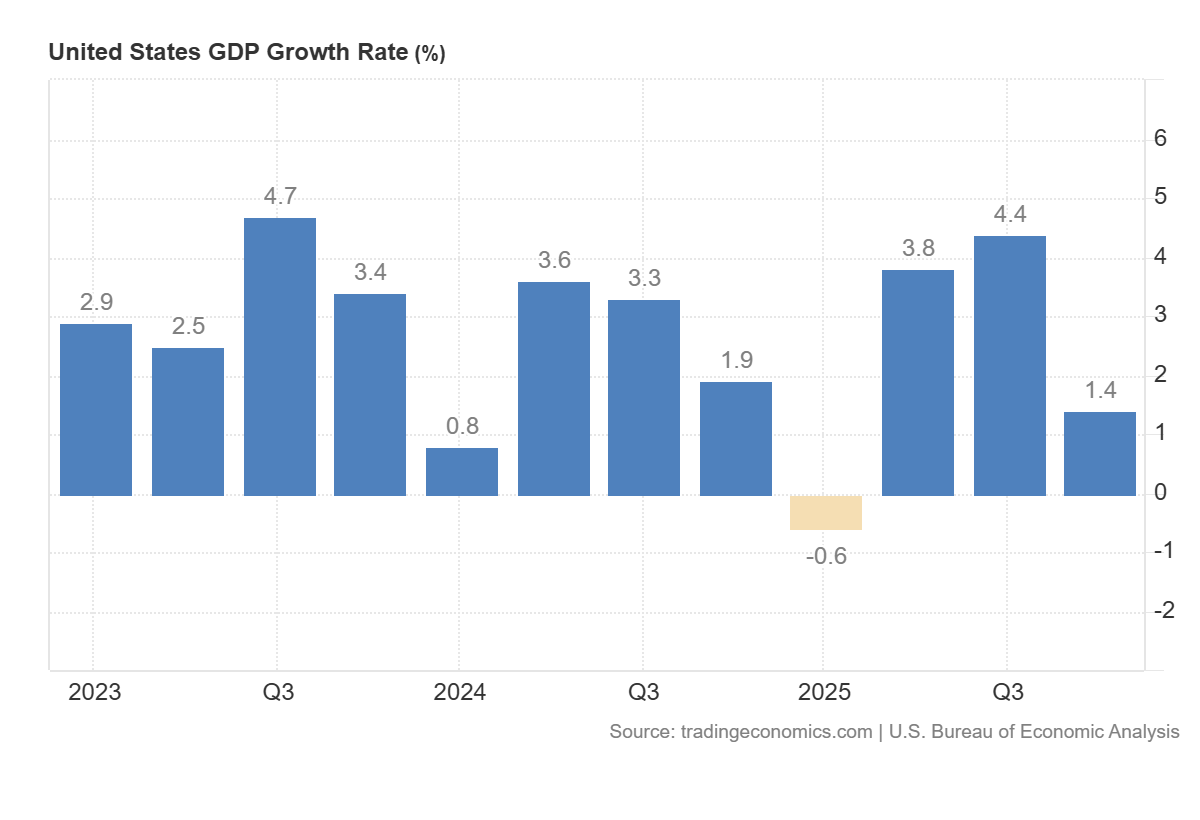
- Recent data: US GDP grew by 1.4% in Q4 2025
- Market impact: the data is negative for the equity market
US 500 fundamental analysis
The release of US GDP data, with actual growth at 1.4% below expectations of 2.8% and the previous reading of 4.4%, represents a significant negative deviation and typically exerts downward pressure on the US 500 index in the short term. Such a result indicates a substantial slowdown in economic momentum, which weakens expectations for corporate revenue and earnings growth in the coming quarters. For the market, this increases sensitivity to any signs of weakening demand and reinforces investor caution, particularly in segments where financial performance is directly tied to overall business activity.
At the same time, the US 500 reaction may not be linear, as weak GDP data also reshapes monetary policy expectations. Slower growth raises the likelihood of a more accommodative rate trajectory and may lead to lower government bond yields, partially offseting the negative impact on the stock market through cheaper financing.
US 500 technical analysis
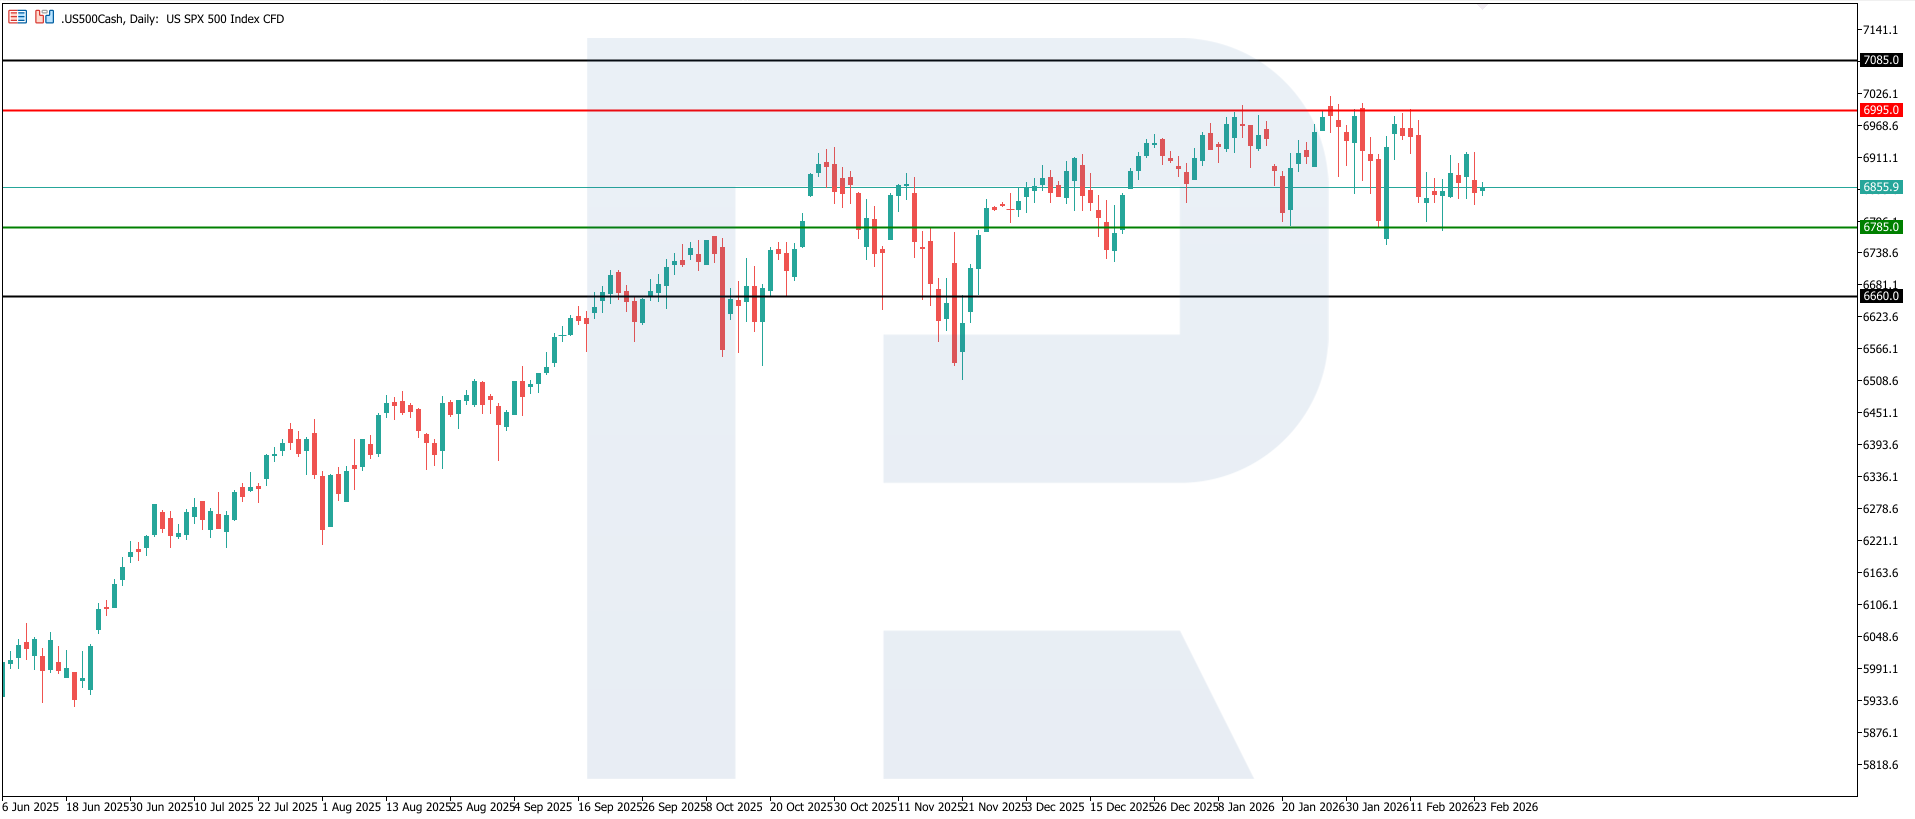
The US 500 index has formed a support level at 6,785.0 and a resistance level at 6,995.0. At this stage, volatility remains elevated: after shifting into a downtrend, the market entered an active correction phase and approached the upper resistance level. If the decline resumes, the downside target could be 6,660.0.
The US 500 price forecast considers the following scenarios:
- Pessimistic US 500 forecast: a breakout below the 6,785.0 support level could send the index down to 6,660.0
- Optimistic US 500 forecast: a breakout above the 6,995.0 resistance level could boost the index to 7,085.0
Summary
Weak GDP data is an unfavorable signal for corporate earnings expectations and increases the risk of a short-term decline in the index. At the same time, it raises the likelihood of easing financial conditions, which may partially stabilise the market and shift demand towards specific sectors. The baseline scenario following such a release suggests a more cautious and mixed outlook, with a focus on company quality and heightened sensitivity to upcoming inflation and labour market data, as well as Federal Reserve statements. From a technical perspective, the US 500 index may decline to 6,660.0.
Editors’ picks
 EURUSD 2026-2027 forecast: key market trends and future predictions
This article provides the EURUSD forecast for 2026 and 2027 and highlights the main factors determining the direction of the pair’s movements. We will apply technical analysis, take into account the opinions of leading experts, large banks, and financial institutions, and study AI-based forecasts. This comprehensive insight into EURUSD predictions should help investors and traders make informed decisions.
 Gold (XAUUSD) forecast 2026 and beyond: expert insights, price predictions, and analysis
Dive deep into the Gold (XAUUSD) price outlook for 2026 and beyond, combining technical analysis, expert forecasts, and key macroeconomic factors. It explains the drivers behind gold’s recent surge, explores potential scenarios including a move toward 4,500 to 5,000 USD per ounce, and highlights why the metal remains a strong hedge during global uncertainty.
Forecasts presented in this section only reflect the author’s private opinion and should not be considered as guidance for trading. RoboForex bears no responsibility for trading results based on trading recommendations described in these analytical reviews.