US 500 forecast: the index is correcting after the sell-off
Amid escalating tensions in the Middle East, the US 500 plunged by 4.5% and is now undergoing a correction. The US 500 forecast for today is negative.
US 500 forecast: key takeaways
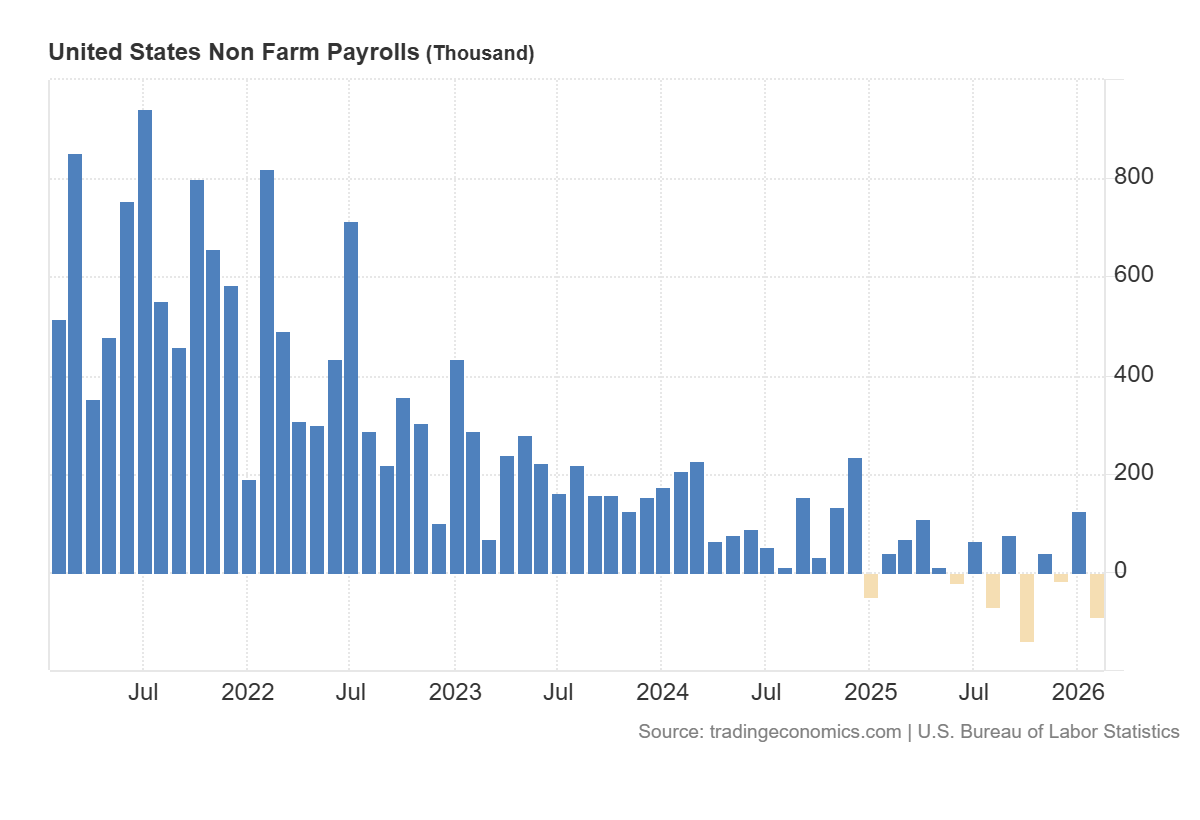
- Recent data: US Nonfarm Payrolls came in at -92 thousand in February 2026
- Market impact: the impact on the equity market is neutral
US 500 fundamental analysis
The release of US Nonfarm Payrolls at -92 thousand, below a forecast of a 58 thousand gain, is a clearly negative signal for the equity market. This result means the US economy did not add jobs; on the contrary, employment declined. For the US 500 index, this typically implies stronger short-term pressure, as investors start pricing in weaker economic growth prospects, more cautious corporate guidance, and an increased risk of deteriorating company financial performance in the coming quarters.
In this situation, mixed price action is most likely. Pressure may emerge first in cyclical industries whose results directly depend on the pace of economic growth. These include industrials, consumer discretionary (durable goods), transportation, financials, and parts of the materials/commodities segment. The market may begin to price in weaker revenues and slower profit growth specifically in these sectors.
US 500 technical analysis
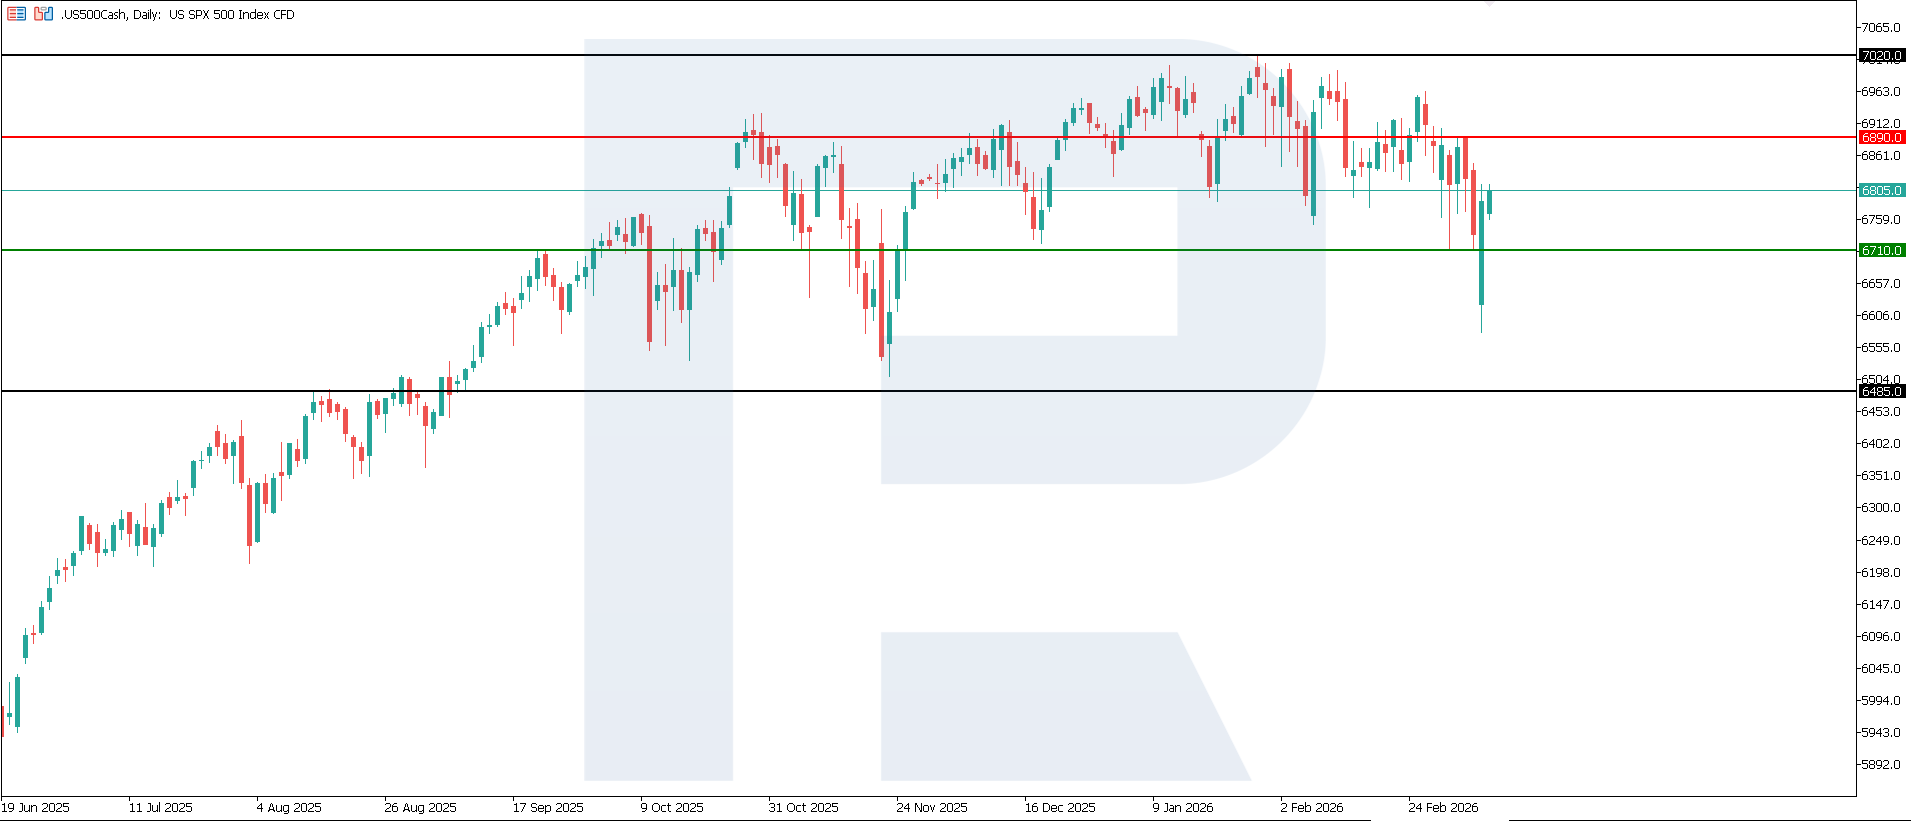
The US 500 index has formed a support level near 6,710.0, while a key resistance level lies around 6,890.0. Volatility remains elevated: after the trend shifted to bearish, the market moved into an active correction phase and formed a new support level. If the decline resumes, the nearest downside target could be 6,485.0.
The US 500 price forecast considers the following scenarios:
- Pessimistic US 500 forecast: a breakout below the 6,710.0 support level could push the index down to 6,485.0
- Optimistic US 500 forecast: a breakout above the 6,890.0 resistance level could drive the index up to 7,020.0
Summary
Overall, the published data primarily signal a risk of a US economic slowdown for the US 500 index. Such figures can negatively affect corporate earnings expectations and equity market sentiment in the near term. However, the scale and duration of the reaction will largely depend on how investors interpret the data: as a sign of a deeper weakening in economic activity or as a factor that could accelerate the Federal Reserve’s monetary easing. From a technical perspective, the US 500 index could fall to 6,485.0.
Editors’ picks
 EURUSD 2026-2027 forecast: key market trends and future predictions
This article provides the EURUSD forecast for 2026 and 2027 and highlights the main factors determining the direction of the pair’s movements. We will apply technical analysis, take into account the opinions of leading experts, large banks, and financial institutions, and study AI-based forecasts. This comprehensive insight into EURUSD predictions should help investors and traders make informed decisions.
 Gold (XAUUSD) forecast 2026 and beyond: expert insights, price predictions, and analysis
Dive deep into the Gold (XAUUSD) price outlook for 2026 and beyond, combining technical analysis, expert forecasts, and key macroeconomic factors. It explains the drivers behind gold’s recent surge, explores potential scenarios including a move toward 4,500 to 5,000 USD per ounce, and highlights why the metal remains a strong hedge during global uncertainty.
Forecasts presented in this section only reflect the author’s private opinion and should not be considered as guidance for trading. RoboForex bears no responsibility for trading results based on trading recommendations described in these analytical reviews.