US 500 forecast: the index halts its decline
After the sell-off, the US 500 rebounded and formed a support level. The US 500 forecast for today is negative.
US 500 forecast: key takeaways
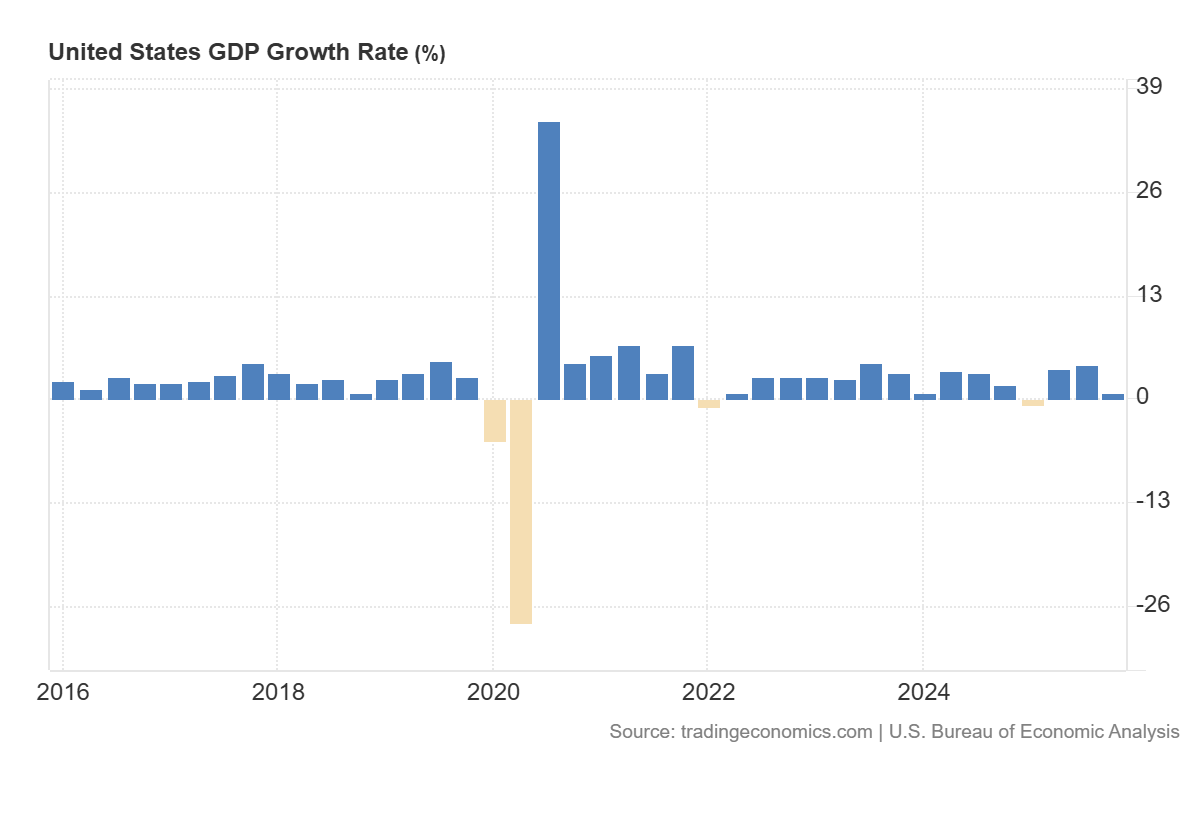
- Recent data: US GDP growth in Q4 2025 came in at 0.7%
- Market impact: the data is negative for the US stock market
US 500 fundamental analysis
A much weaker-than-expected US quarterly GDP growth release, with the actual figure coming in at 0.7%, below the forecast of 1.4% and the previous 4.4%, is generally perceived as a negative signal for the US 500 index. This outcome indicates a noticeable slowdown in economic activity, thereby increasing concerns that corporate revenue and earnings growth over the coming quarters may be weaker than previously anticipated. For the index, this primarily means a deterioration in the fundamental backdrop, as investors begin to revise expectations for economic growth, demand, and business investment.
For the US 500, the initial reaction may be mixed, but the overall balance of factors is more likely unfavourable. On the one hand, weaker GDP increases the probability of a more dovish Federal Reserve stance in the future, which typically supports equity valuations via lower bond yields and a lower cost of capital. If the market decides this is not a temporary deviation but the start of a more persistent weakening in activity, the index may come under pressure, as investors would then focus less on potential monetary easing and more on risks to corporate earnings.
US 500 technical analysis
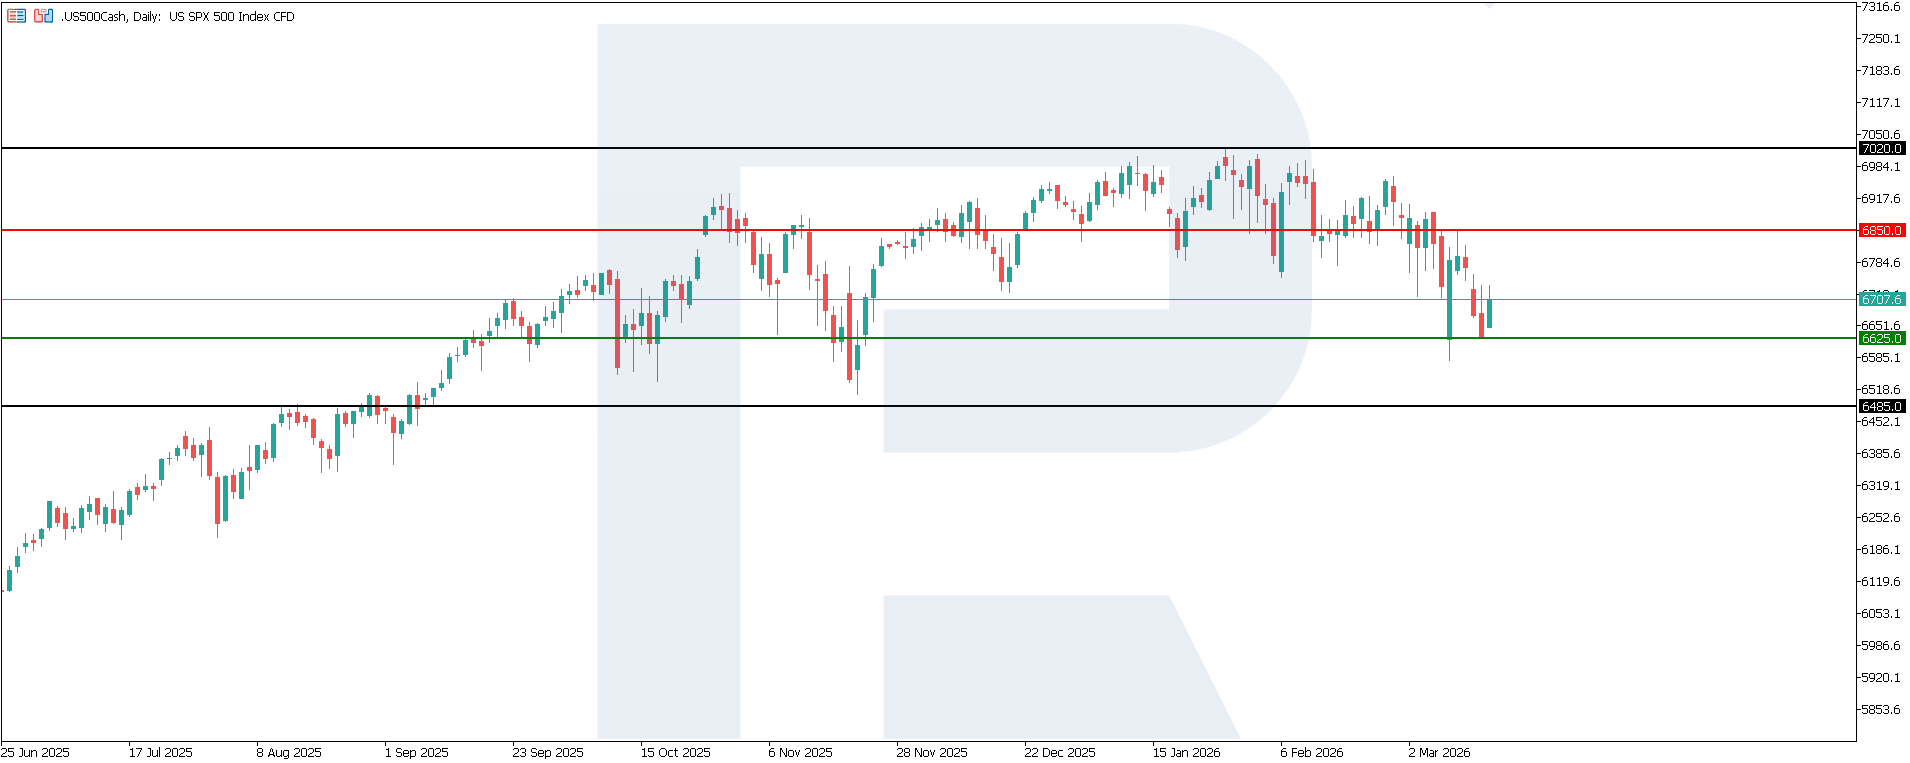
The US 500 index has formed a support level near 6,625.0, while a key resistance level lies around 6,850.0. Volatility remains elevated, making it difficult to estimate how long the current downtrend may last. If the decline resumes, the nearest downside target could be 6,485.0.
The US 500 price forecast considers the following scenarios:
- Pessimistic US 500 forecast: a breakout below the 6,625.0 support level could send the index down to 6,485.0
- Optimistic US 500 forecast: a breakout above the 6,850.0 resistance level could push the index up to 7,020.0
Summary
Overall, the latest data primarily signals a risk of a US economic slowdown for the US 500 index. The most vulnerable segments are industrials, financials, consumer cyclicals, and partly commodities-related sectors, while healthcare, utilities, and consumer staples may prove more resilient. The key question now is whether the market treats this as a temporary slowdown or the beginning of a deeper cooling in the economy – this will largely determine the scale of the next move. From a technical perspective, the US 500 index could fall to 6,485.0.
Editors’ picks
 EURUSD 2026-2027 forecast: key market trends and future predictions
This article provides the EURUSD forecast for 2026 and 2027 and highlights the main factors determining the direction of the pair’s movements. We will apply technical analysis, take into account the opinions of leading experts, large banks, and financial institutions, and study AI-based forecasts. This comprehensive insight into EURUSD predictions should help investors and traders make informed decisions.
 Gold (XAUUSD) forecast 2026 and beyond: expert insights, price predictions, and analysis
Dive deep into the Gold (XAUUSD) price outlook for 2026 and beyond, combining technical analysis, expert forecasts, and key macroeconomic factors. It explains the drivers behind gold’s recent surge, explores potential scenarios including a move toward 4,500 to 5,000 USD per ounce, and highlights why the metal remains a strong hedge during global uncertainty.
Forecasts presented in this section only reflect the author’s private opinion and should not be considered as guidance for trading. RoboForex bears no responsibility for trading results based on trading recommendations described in these analytical reviews.