US 500 forecast: the index falls more than 10%
The US 500 is falling rapidly, exceeding average seasonal fluctuation levels. The US 500 forecast for today is negative.
US 500 forecast: key takeaways
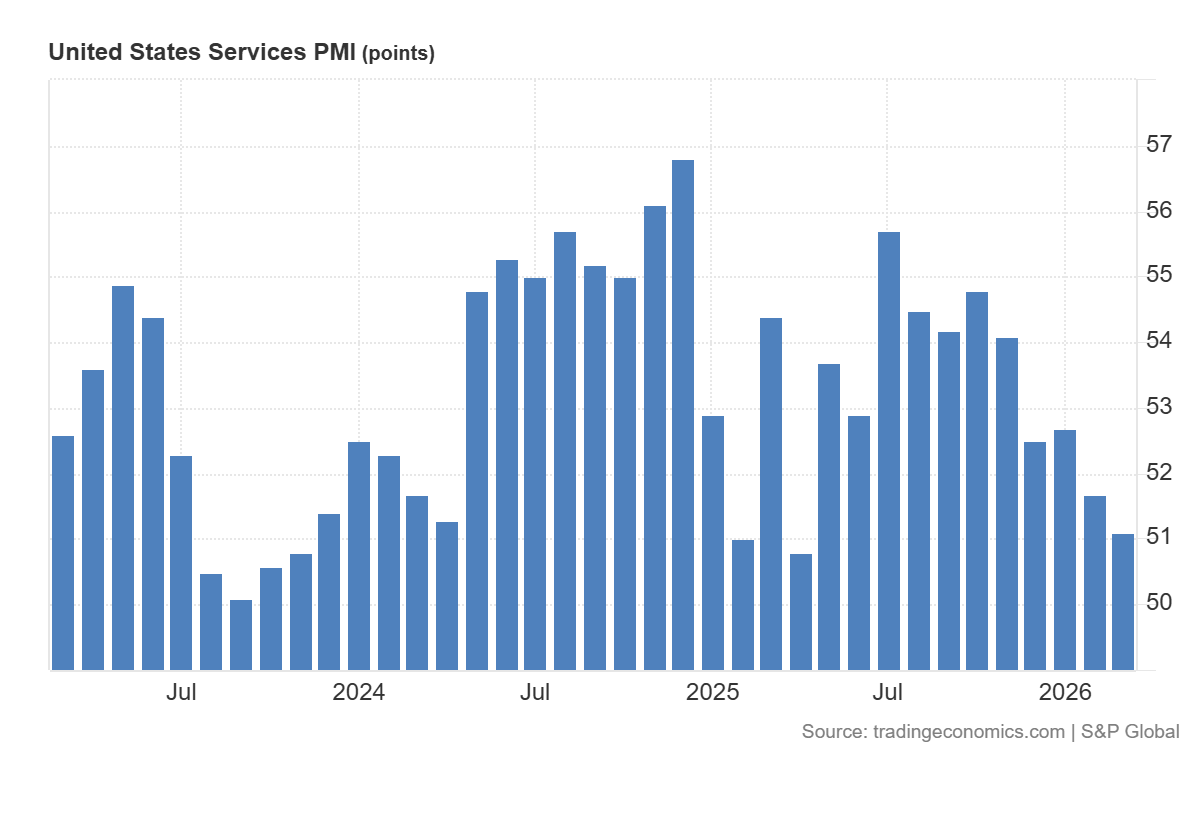
- Recent data: US services PMI preliminarily came in at 51.1 in March
- Market impact: the data is negative for the stock market
US 500 fundamental analysis
The release of the US services PMI data turned out to be moderately weak for equities. The actual US services PMI came in at 51.1 compared to a forecast of 52.0 and a previous reading of 51.7. This means the services sector is still expanding, since the index remains above 50.0, but the pace of growth slowed more than the market expected. At the same time, the reaction is not always entirely negative. Weaker services PMI data can also reduce fears of an overheating economy and overly tight monetary policy.
For the US 500, such news more often creates a moderately negative outlook in the short term. This is especially noticeable if the market had been positioned for stronger macroeconomic data ahead of the release. Investors may begin to revise their revenue growth expectations for companies focused on domestic demand, consumer activity, and corporate spending.
US 500 technical analysis
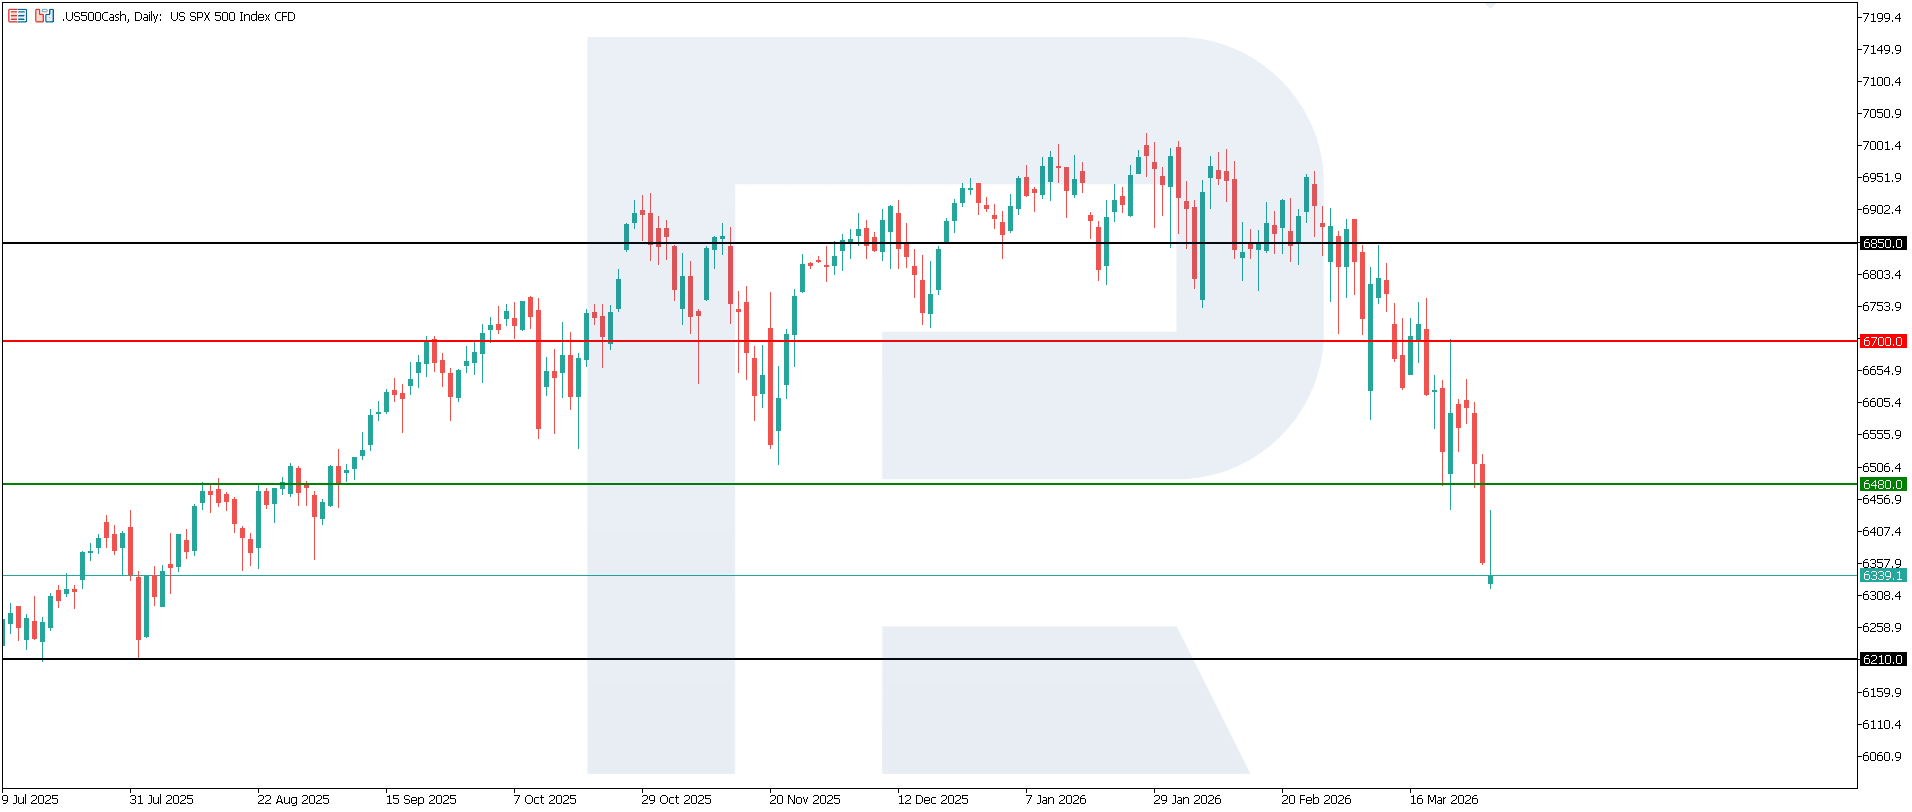
At current levels, the US 500 has declined slightly more than what has typically occurred historically in response to geopolitical shocks, with prices down roughly 6–8% over approximately three weeks. The US 500 formed a resistance level near 6,700.0, while the key support level around 6,480.0 has been broken. If the decline resumes, the next downside target could be 6,210.0.
The US 500 price forecast considers the following scenarios:
- Pessimistic US 500 forecast: if prices consolidate below the previously breached support level at 6,480.0, the index could fall to 6,210.0
- Optimistic US 500 forecast: a breakout above the 6,700.0 resistance level could drive the index up to 6,850.0
Summary
For the US 500, this release is more of a moderately negative signal rather than a critical one. The US economy remains in expansion territory, but the pace of growth in services came in below market expectations. This can cool risk appetite, increase investor caution, and support a partial shift of capital into more defensive segments. If subsequent macroeconomic data also comes in weak, pressure on the market may intensify. From a technical analysis perspective, the US 500 could dip to 6,210.0.
Editors’ picks
 EURUSD 2026-2027 forecast: key market trends and future predictions
This article provides the EURUSD forecast for 2026 and 2027 and highlights the main factors determining the direction of the pair’s movements. We will apply technical analysis, take into account the opinions of leading experts, large banks, and financial institutions, and study AI-based forecasts. This comprehensive insight into EURUSD predictions should help investors and traders make informed decisions.
 Gold (XAUUSD) forecast 2026 and beyond: expert insights, price predictions, and analysis
Dive deep into the Gold (XAUUSD) price outlook for 2026 and beyond, combining technical analysis, expert forecasts, and key macroeconomic factors. It explains the drivers behind gold’s recent surge, explores potential scenarios including a move toward 4,500 to 5,000 USD per ounce, and highlights why the metal remains a strong hedge during global uncertainty.
Forecasts presented in this section only reflect the author’s private opinion and should not be considered as guidance for trading. RoboForex bears no responsibility for trading results based on trading recommendations described in these analytical reviews.