US 500 forecast: the index may enter a sideways channel
The US 500 index sees elevated volatility, with a sideways range likely to form. The US 500 forecast for today is negative.
US 500 forecast: key takeaways
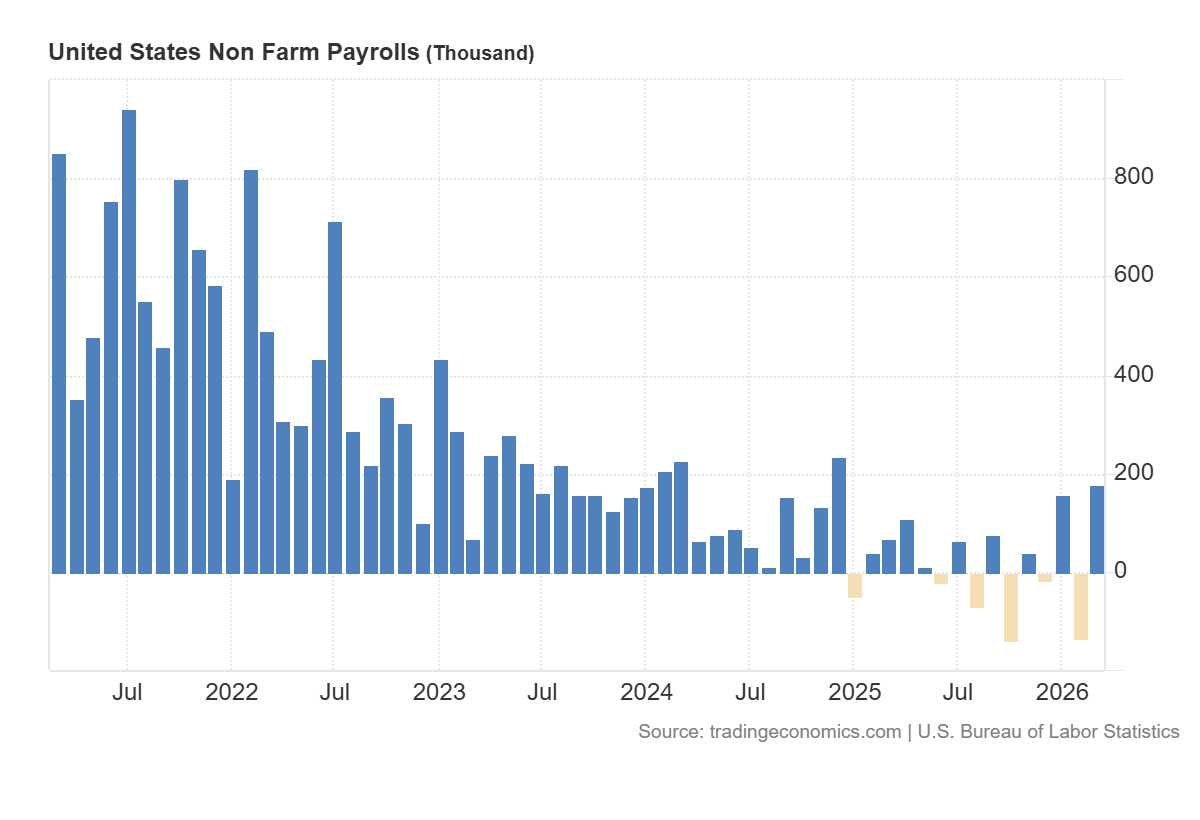
- Recent data: US Nonfarm Payrolls came in at 178 thousand in March
- Market impact: the data is negative for the stock market
US 500 fundamental analysis
On Friday, 3 April, US employment data for March 2026 was released. At first glance, the figures appear very strong: the economy added 178 thousand jobs compared to a forecast of just 49 thousand. But if you look deeper, the picture is not that optimistic. Out of those 178 thousand jobs, about 76 thousand were doctors and healthcare workers who returned to work after the Kaiser Permanente strike ended. In other words, this is not about creating new jobs, but about people returning to their previous positions. Excluding this factor, the real employment gain is 102 thousand.
For the US 500, the impact is not entirely positive. A stronger labour market reduces the likelihood of rapid monetary easing. Following the report, expectations increased that the Federal Reserve will maintain a more hawkish stance and will not rush to cut rates. This is important because the cost of money and bond yields are crucial for stock valuations, especially for large growth companies.
US 500 technical analysis
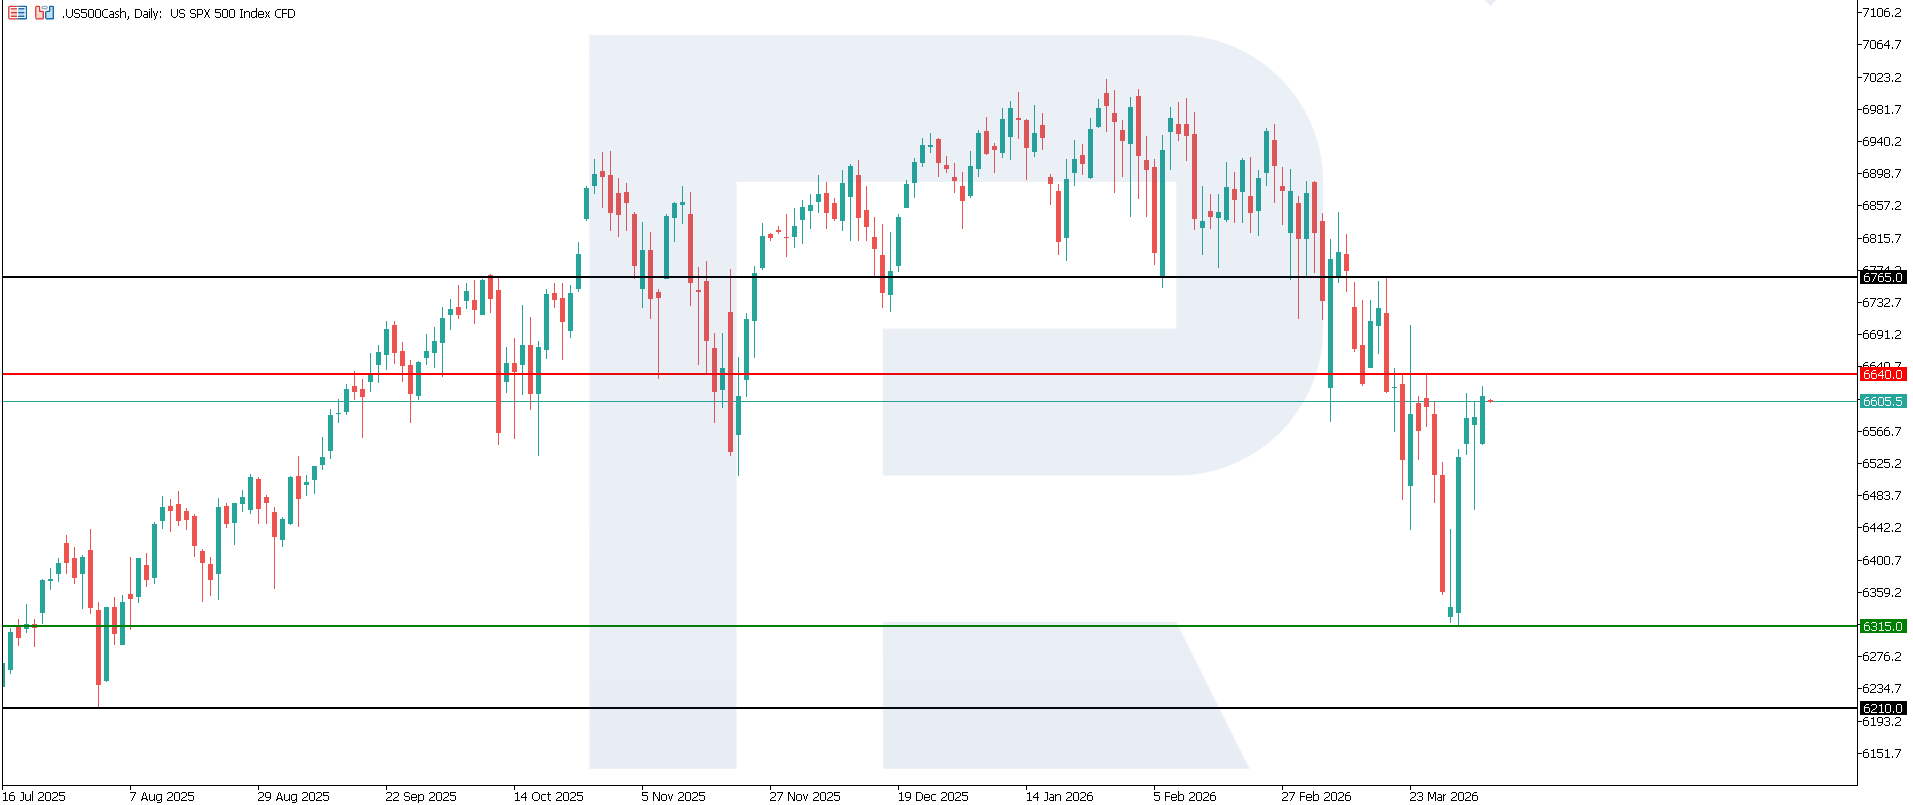
The US 500 index is experiencing elevated volatility, with a resistance level near 6,640.0 and the key support level around 6,315.0. If the decline resumes, the next downside target could be 6,210.0.
The US 500 price forecast considers the following scenarios:
- Pessimistic US 500 forecast: a breakout below the 6,315.0 support level could send the index down to 6,210.0
- Optimistic US 500 forecast: a breakout above the 6,640.0 resistance level could boost the index to 6,765.0
Summary
For the US 500, the data is rather positive, as it confirms the resilience of the US economy and reduces fears of a sharp cooling in activity. For the US equity market overall, this is a favourable signal for corporate earnings and domestic demand. At the same time, it is also a factor that can keep the Federal Reserve from easing quickly, which may limit upside in market segments that are most rate-sensitive. From a technical perspective, the US 500 index may fall to 6,210.0.
Editors’ picks
 EURUSD 2026-2027 forecast: key market trends and future predictions
This article provides the EURUSD forecast for 2026 and 2027 and highlights the main factors determining the direction of the pair’s movements. We will apply technical analysis, take into account the opinions of leading experts, large banks, and financial institutions, and study AI-based forecasts. This comprehensive insight into EURUSD predictions should help investors and traders make informed decisions.
 Gold (XAUUSD) forecast 2026 and beyond: expert insights, price predictions, and analysis
Dive deep into the Gold (XAUUSD) price outlook for 2026 and beyond, combining technical analysis, expert forecasts, and key macroeconomic factors. It explains the drivers behind gold’s recent surge, explores potential scenarios including a move toward 4,500 to 5,000 USD per ounce, and highlights why the metal remains a strong hedge during global uncertainty.
Forecasts presented in this section only reflect the author’s private opinion and should not be considered as guidance for trading. RoboForex bears no responsibility for trading results based on trading recommendations described in these analytical reviews.