US 500 forecast: the index has started a correction
After reaching a new all-time high, the US 500 index has started a correction, which may develop into a downtrend. The US 500 forecast for today is negative.
US 500 forecast: key takeaways
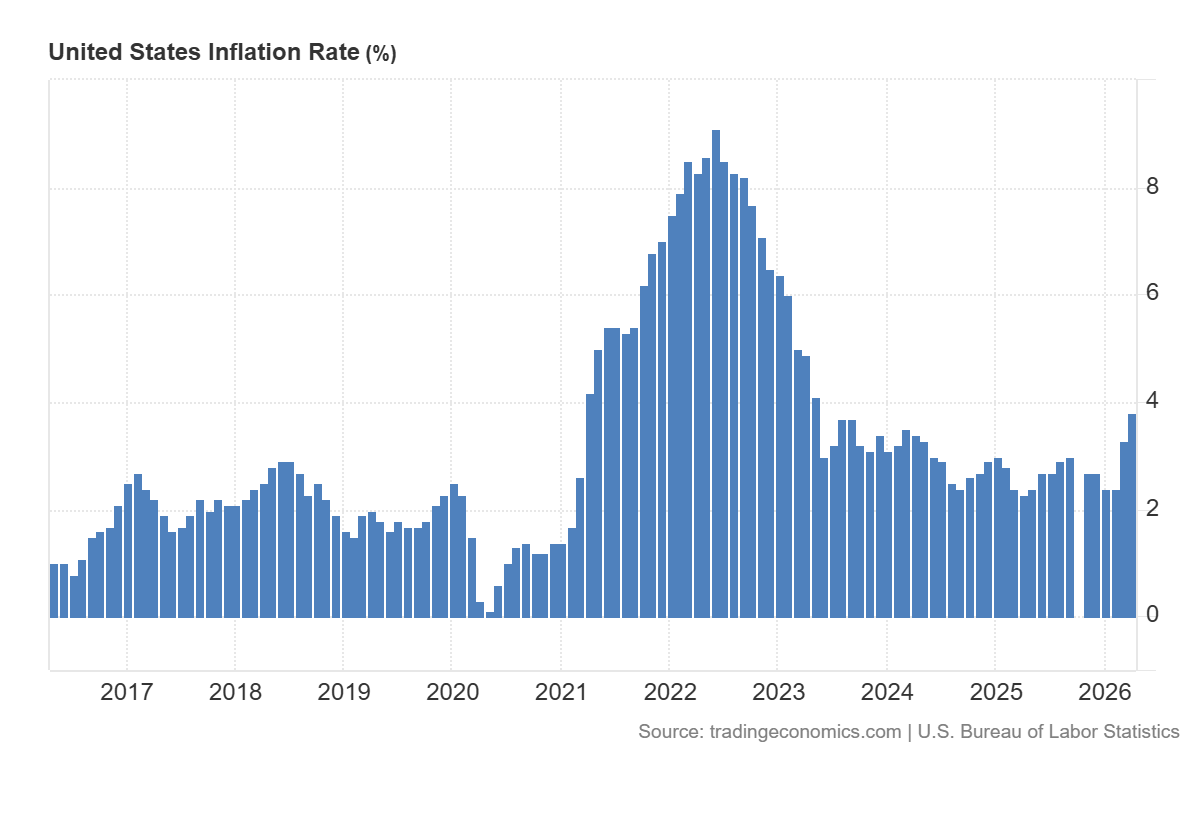
- Recent data: US CPI rose to 3.8% year-on-year in April
- Market impact: the data has a moderately negative effect on the US stock market
US 500 fundamental analysis
The increase in US annual inflation to 3.8%, above the forecast of 3.7% and the previous 3.3%, may have a moderately negative impact on the US 500 index. The data shows that inflationary pressures in the US economy are strengthening faster than expected, reducing the likelihood of imminent monetary easing by the Federal Reserve. For the stock market, this means investors may revise their interest rate expectations and price in a longer period of expensive financing. In such a situation, the US 500 index may face pressure, especially if market participants decide that the Federal Reserve will need to maintain a tighter stance for longer to contain inflation.
For the US stock market overall, this news is a restraining factor. Higher inflation reduces consumers’ real purchasing power, increases companies’ costs, and worsens expectations for future profits. In addition, rising inflation typically supports bond yields, making stocks less attractive than more conservative instruments.
US 500 technical analysis
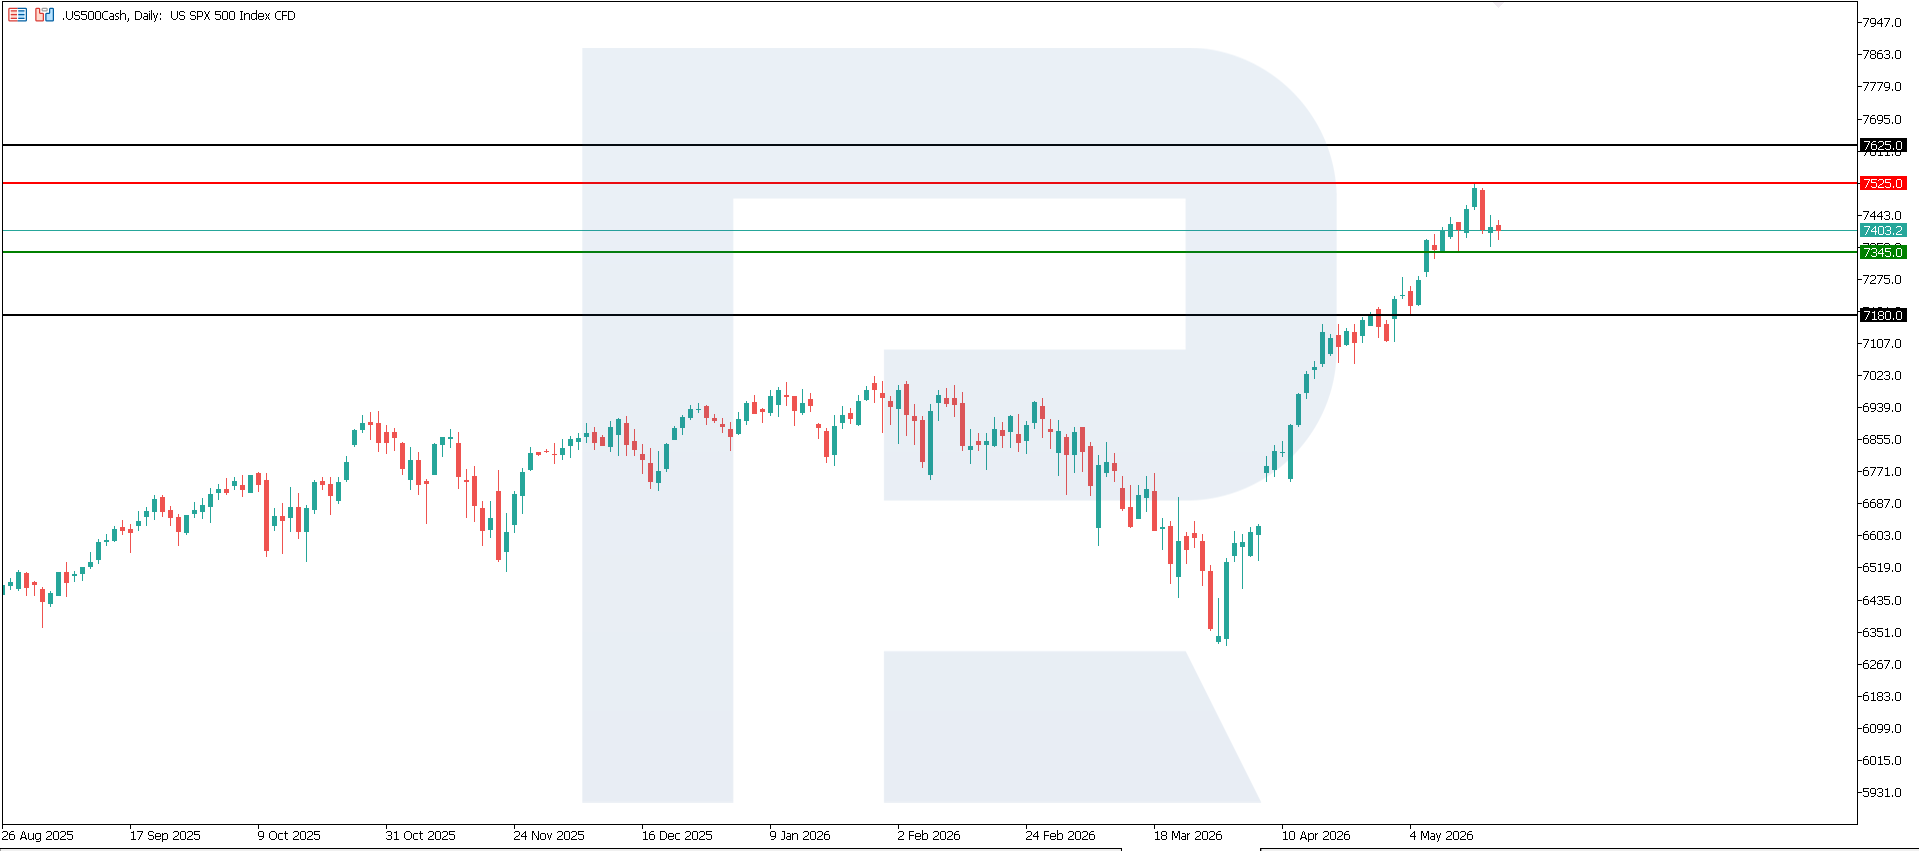
The US 500 index maintains its upward momentum, but the probability of a reversal is increasing. The current correction may turn into a short-term downtrend. The resistance level has formed near 7,525.0, while the key support level lies around 7,345.0. If the trend reverses, the nearest downside target could be around 7,180.0.
The US 500 price forecast considers the following scenarios:
- Pessimistic US 500 forecast: a breakout below the 7,345.0 support level could send the index down to 7,180.0
- Optimistic US 500 forecast: a breakout above the 7,525.0 resistance level could drive the index to 7,625.0
Summary
Overall, the published data is a negative signal for the US 500 and the US stock market, as accelerating inflation increases uncertainty around the Federal Reserve’s future actions. If inflation continues to rise, investors may expect a more cautious policy stance from the regulator, which would limit the upside potential of US stocks, with technology, consumer, and real estate sectors remaining the most vulnerable, while defensive industries may appear more stable amid elevated inflation. From a technical analysis perspective, the US 500 index may fall to 7,180.0.
Editors’ picks
 EURUSD 2026-2027 forecast: key market trends and future predictions
This article provides the EURUSD forecast for 2026 and 2027 and highlights the main factors determining the direction of the pair’s movements. We will apply technical analysis, take into account the opinions of leading experts, large banks, and financial institutions, and study AI-based forecasts. This comprehensive insight into EURUSD predictions should help investors and traders make informed decisions.
 Gold (XAUUSD) forecast 2026 and beyond: expert insights, price predictions, and analysis
Dive deep into the Gold (XAUUSD) price outlook for 2026 and beyond, combining technical analysis, expert forecasts, and key macroeconomic factors. It explains the drivers behind gold’s recent surge, explores potential scenarios including a move toward 4,500 to 5,000 USD per ounce, and highlights why the metal remains a strong hedge during global uncertainty.
Forecasts presented in this section only reflect the author’s private opinion and should not be considered as guidance for trading. RoboForex bears no responsibility for trading results based on trading recommendations described in these analytical reviews.