
Wall Street awaits a new record: US 500 poised to set another all-time high
The pace of growth in the US 500 index is slowing, but the potential for a new all-time high remains. The US 500 forecast for today is positive.
US 500 forecast: key takeaways
- US PPI was unchanged in July compared to June
- The data has a moderately positive impact on the US 500
US 500 fundamental analysis
The US Producer Price Index data for July 2026 can generally be viewed as a moderately positive signal for the US 500 index and the US stock market. The PPI was unchanged from the previous month, while the market had expected a 0.2% increase. In June, the indicator fell by 0.1%. Therefore, immediate inflationary pressure from producers was weaker than expected. At the same time, the structure of the report was mixed: prices for final demand goods fell by 0.7%, largely due to lower energy costs, while prices for services rose by 0.2%.
For the US 500, the main positive factor is that the actual figure came in below expectations. For the stock market, this reduces the risk of further monetary tightening by the Federal Reserve. Against this backdrop, the weak PPI takes on additional significance: it supports the view that further increases in borrowing costs may be unnecessary.
US 500 technical analysis
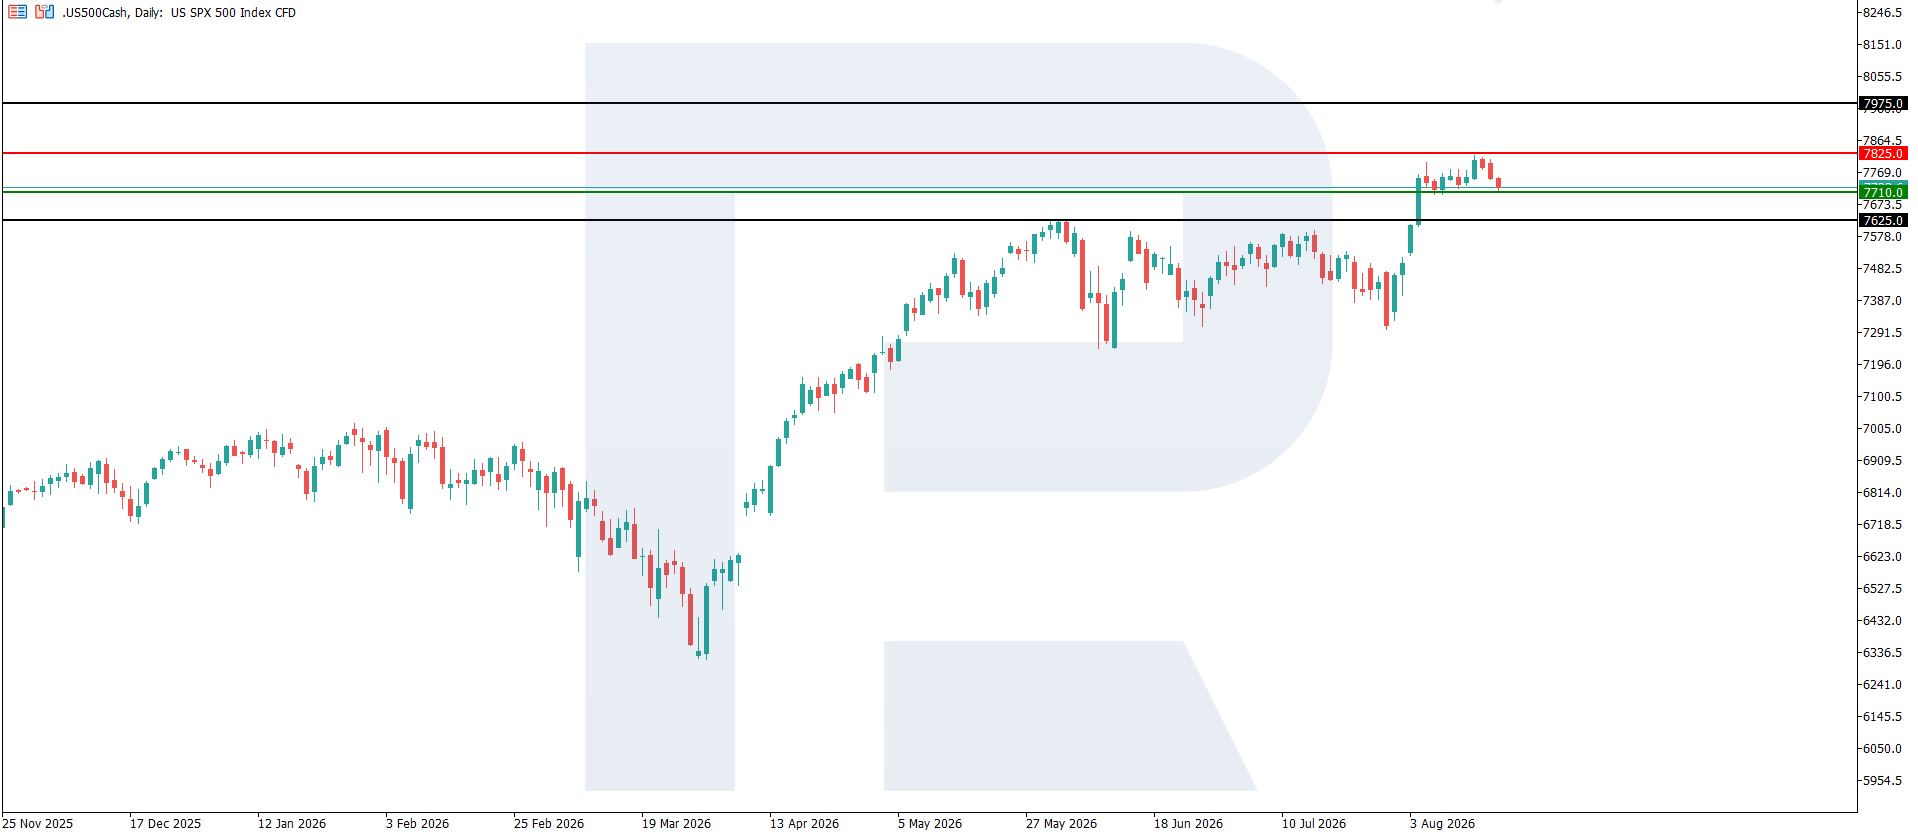
The US 500 index is trading in an uptrend and will highly likely reach another all-time high. A correction may become possible after the index hits 8,000.0. The resistance level has formed at 7,825.0, while support is located at 7,710.0. The most likely nearest upside target is 7,975.0.
The US 500 price forecast considers two scenarios:
- Pessimistic US 500 scenario: a breakout below the 7,710.0 support level could send the index down to 7,625.0
- Optimistic US 500 scenario: a breakout above the 7,825.0 resistance level could push the index further up towards 7,975.0
Summary
Overall, the PPI data creates a moderately positive fundamental backdrop for the US 500. The most favourable scenario for the index is one in which inflation continues to decline gradually, economic growth remains resilient, and the Federal Reserve is able to refrain from raising rates and eventually shift to a more accommodative policy. This combination is typically the most favourable for US equities.
Editors’ picks
 EURUSD forecast 2026–2027: technical analysis, price levels & predictions
EURUSD has pulled back from the 2026 high of 1.1915 and is now trading near 1.1450 — below both EMA65 and EMA200 — with the active scenario shifting from bullish to bearish. The ECB raised rates to 2.40%, but the Fed holds at 3.75%, and US inflation (3.5%) continues to outpace the eurozone (2.8%). A confirmed break below 1.1280 opens the next downward wave toward 1.1080. We break down the key levels, three trading scenarios with entry triggers, and what Deutsche Bank, Morgan Stanley and UBS are forecasting for EURUSD in 2026.
 Gold (XAUUSD) forecast 2026: predictions based on fundamental and technical analysis
Gold has corrected over 25% from its all-time high of 5,597 USD and is now trading near 4,100 USD — testing a critical support zone. Is this the bottom, or will the downtrend continue? We break down the key levels (support 3,920 USD, breakout trigger 4,500 USD), three trading scenarios with entry levels, and what J.P. Morgan, Goldman Sachs and Deutsche Bank are forecasting for gold in 2026.
Forecasts presented in this section only reflect the author’s private opinion and should not be considered as guidance for trading. RoboForex bears no responsibility for trading results based on trading recommendations described in these analytical reviews.