
US 500 on the threshold of September: high oil prices, risks, and rates
The US 500 declined but avoided a sharp drop. September is historically considered a challenging month for markets.
US 500 forecast: key takeaways
- The US 500 index edged lower but has not yet come under broad pressure
- September is historically considered a challenging month for capital markets
- US 500 forecast for 1 September 2026: 7,674 or 7,721.5
US 500 fundamental analysis
The US 500 index fell to 7,694 points on Tuesday, marking a weak start to the week.
Sentiment is being weighed down by another rise in oil prices amid escalating conflict in the Middle East. Higher energy prices have fuelled inflation concerns and increased expectations of a Federal Reserve rate hike in September, pushing up US Treasury yields.
On Monday, the Dow Jones fell by 0.7%, the S&P 500 by 0.33%, and the Nasdaq Composite by 0.12%. Nine of the 11 S&P 500 sectors ended the day lower, with the largest losses recorded in communication services, utilities, and industrials.
The market is entering September, historically a challenging month for stocks, after moderate gains in August. This week, investors will monitor fresh manufacturing and services business activity indices, while the main event will be Friday's US labour market report for August.
The US 500 outlook is moderate.
US 500 technical analysis
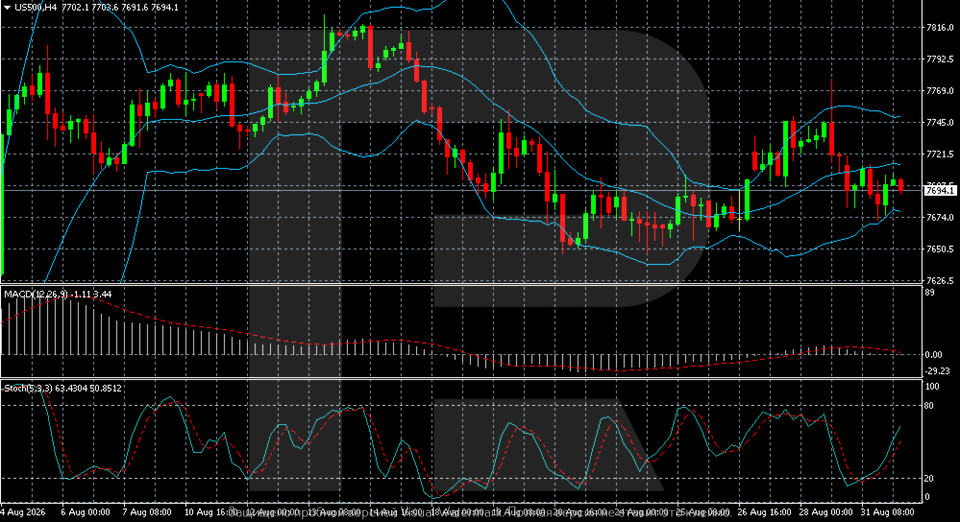
On the H4 chart, the US 500 remains in a sideways structure after correcting from the 7,816 area. The index is trading around 7,694 and has so far failed to return above the middle Bollinger Band. After falling to 7,674, buyers attempted to regain ground, but for sustained upward momentum to return, the price needs to break above the nearest resistance zone at 7,721–7,745.
The nearest support level is located at 7,674, with the next ones at 7,650.5 and 7,626.5. The resistance level lies at 7,721.5, followed by 7,745 and 7,769. A sustained move above 7,721.5 would improve the short-term picture and create conditions for further recovery, while a breakout below 7,674 would increase selling pressure and return the index to the lower part of the current range.
The MACD is near the neutral level and is not yet showing any clear directional momentum. The Stochastic Oscillator has turned upwards from the lower part of the range and risen above 50, supporting the likelihood of a local recovery. The baseline scenario remains movement within the 7,674–7,721.5 range with a neutral-to-positive bias.
Main scenario (Buy Stop)
A sustained move above the 7,721.5 resistance level would confirm increased buying pressure and create conditions for a continued recovery in the US 500.
- Current price: 7,694.1
- Entry level: 7,722
- Take profit: 7,769
- Stop loss: 7,698
- Risk-to-reward ratio: approximately 1:2
The trade idea is valid until 8:00 AM (server time, UTC+3) on 4 September 2026.
Alternative scenario (Sell Stop)
A breakout below the 7,674 support level and a sustained move below it would confirm renewed downward momentum and create conditions for a decline in US 500.
- Entry level – 7,673
- Take profit: 7,650.5
- Stop loss: 7,685
- Risk-to-reward ratio: approximately 1:1.9
The trade idea is valid until 8:00 AM (server time, UTC+3) on 4 September 2026.
Summary
The US 500 has declined, but this does not invalidate the overall favourable scenario. The US 500 forecast for today, 1 September 2026, remains cautious and does not rule out continued range-bound trading.
Editors’ picks
 EURUSD forecast 2026–2027: technical analysis, price levels & predictions
EURUSD has recovered from the July lows and is trading near 1.1545 — back in bullish territory. The pair has reclaimed EMA65 on the daily, formed a bullish EMA crossover on H4, and the US-eurozone GDP gap has narrowed sharply (US 1.5% vs eurozone 1.0%). Goldman Sachs and Deutsche Bank both now target 1.2500 by year-end. A confirmed close above 1.1700 opens the path to 1.1805. We break down the key levels, three trading scenarios, and what the unprecedented 9-3 FOMC dissent vote means for EURUSD.
 Gold (XAUUSD) forecast 2026: technical analysis, price levels & predictions
Gold has reversed its downtrend and is trading near 4,360 USD, back above both EMA65 and EMA200. ETF flows turned positive in July with 3 billion USD of net inflows, and central banks bought 288.9 tonnes in Q2 — up 62% year-on-year. A breakout above 4,500 USD opens the path to 4,855 USD and the 5,597 USD all-time high. We break down the key levels, three trading scenarios with entry triggers, and what J.P. Morgan, Deutsche Bank and Goldman Sachs are forecasting for gold in 2026.
Forecasts presented in this section only reflect the author’s private opinion and should not be considered as guidance for trading. RoboForex bears no responsibility for trading results based on trading recommendations described in these analytical reviews.