
US 500: investors regain appetite for risk assets as equity fund inflows rise
The US 500 index has entered a sideways range, but the broader trend remains bullish. The price currently stands at 7,696.
US 500 forecast: key takeaways
- Weekly inflows into global equities reached their highest level since July 2026 at 44.1 billion USD after two weeks of outflows
- The yield on two-year US Treasury bonds reached 4.952%, its highest level since May 2024
- US 500 forecast for 29 September 2026: 7,950
US 500 fundamental analysis
The inflow of 44.1 billion USD into global equity funds in the week ending 25 September 2026 indicates a recovery in investor interest in risk assets after two weeks of outflows. The main drivers were sustained demand for technology stocks, optimism about the development of artificial intelligence, and lower oil prices. At the same time, on 28 September, the yield on two-year US Treasury bonds reached 4.952%, its highest level since May 2024. As a result, the US stock market is being influenced by two opposing factors: improving investor sentiment and rising government bond yields, which increase the attractiveness of debt instruments relative to stocks.
For the US 500 index, this combination of factors sets the stage for increased volatility. Significant capital inflows into equity funds could support demand for shares of the largest US corporations and limit the scale of a potential correction. At the same time, the rise in two-year bond yields indicates tighter financial conditions and changing expectations regarding the Federal Reserve's future monetary policy.
The US 500 outlook is positive.
US 500 technical analysis
On the D1 chart, the US 500 index maintains its upward momentum after completing a correction. The current technical picture points to the possibility of further growth and a new all-time high. If bullish momentum weakens, quotes may enter a short-term consolidation phase and form a sideways range. A breakout above the upper boundary and a renewed upward move are then expected.
The nearest support level is located at 7,505, while resistance has formed around 7,820. A consolidation above the resistance level would create conditions for further growth towards 7,950. If the 7,505 support level is broken, a downward move is likely, targeting 7,305.
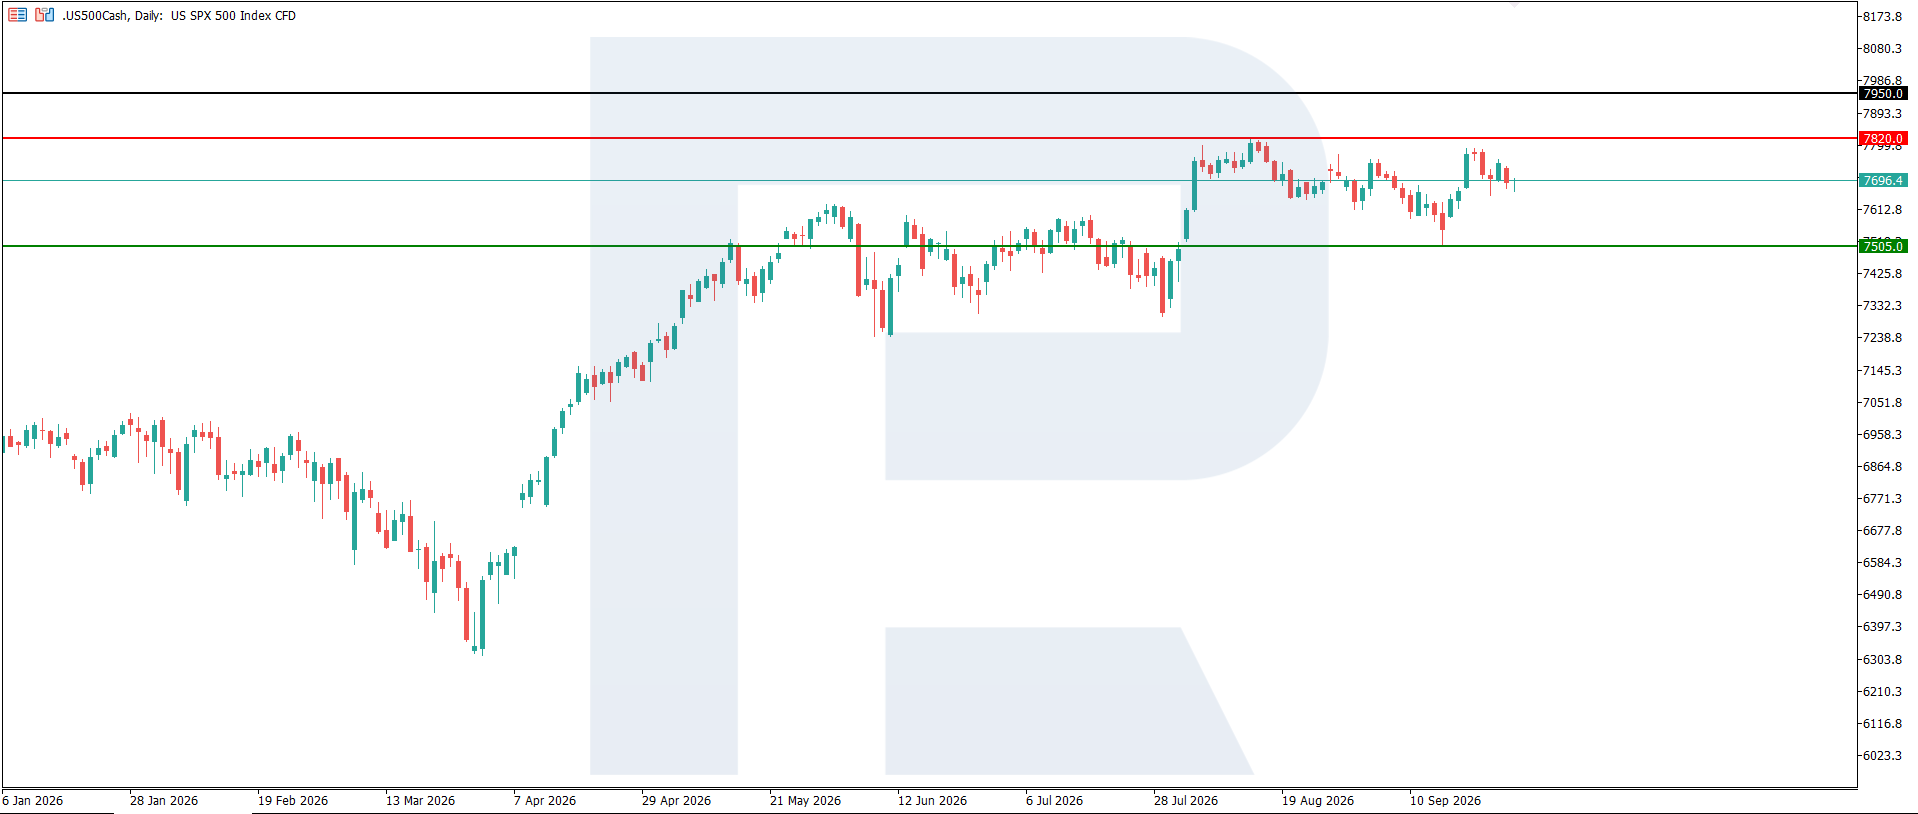
US 500 trading scenario for today
- Asset: US 500
- Timeframe: D1 (Intraday)
- Trend: bullish
- Key resistance levels: 7,820
- Key support levels: 7,505
Trading scenario (Buy Stop)
A breakout above the resistance level, with the price settling above 7,820, would confirm continued buying pressure and pave the way for further growth.
- Current price: 7,696
- Entry level: 7,825
- Take profit: 7,950
- Stop loss: 7,805
- Risk-to-reward ratio: 1:3.5
The trade idea is valid until 8:00 AM on 6 October 2026 (server time, UTC+3).
Risk factors
The main risk factors for the US 500 remain a further rise in US Treasury yields, persistently high Federal Reserve interest rates, and a possible increase in inflationary pressure. Higher borrowing costs could negatively affect corporate earnings and investment activity, particularly in the technology sector. Additional uncertainty comes from a possible slowdown in the US economy and a deterioration in labour market conditions.
Summary
In the near term, the main factor for the US 500 will be the balance between the resilience of corporate earnings and further changes in interest rates. Continued significant investment inflows could support the index, while rising US Treasury yields increase the likelihood of a correction, particularly among companies with high market valuations. The US 500 forecast for today, 29 September 2026, does not rule out a further rise towards 7,950.
Editors’ picks
 EURUSD forecast 2026–2027: technical analysis, price levels & predictions
The EURUSD outlook for 2026 and 2027: key levels on the daily chart, three trading scenarios and the policy gap between the Fed and the ECB that drives the pair.
 Gold (XAUUSD) forecast 2026: technical analysis, price levels & predictions
Where gold could trade in 2026: key levels, three trading scenarios with entry triggers and the forecasts from J.P. Morgan, Deutsche Bank and Goldman Sachs.
Forecasts presented in this section only reflect the author’s private opinion and should not be considered as guidance for trading. RoboForex bears no responsibility for trading results based on trading recommendations described in these analytical reviews.