
US 500: investors regain appetite for risk assets as equity fund inflows rise
The US 500 index is testing a resistance level and attempting a breakout amid an uptrend. The price currently stands at 7,793.
US 500 forecast: key takeaways
- US unemployment came in at 4.2%
- The yield on 30-year US Treasury bonds reached 5.70%, its highest level since 2002
- Nonfarm Payrolls increased by only 29 thousand, below expectations of around 89–90 thousand
- US 500 forecast for 6 October 2026: 7,950
US 500 fundamental analysis
The US labour market data for September is broadly moderately positive for the US 500 index in the short term, although its impact cannot be assessed unequivocally. Nonfarm Payrolls increased by only 29 thousand, falling short of expectations of around 89–90 thousand, while the previous month's figure was revised down from 162 thousand to 133 thousand. At the same time, the unemployment rate rose from 4.1% to 4.2%, exceeding the forecast. A further sign of labour market cooling was the slowdown in average hourly earnings growth to 0.1% month-on-month and 3.0% year-on-year. The report therefore points not merely to a one-off deviation from expectations, but to a more noticeable weakening in labour demand.
For the US 500, the main positive factor is the shift in expectations regarding Federal Reserve monetary policy. In September, the Federal Reserve raised the target range by 25 basis points to 3.75–4.00%, citing persistently elevated inflationary pressure. Prior to the release of weak employment data, the market had been pricing in another rate hike as early as October; however, following the report, the probability of such a move fell sharply and is now estimated at less than 20%. The next Federal Reserve meeting will take place on 27–28 October.
The US 500 outlook is positive.
US 500 technical analysis
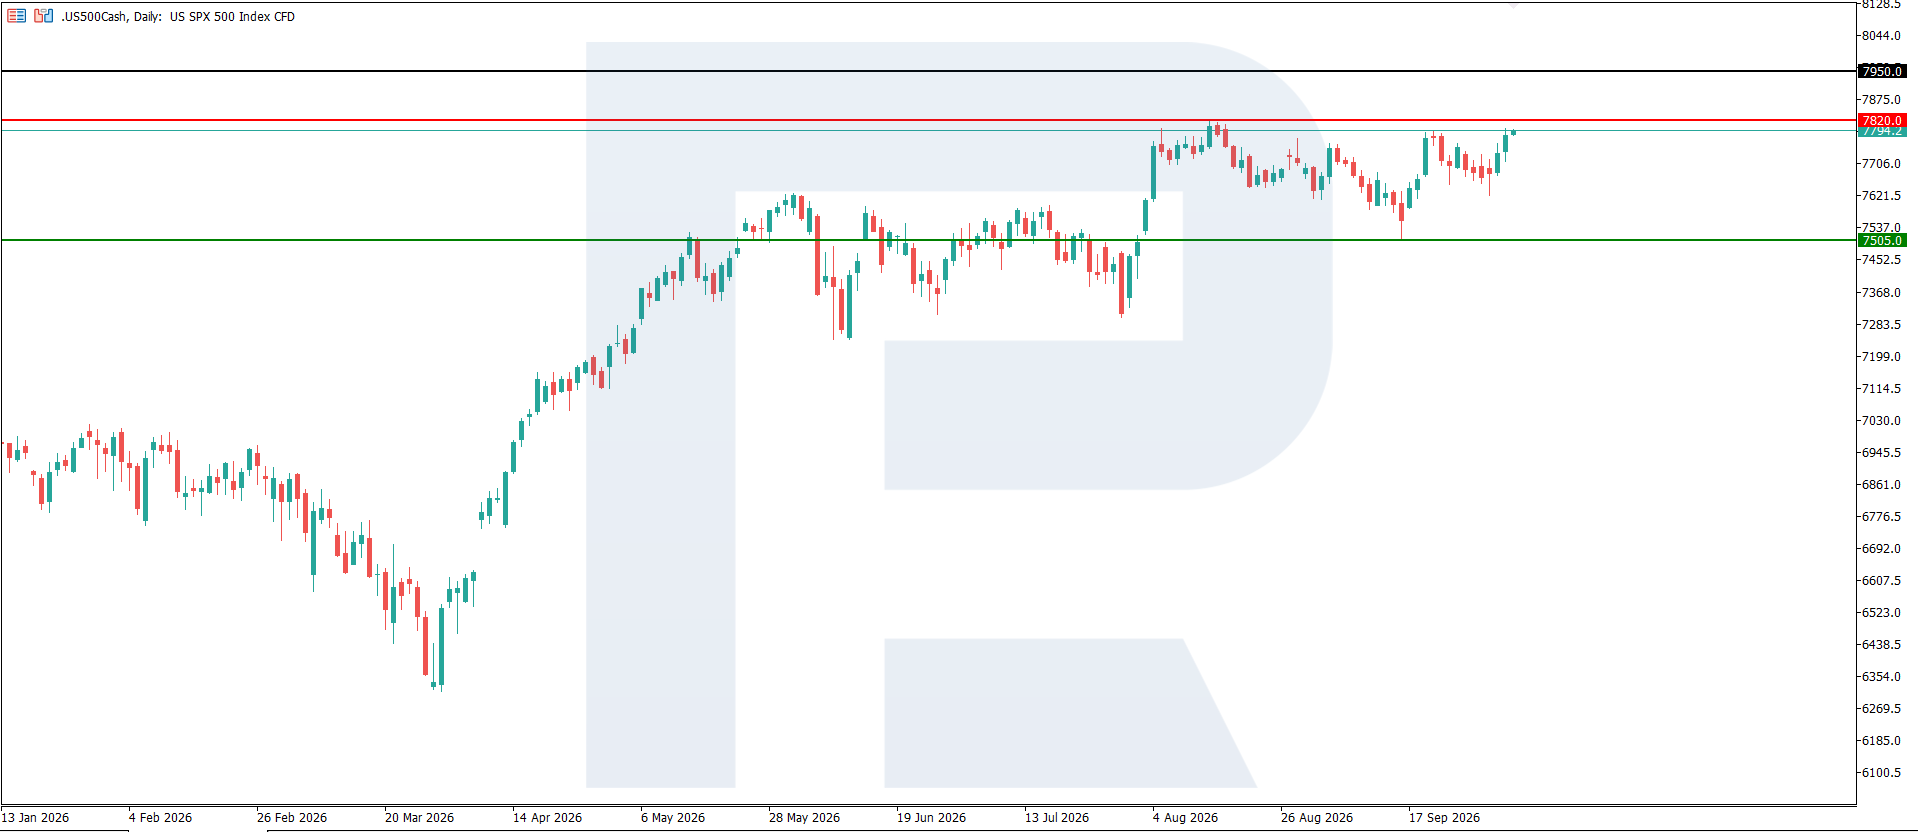
On the D1 chart, the US 500 index continues to show upward momentum after completing a corrective move. The current technical outlook supports the potential for further gains and a possible new all-time high. If buying activity temporarily weakens, quotes may enter a short-term consolidation phase and form a sideways range. Subsequently, a breakout above its upper boundary and a continuation of the upward move are likely.
The nearest support level has formed at 7,505, while key resistance is located at 7,820. A firm consolidation above the 7,820 level would increase the likelihood of further growth, with the nearest target at 7,950. An alternative scenario suggests a breakout below the 7,505 support level, which could lead to a downward correction and a decline towards 7,305.
US 500 trading scenario for today
- Asset: US 500
- Timeframe: D1 (Intraday)
- Trend: bullish
- Key resistance levels: 7,820
- Key support levels: 7,505
Trading scenario (Buy Stop)
A breakout above the resistance level and consolidation above 7,820 would confirm continued buying pressure and open the door for further growth.
- Current price: 7,793
- Entry level: 7,825
- Take profit: 7,950
- Stop loss: 7,805
- Risk-to-reward ratio: 1:3.5
The trade idea is valid until 8:00 AM on 12 October 2026 (server time, UTC+3).
Risk factors
The key risks for the US 500 remain a further deterioration in the labour market, persistently high inflation, and changes in expectations regarding Federal Reserve policy. Stronger signs of an economic slowdown or rising bond yields could put pressure on equities, particularly the technology sector. Additional negative factors include weak corporate earnings, declining consumer demand, and geopolitical tensions.
Summary
For the US 500, the current data creates a moderately positive short-term backdrop. The best-case scenario for the stock market is one in which the labour market cools enough for the Federal Reserve to refrain from another rate hike, yet not so sharply as to trigger concerns over a recession and a steep decline in corporate earnings. If subsequent data shows stabilisation in employment and a further decline in inflation, the US 500 could receive support from lower bond yields. The US 500 forecast for today, 6 October 2026, suggests further growth towards 7,950.
Editors’ picks
 EURUSD forecast 2026–2027: technical analysis, price levels & predictions
The EURUSD outlook for 2026 and 2027: key levels on the daily chart, three trading scenarios and the policy gap between the Fed and the ECB that drives the pair.
 Gold (XAUUSD) forecast 2026: technical analysis, price levels & predictions
Where gold could trade in 2026: key levels, three trading scenarios with entry triggers and the forecasts from J.P. Morgan, Deutsche Bank and Goldman Sachs.
Forecasts presented in this section only reflect the author’s private opinion and should not be considered as guidance for trading. RoboForex bears no responsibility for trading results based on trading recommendations described in these analytical reviews.