US Tech forecast: the index has entered a downward trend
After a sharp decline, the US Tech index formed a support level. The US Tech forecast for next week is negative.
US Tech forecast: key takeaways
- Recent data: U.S. Services PMI for November came in at 52.9
- Market impact: the current data has a positive effect on the technology sector
US Tech fundamental analysis
The U.S. Services PMI printed at 52.9, below expectations of 54.0 and down from 54.1 previously. Although the index remains above 50, indicating continued growth in the services sector, the pace of expansion has clearly slowed and turned out weaker than the market expected. This release matters for US equities because services represent the largest part of the US economy, including consumption, finance, logistics, IT services, healthcare, and other segments.
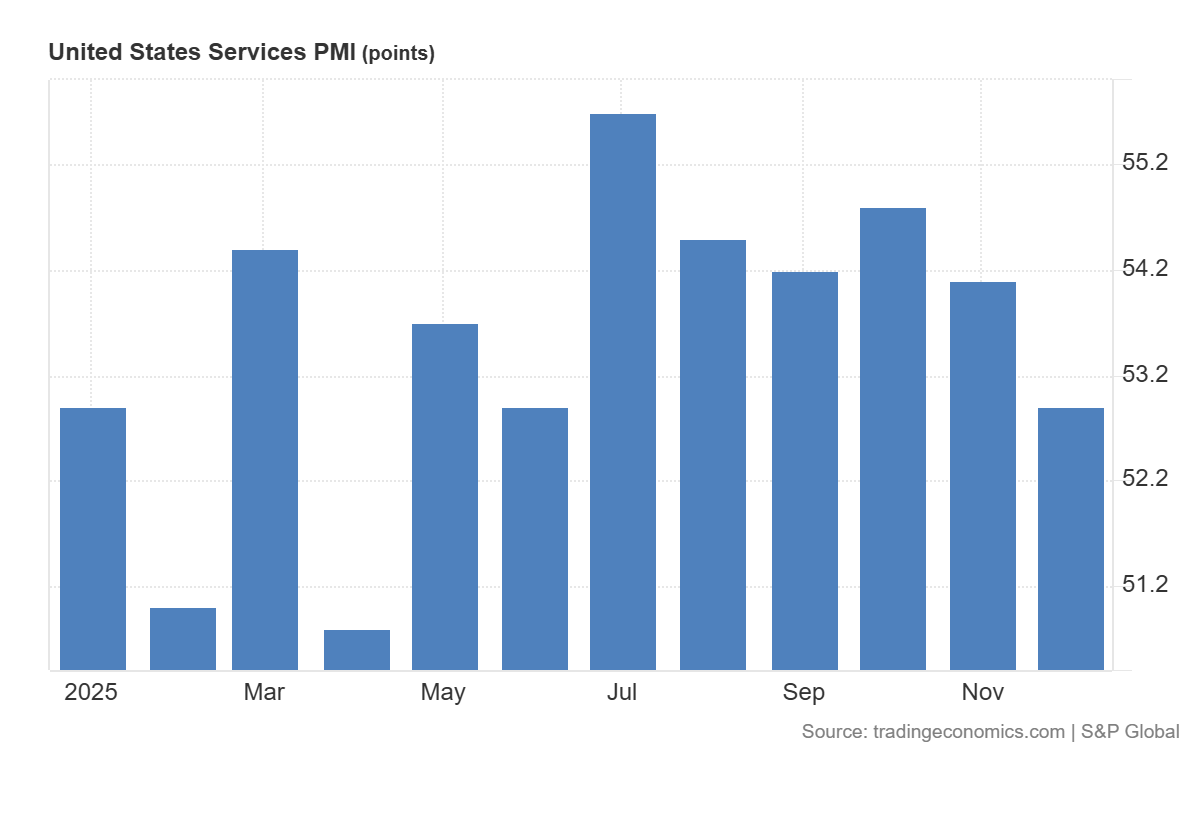
Because the PMI remains above 50, the data points to a slowdown rather than a contraction. As a result, the typical market reaction is moderate. The indicator limits optimism about economic growth but at the same time increases the likelihood of softer financial conditions. Slower activity reduces the risk of economic overheating and can ease pressure on interest rates. This factor is generally positive, as equities tend to look more attractive when rate expectations decline.
US Tech technical analysis
For the US Tech index, the impact of this indicator often appears stronger than for the broader market, as technology companies react more sensitively to interest rate expectations. If weaker PMI data leads market participants to anticipate lower policy rates and bond yields, this usually supports the technology sector, as future earnings receive higher valuations.
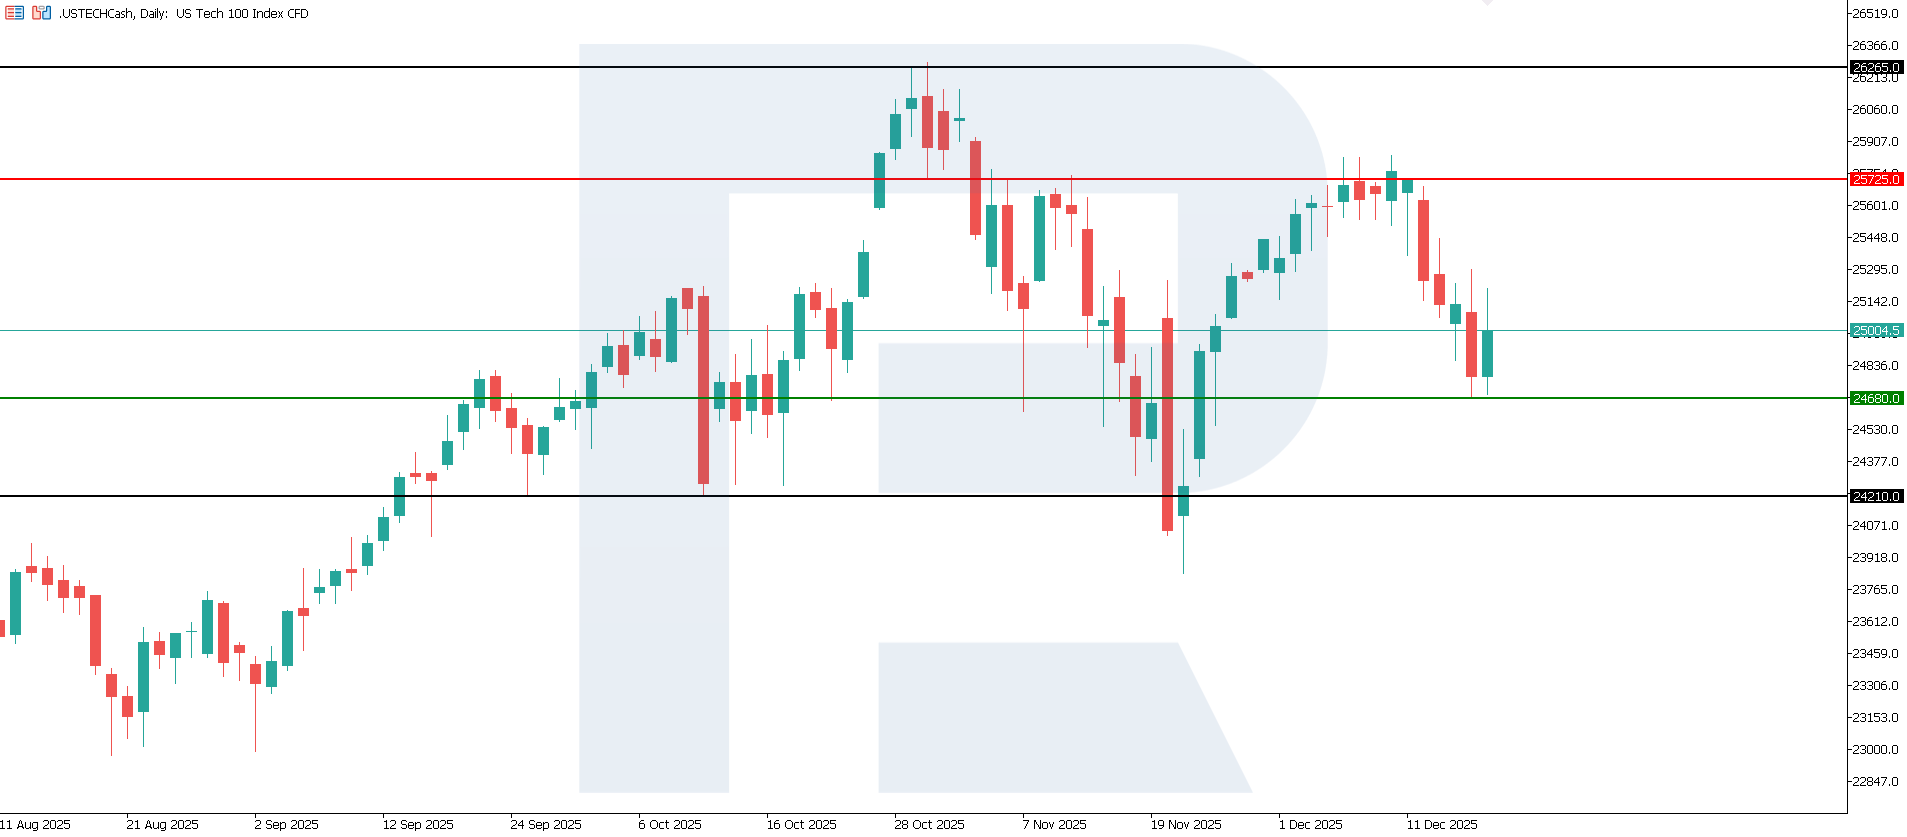
The US Tech index has entered a downward trend. The nearest resistance formed at 25,725.0, while the support level shifted to 24,680.0. The downside target may lie near 24,210.0.
Forecast scenarios for the US Tech index price:
- Bearish scenario: if prices break below the support at 24,680.0, the index may fall to 24,210.0
- Bullish scenario: if prices break above the resistance at 25,725.0, the index may rise to 26,265.0
Summary
The current data provides some support for the US Tech index. If the slowdown in services continues and receives confirmation from other indicators, companies may become more cautious in spending on digital services, advertising, and IT projects. In that case, part of the technology sector could face revenue growth risks. At present, the data does not signal a sharp deterioration, so the baseline effect for US Tech remains moderately positive. The nearest downside target may stand at 24,210.0.
Editors’ picks
 EURUSD 2026-2027 forecast: key market trends and future predictions
This article provides the EURUSD forecast for 2026 and 2027 and highlights the main factors determining the direction of the pair’s movements. We will apply technical analysis, take into account the opinions of leading experts, large banks, and financial institutions, and study AI-based forecasts. This comprehensive insight into EURUSD predictions should help investors and traders make informed decisions.
 Gold (XAUUSD) forecast 2026 and beyond: expert insights, price predictions, and analysis
Dive deep into the Gold (XAUUSD) price outlook for 2026 and beyond, combining technical analysis, expert forecasts, and key macroeconomic factors. It explains the drivers behind gold’s recent surge, explores potential scenarios including a move toward 4,500 to 5,000 USD per ounce, and highlights why the metal remains a strong hedge during global uncertainty.
Forecasts presented in this section only reflect the author’s private opinion and should not be considered as guidance for trading. RoboForex bears no responsibility for trading results based on trading recommendations described in these analytical reviews.