US Tech forecast: the index enters a sideways trend
The US Tech index failed to renew its all-time high and has moved into a sideways range. The US Tech forecast for next week is positive.
US Tech forecast: key takeaways
- Recent data: the US core PCE price index increased to 2.8% year-on-year
- Market impact: the data has a moderately positive effect on the technology sector
US Tech fundamental analysis
The core PCE price index came in at 2.8% year-on-year, fully in line with market expectations, but accelerated compared with the previous reading of 2.7%. Since the PCE is the Federal Reserve’s key gauge of inflation pressure, the fact that inflation has picked up relative to the prior month is perceived as a moderately negative signal for equities. It increases the likelihood of a more cautious approach to monetary easing and supports the scenario of interest rates remaining relatively high for longer.
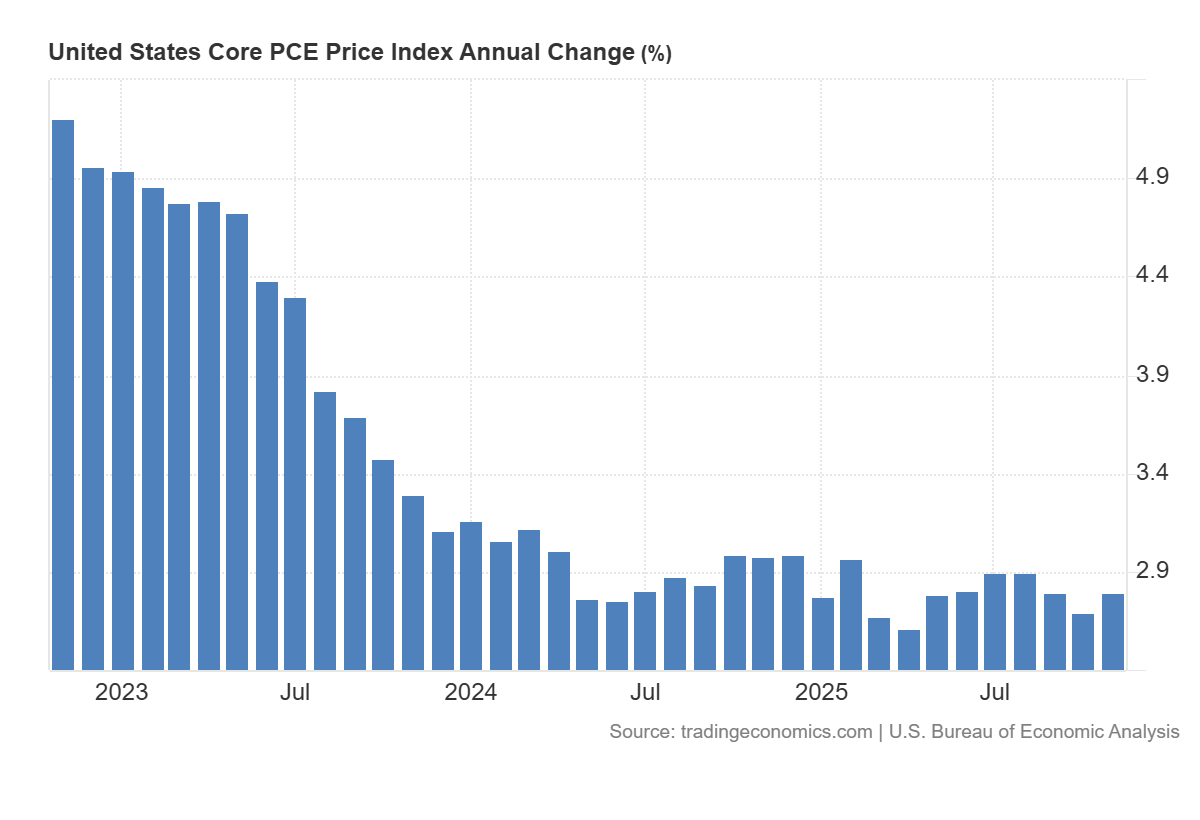
For the US equity market as a whole, the release can be described as neutral in terms of the headline figure, but slightly negative in trend direction, as an acceleration in core inflation, even by 0.1 percentage point, reduces investor confidence in a rapid decline in borrowing costs. This may limit the expansion of valuation multiples and increase market sensitivity to subsequent data confirming inflation persistence.
US Tech technical analysis
For the US Tech index, the impact is typically more pronounced than for the broader market, as the technology sector is more sensitive to interest rates and yields. If the acceleration in the core PCE is accompanied by rising Treasury yields, this would put pressure on technology stocks and could lead to weaker relative performance of the US Tech compared to other sectors. If yields remain stable due to the data matching expectations, the effect on US Tech should be limited.
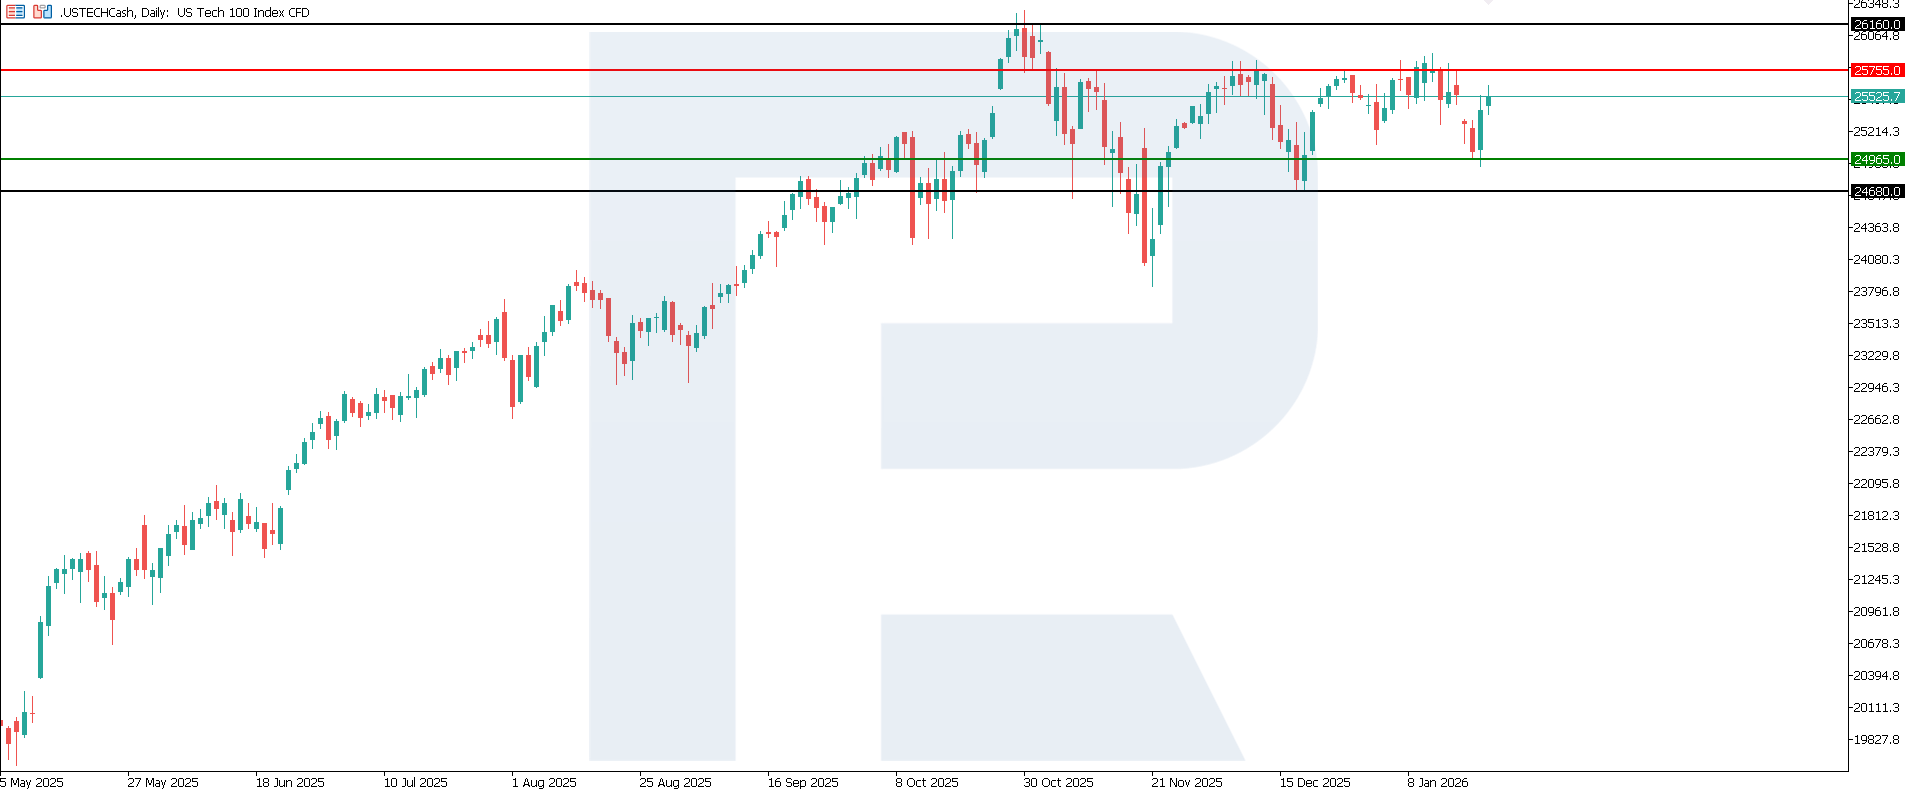
The US Tech index entered a sideways trend, with the nearest resistance level formed at 25,755.0 and the support level shifting to 24,965.0. However, prices are moving higher towards resistance, with a high probability of a breakout. The upside target could be 26,160.0.
The US Tech price forecast outlines the following scenarios:
- Pessimistic US Tech scenario: a breakout below the 24,965.0 support level could push the index to 24,680.0
- Optimistic US Tech scenario: a breakout above the 25,755.0 resistance level could drive the index to 26,160.0
Summary
The core PCE release in line with expectations reduces the likelihood of a sharp market reaction, but the acceleration from 2.7% to 2.8% creates a moderately negative backdrop for US equities due to more cautious expectations regarding Fed policy. Sensitivity is higher for the US Tech index, so if bond yields rise, the technology sector is likely to face greater pressure than the broader market. The nearest upside target could be 26,160.0.
Editors’ picks
 EURUSD 2026-2027 forecast: key market trends and future predictions
This article provides the EURUSD forecast for 2026 and 2027 and highlights the main factors determining the direction of the pair’s movements. We will apply technical analysis, take into account the opinions of leading experts, large banks, and financial institutions, and study AI-based forecasts. This comprehensive insight into EURUSD predictions should help investors and traders make informed decisions.
 Gold (XAUUSD) forecast 2026 and beyond: expert insights, price predictions, and analysis
Dive deep into the Gold (XAUUSD) price outlook for 2026 and beyond, combining technical analysis, expert forecasts, and key macroeconomic factors. It explains the drivers behind gold’s recent surge, explores potential scenarios including a move toward 4,500 to 5,000 USD per ounce, and highlights why the metal remains a strong hedge during global uncertainty.
Forecasts presented in this section only reflect the author’s private opinion and should not be considered as guidance for trading. RoboForex bears no responsibility for trading results based on trading recommendations described in these analytical reviews.