US Tech forecast: the index enters a downtrend
The US Tech index has lost more than 6.5% from its all-time high. The US Tech forecast for next week is negative.
US Tech forecast: key takeaways
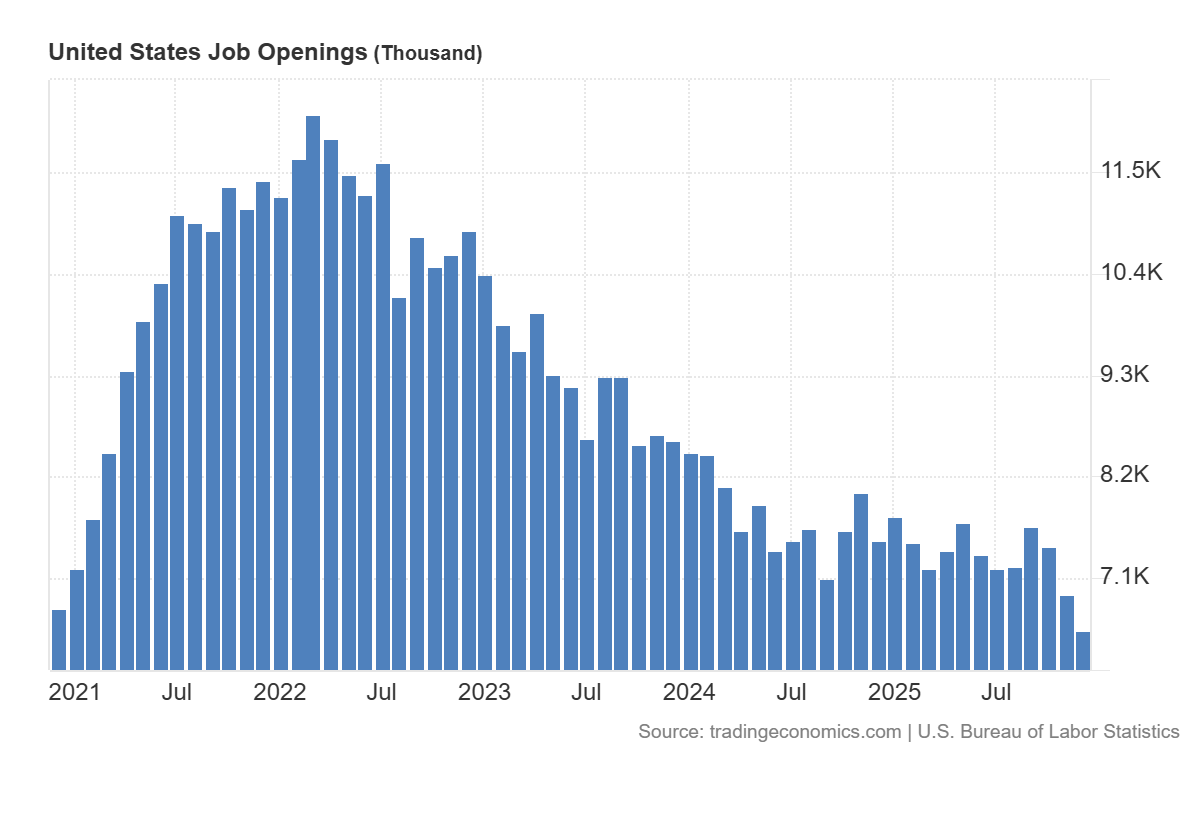
- Recent data: US JOLTS job openings came in at 6,542 million in December 2025
- Market impact: the current data has a moderately positive impact on the technology sector
US Tech fundamental analysis
The release of US JOLTS job openings at 6.542 million, below a forecast of 7.200 million and the previous reading of 6.928 million, indicates that demand for labour in the US declined more sharply than the market expected. For the financial system, this is a significant signal, as job openings reflect companies’ intentions to expand activity and also indirectly affect wage dynamics and inflation. When the number of open positions decreases, the market typically concludes that pressure on wage growth is easing and, consequently, that the likelihood of further monetary policy tightening is reduced.
For the US Tech index, the current data is more often perceived as moderately favourable in the short term. The logic is as follows: if inflationary pressure from the labour market eases, the likelihood of high interest rates persisting for an extended period declines. This supports valuations of technology companies, as their value largely depends on expected future earnings. With softer rate expectations, the current valuation of those earnings increases. However, investors remain concerned about excessive investment in AI infrastructure and rising corporate debt.
US Tech technical analysis
At the same time, a second, equally important aspect must be taken into account. A decline in job openings may reflect not only a healthy normalisation, but also an early signal of slowing business activity. If subsequent macroeconomic reports confirm a more pronounced cooling of the economy, this could worsen expectations for corporate revenues, including tech companies. In this case, part of the positive effect from potential rate cuts would be offset by concerns about the pace of corporate earnings growth.
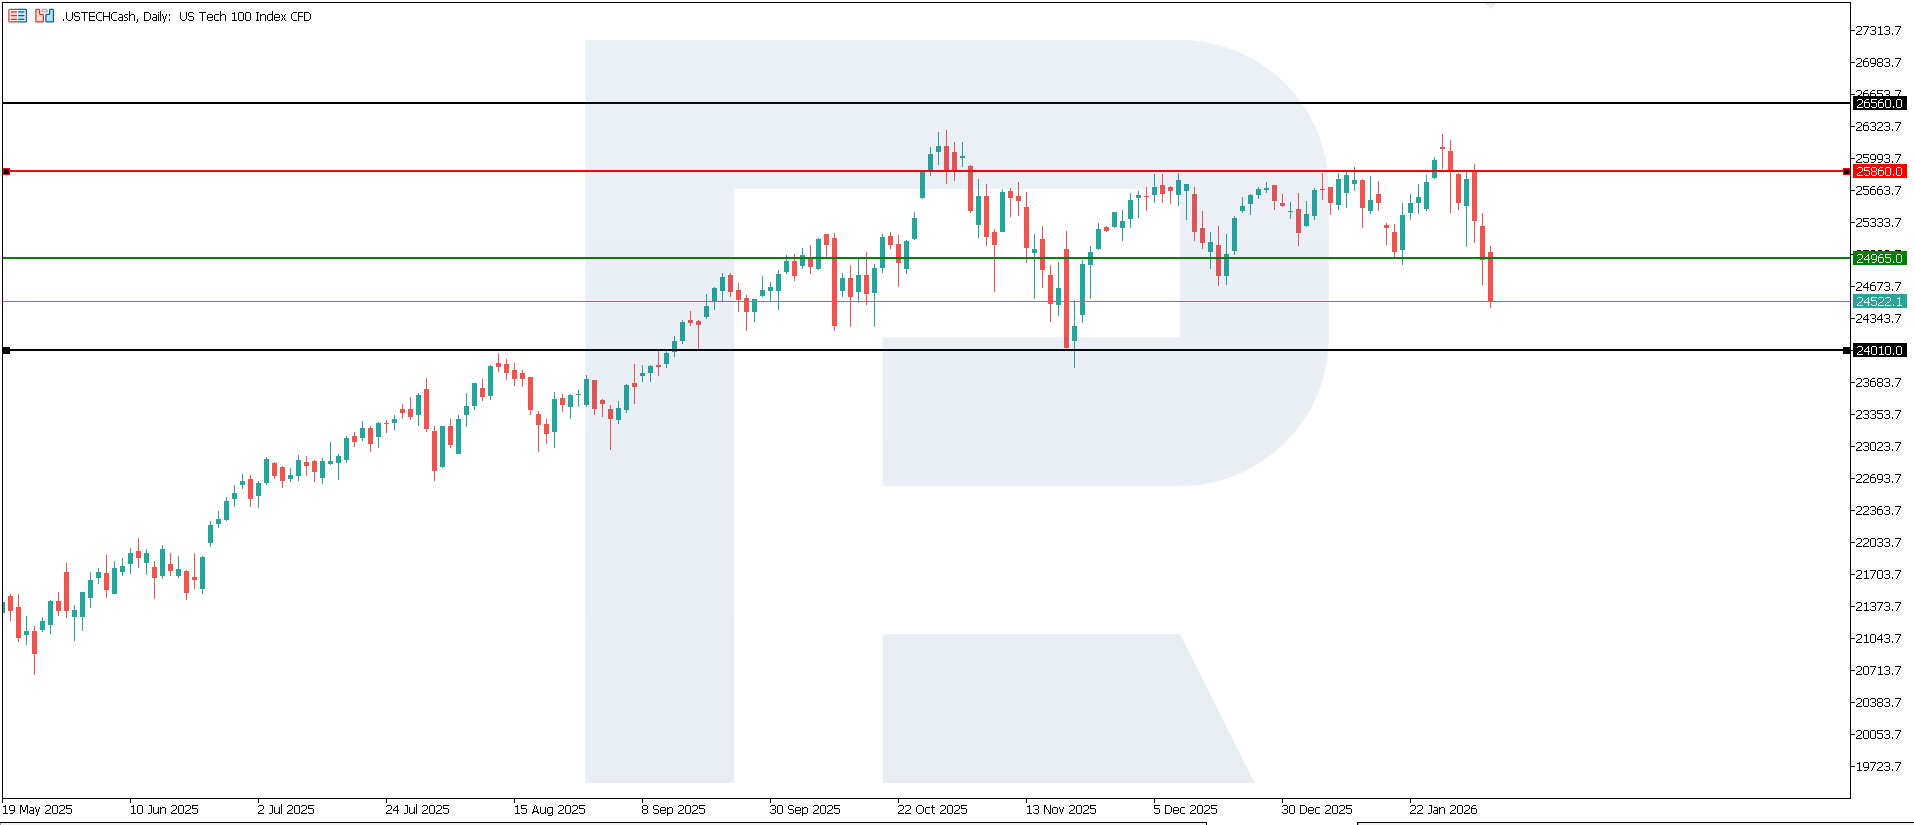
The US Tech index entered a downtrend. The nearest resistance formed at 25,860.0, while the 24,965.0 support level was broken. The correction has transitioned to a downtrend, with the decline exceeding 6.5%. The downside target may be the 24,010.0 level.
The US Tech price forecast outlines the following scenarios:
- Pessimistic US Tech scenario: if the price consolidates below the previously breached support level at 24,965.0, the index could fall to 24,010.0
- Optimistic US Tech scenario: a breakout above the 25,860.0 resistance level could boost the index to 26,560.0
Summary
Weaker JOLTS data will more likely support the US Tech and the broader US equity market in the short term through monetary policy expectations. However, the sustainability of this effect depends on whether the economic slowdown remains moderate. If subsequent data confirms a controlled cooling without a sharp decline in consumption and corporate earnings, the technology sector may retain a relative advantage. The nearest downside target may be the 24,010.0 level.
Editors’ picks
 EURUSD 2026-2027 forecast: key market trends and future predictions
This article provides the EURUSD forecast for 2026 and 2027 and highlights the main factors determining the direction of the pair’s movements. We will apply technical analysis, take into account the opinions of leading experts, large banks, and financial institutions, and study AI-based forecasts. This comprehensive insight into EURUSD predictions should help investors and traders make informed decisions.
 Gold (XAUUSD) forecast 2026 and beyond: expert insights, price predictions, and analysis
Dive deep into the Gold (XAUUSD) price outlook for 2026 and beyond, combining technical analysis, expert forecasts, and key macroeconomic factors. It explains the drivers behind gold’s recent surge, explores potential scenarios including a move toward 4,500 to 5,000 USD per ounce, and highlights why the metal remains a strong hedge during global uncertainty.
Forecasts presented in this section only reflect the author’s private opinion and should not be considered as guidance for trading. RoboForex bears no responsibility for trading results based on trading recommendations described in these analytical reviews.