US Tech forecast: the index has failed to recover after the sell-off
The US Tech index is declining again and testing the support level. The US Tech forecast for next week is negative.
US Tech forecast: key takeaways
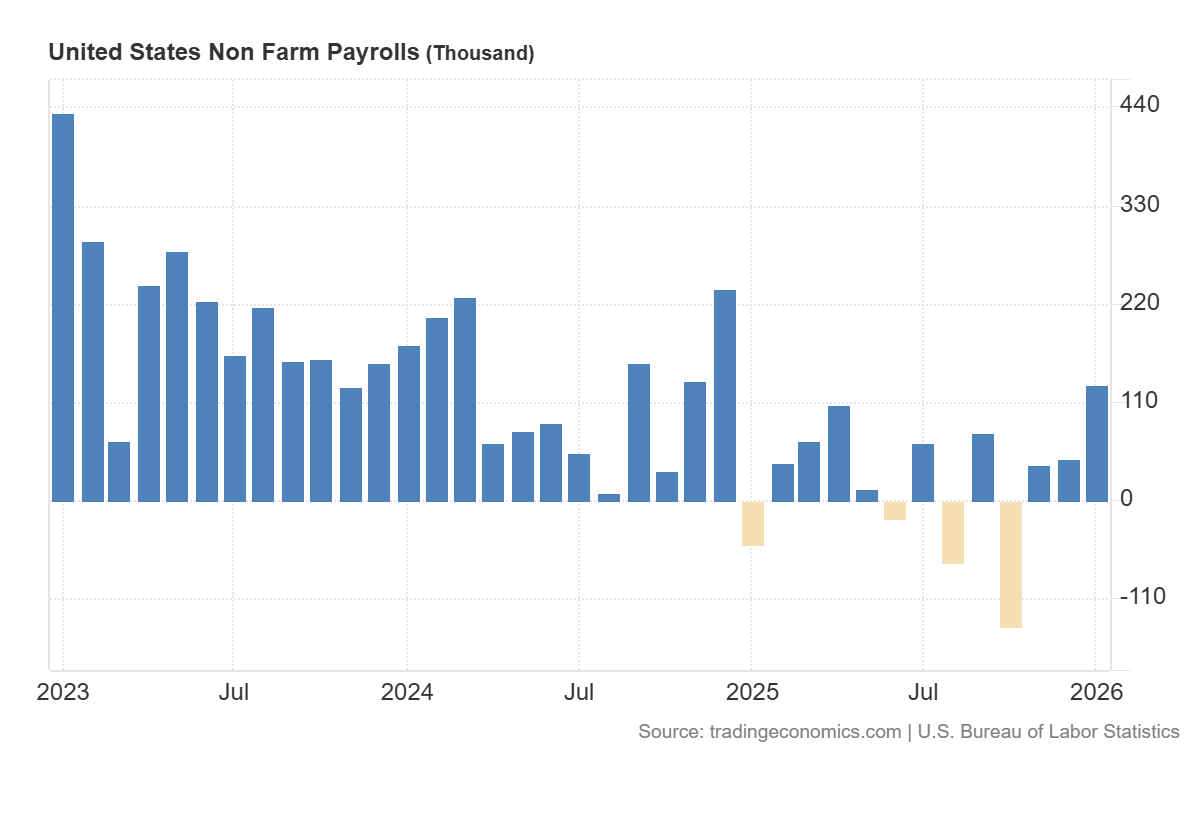
- Recent data: US Nonfarm Payrolls for January totalled 130 thousand, coming in above expectations of 66 thousand
- Market impact: the effect on the technology sector is mixed
US Tech fundamental analysis
The published US labour market data provides an overall cautiously positive but ambiguous signal for the US Tech index. In January, the US economy added 130 thousand payrolls, above expectations of 66 thousand and the previous reading of 50 thousand, which was later revised down to 48 thousand. At the same time, the unemployment rate declined to 4.3% versus the forecast of 4.4% and the previous level of 4.4%. These figures indicate a more resilient labour market than consensus had anticipated and confirm that the economy continues to generate jobs despite the slowdown seen in previous months.
For the US Tech, on the one hand, improving employment and lower unemployment support expectations for consumer and corporate demand, which is favourable for the revenues of technology companies, particularly in digital services, cloud infrastructure, advertising, and software segments. On the other hand, a stronger labour market may reduce the likelihood of rapid monetary easing, which typically limits upside potential.
US Tech technical analysis
For the broader US equity market, this data is generally favourable as it reduces concerns about a sharp deterioration in macroeconomic conditions. At the same time, the figures are not strong enough to suggest an overheating scenario that would prompt markets to price in aggressive tightening of financial conditions.
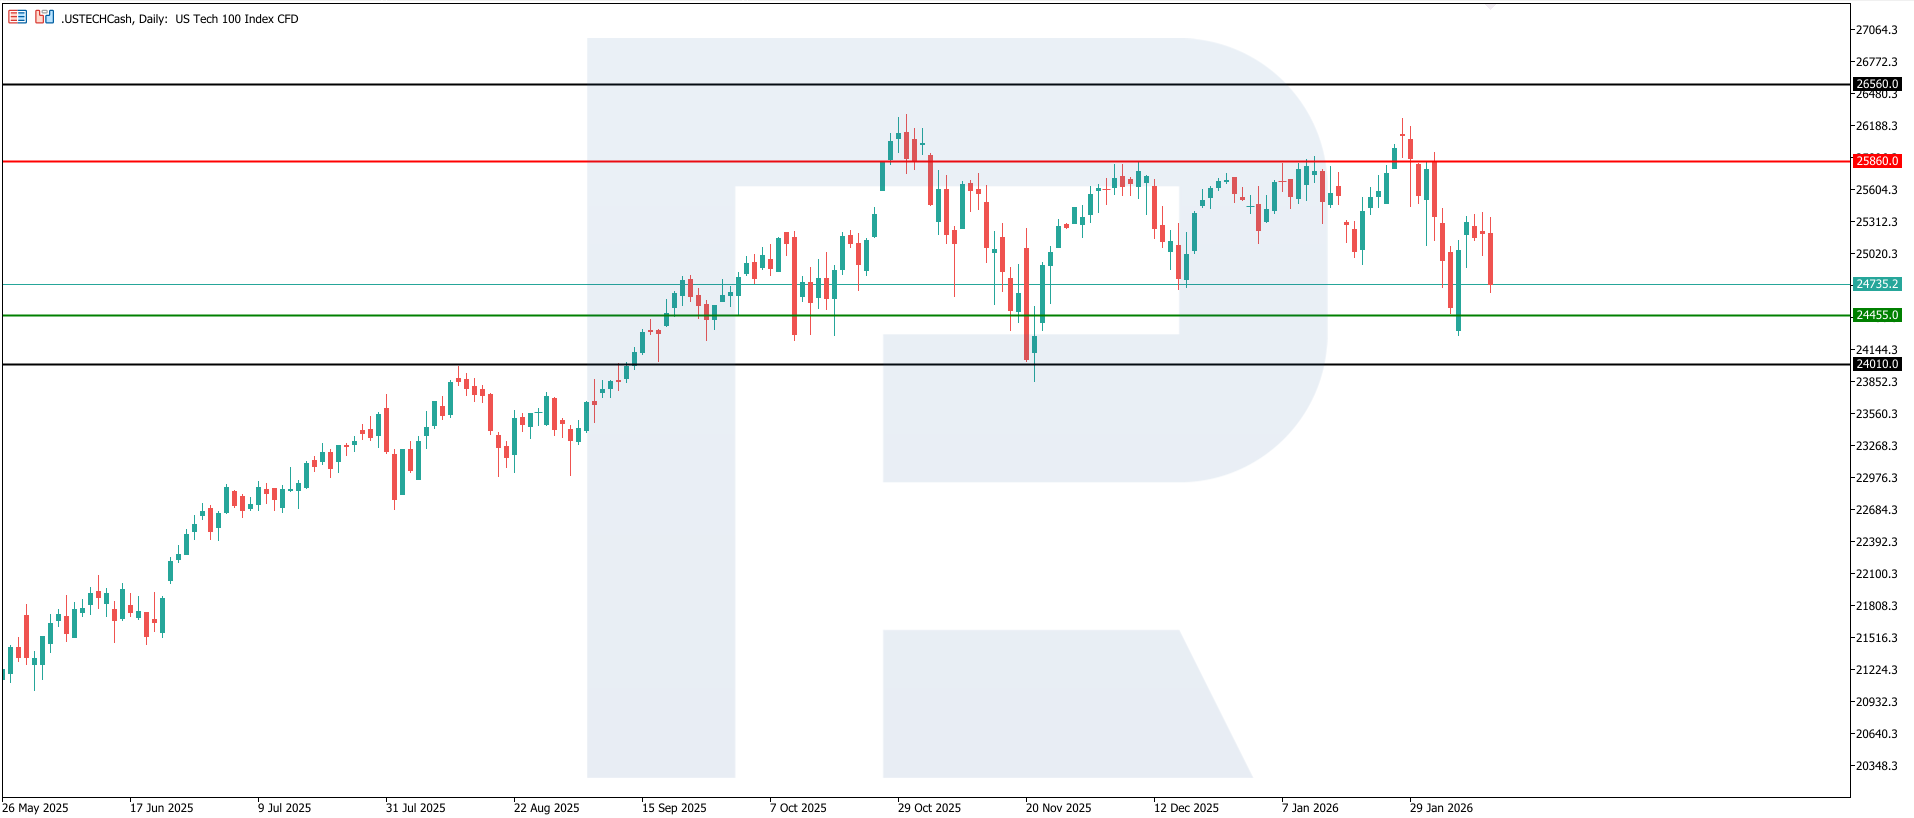
The US Tech index entered a downtrend, with the nearest resistance level at 25,860.0 and the support level at 24,455.0. The correction has evolved into a downtrend, with the decline exceeding 6.5%. The downside target may be the 24,010.0 level.
The US Tech price forecast outlines the following scenarios:
- Pessimistic US Tech scenario: a breakout below the 24,455.0 support level could push the index to 24,010.0
- Optimistic US Tech scenario: a breakout above the 25,860.0 resistance level could propel the index to 26,560.0
Summary
The combination of 130 thousand new jobs and a decline in unemployment to 4.3% supports the baseline scenario of a resilient US economy and is generally favourable for equities, including the US Tech. However, it does not eliminate the risk of heightened volatility driven by interest rate dynamics. In the near term, the decisive factor will be whether upcoming data on inflation, wages, and employment confirms a soft slowdown without overheating – this would create more constructive conditions for continued growth in risk assets. The nearest downside target could be 24,010.0.
Editors’ picks
 EURUSD 2026-2027 forecast: key market trends and future predictions
This article provides the EURUSD forecast for 2026 and 2027 and highlights the main factors determining the direction of the pair’s movements. We will apply technical analysis, take into account the opinions of leading experts, large banks, and financial institutions, and study AI-based forecasts. This comprehensive insight into EURUSD predictions should help investors and traders make informed decisions.
 Gold (XAUUSD) forecast 2026 and beyond: expert insights, price predictions, and analysis
Dive deep into the Gold (XAUUSD) price outlook for 2026 and beyond, combining technical analysis, expert forecasts, and key macroeconomic factors. It explains the drivers behind gold’s recent surge, explores potential scenarios including a move toward 4,500 to 5,000 USD per ounce, and highlights why the metal remains a strong hedge during global uncertainty.
Forecasts presented in this section only reflect the author’s private opinion and should not be considered as guidance for trading. RoboForex bears no responsibility for trading results based on trading recommendations described in these analytical reviews.