US Tech forecast: the index is trading in a narrow range
The US Tech index is trading in a sideways channel with a prevailing downtrend. The US Tech forecast for next week is negative.
US Tech forecast: key takeaways
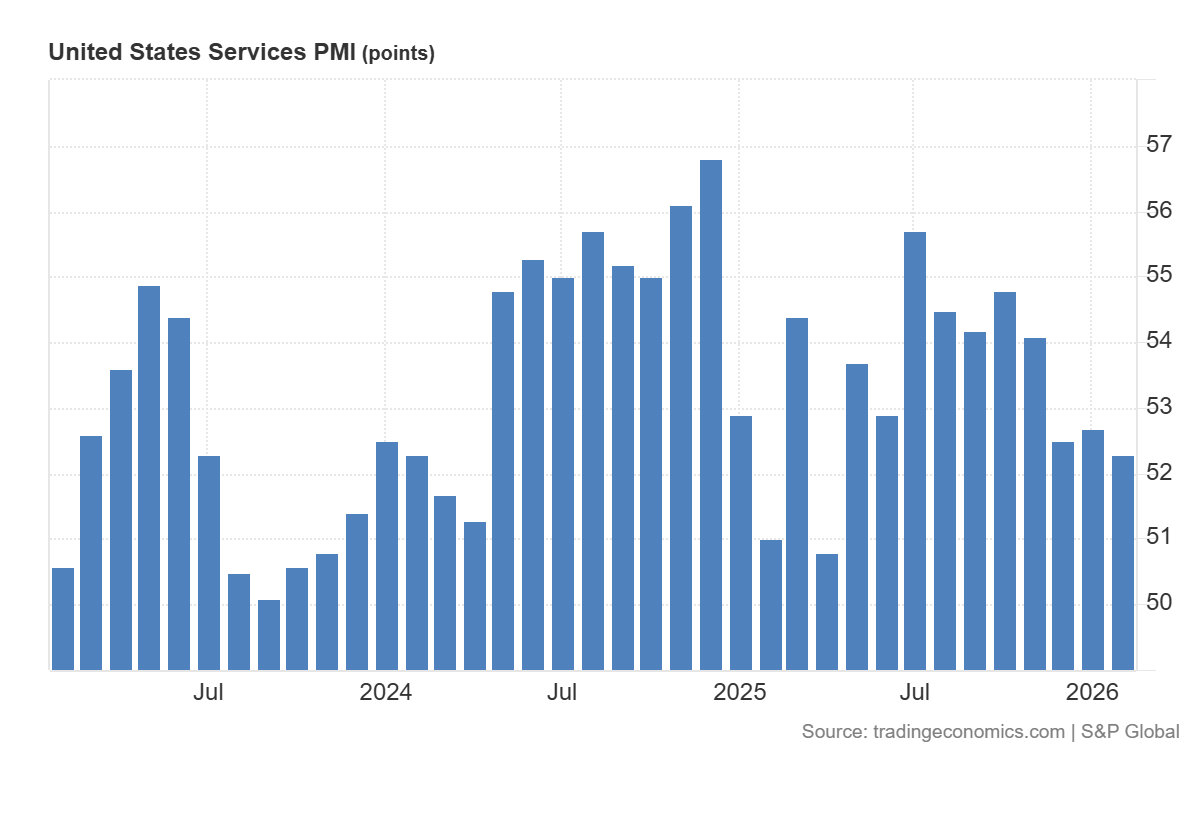
- Recent data: preliminary US services PMI came in at 52.3 in February
- Market impact: the data has a mixed effect on the technology sector
US Tech fundamental analysis
The release of the US services PMI at 52.3 points, compared to a forecast of 53.0 and a previous reading of 52.7, is perceived as a moderately restraining signal for market expectations. The indicator remains above 50.0, meaning the service sector continues to expand; however, the downside deviation from the forecast and the slight decline from the previous reading indicate a loss of growth momentum. Given that services make up the largest share of the US economy, such data increases the likelihood of a more cautious assessment of near-term demand dynamics and corporate revenues.
For the US Tech index, the impact is typically mixed and involves two key channels. On the one hand, weaker-than-expected services data may dampen expectations about economic growth and increase investor caution towards companies whose revenues are sensitive to business activity and corporate budgets. This can limit risk appetite in the technology segment, particularly for companies with less predictable earnings. On the other hand, slowing business activity often reduces pressure on interest rates and government bond yields, as the market begins to price in a more accommodative monetary policy path.
US Tech technical analysis
For the broader US stock market, the news also creates a more cautious backdrop, though without signs of a sharp deterioration. A reading above 50.0 still signals expansion, so the situation reflects a slowdown in momentum rather than a shift into contraction. In such conditions, the market often shows selective performance: demand shifts towards companies with stable cash flows and high earnings predictability, while stocks more sensitive to the business cycle and changes in economic activity receive less support.
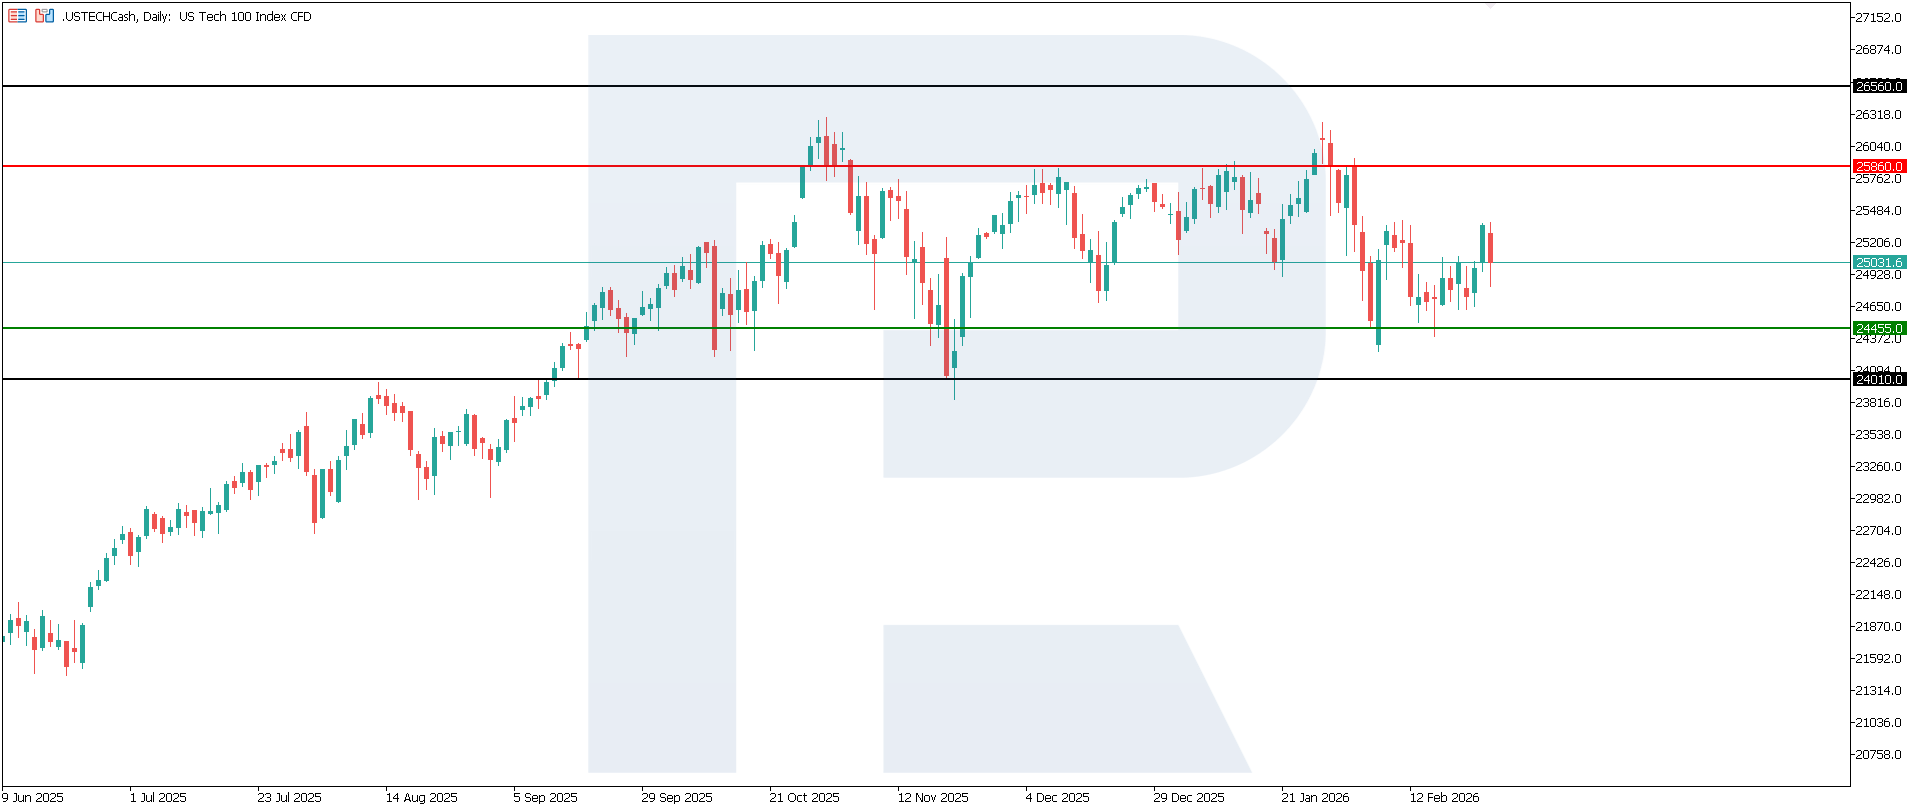
The US Tech index entered a phase of downward momentum, with the nearest resistance level at 25,860.0 and the key support level around 24,455.0. Quotes continue to trade sideways and are attempting to test the support level. If pressure persists, the next downside target could be 24,010.0.
The US Tech price forecast outlines the following scenarios:
- Pessimistic US Tech scenario: a breakout below the 24,455.0 support level could push the index to 24,010.0
- Optimistic US Tech scenario: a breakout above the 25,860.0 resistance level could propel the index to 26,560.0
Summary
The services PMI data moderately worsens the assessment of short-term economic momentum but does not confirm the scenario of a sharp slowdown. For the US Tech, this means continued sensitivity to the trajectory of interest rates and the quality of corporate earnings. If bond yields decline, the negative impact of weaker PMI data may be partially offset; however, if revenue and investment budget expectations deteriorate, demand for technology stocks is likely to remain selective. The nearest downside target could be 24,010.0.
Editors’ picks
 EURUSD 2026-2027 forecast: key market trends and future predictions
This article provides the EURUSD forecast for 2026 and 2027 and highlights the main factors determining the direction of the pair’s movements. We will apply technical analysis, take into account the opinions of leading experts, large banks, and financial institutions, and study AI-based forecasts. This comprehensive insight into EURUSD predictions should help investors and traders make informed decisions.
 Gold (XAUUSD) forecast 2026 and beyond: expert insights, price predictions, and analysis
Dive deep into the Gold (XAUUSD) price outlook for 2026 and beyond, combining technical analysis, expert forecasts, and key macroeconomic factors. It explains the drivers behind gold’s recent surge, explores potential scenarios including a move toward 4,500 to 5,000 USD per ounce, and highlights why the metal remains a strong hedge during global uncertainty.
Forecasts presented in this section only reflect the author’s private opinion and should not be considered as guidance for trading. RoboForex bears no responsibility for trading results based on trading recommendations described in these analytical reviews.