US Tech forecast: the index fails to form a directional trend
The US Tech index tested the support level but failed to extend its decline. The US Tech forecast for next week is negative.
US Tech forecast: key takeaways
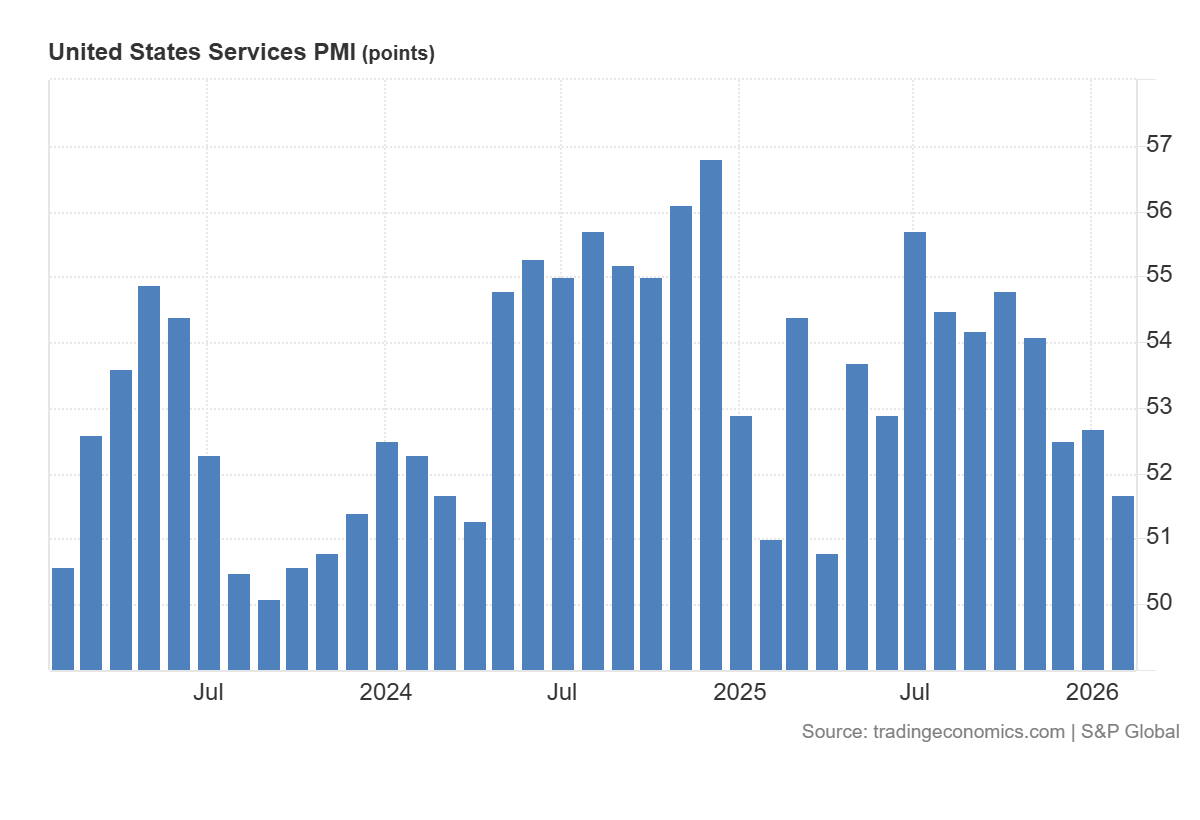
- Recent data: preliminary US services PMI came in at 51.7 in February
- Market impact: the data has a mixed impact on the technology sector
US Tech fundamental analysis
The US services PMI print at 51.7, below the forecast of 52.3 and the previous reading of 52.7, indicates that the US service sector is still expanding (above 50.0), but growth is slowing and came in weaker than expected. Since services make up a large share of the US economy, the market typically interprets this as a signal of more moderate demand in the coming months and potentially more restrained revenue growth for companies tied to domestic consumers and corporate spending.
For the US Tech index, such a release frequently has a mixed, but often moderately favourable short-term effect, as the technology sector tends to react more than others to shifts in rate expectations and bond yields. When yields fall, the present value of future cash flows rises, supporting growth-stock valuations, especially large-cap tech names and businesses with resilient margins. At the same time, weaker service momentum can also imply that corporate clients may become more cautious with spending, which increases the risk of slower sales growth in segments tied to company budgets.
US Tech technical analysis
For the US equity market, the effect typically reflects two opposing components. On the one hand, weaker PMI data raises the probability of profit deceleration in cyclical sectors and can reduce overall risk appetite. On the other hand, cooling activity often eases concerns about an overheating economy and inflationary pressures, which can push government bond yields lower and lead to softer expectations for the interest rate path.
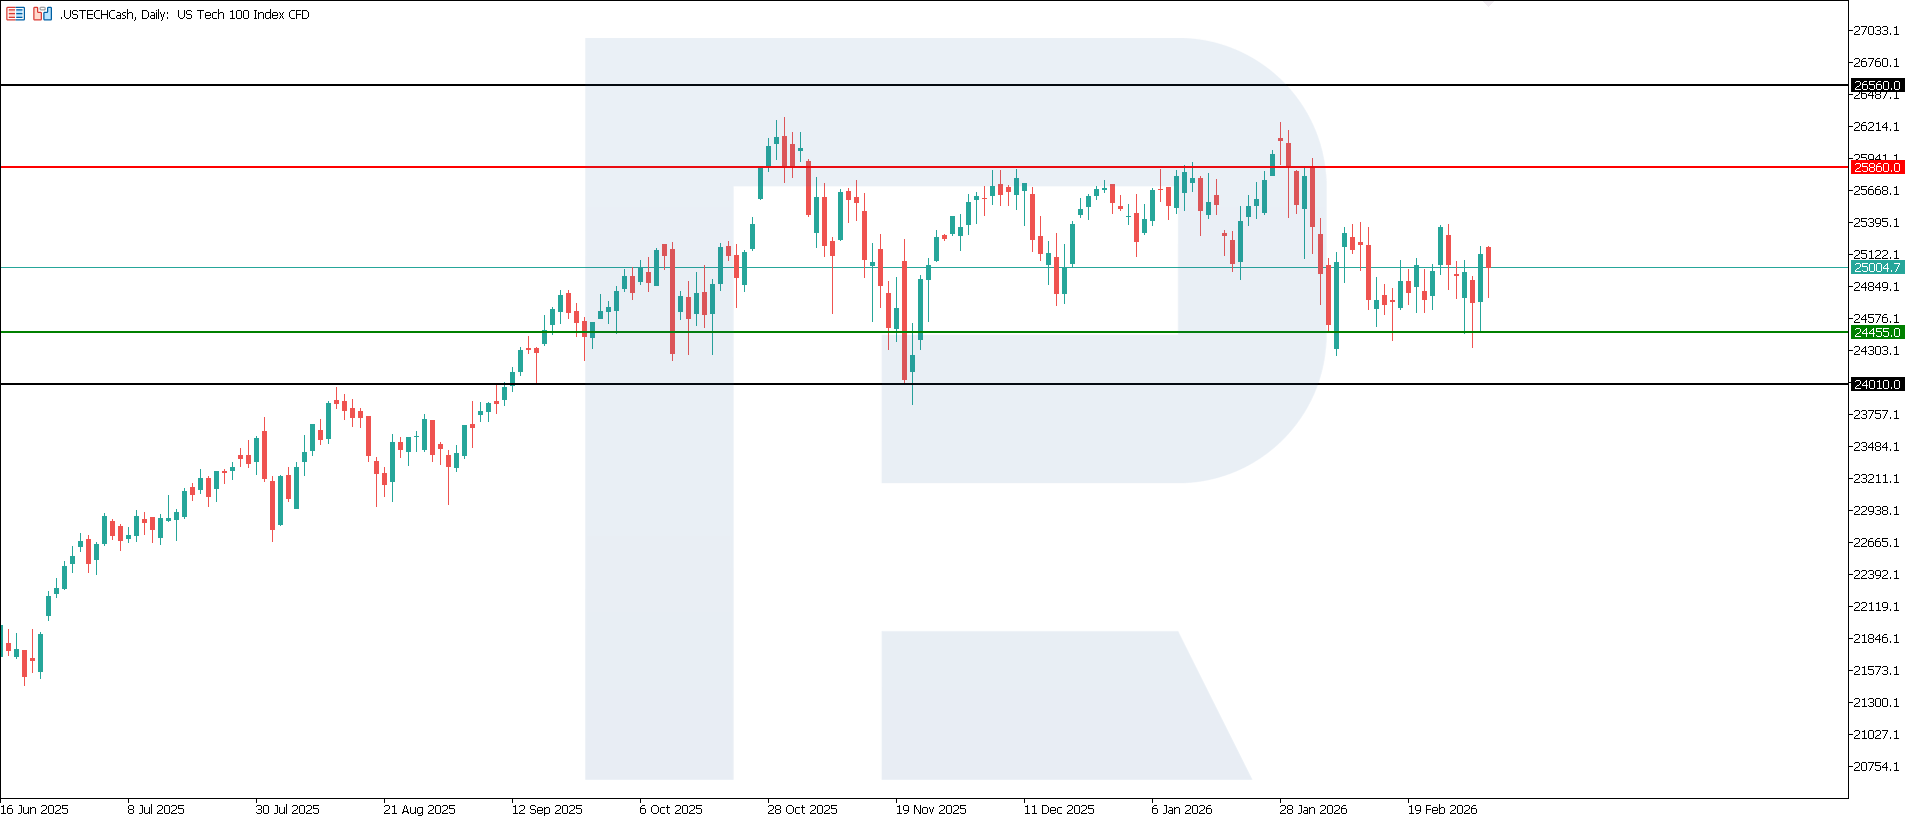
The US Tech index has started to decline. The nearest resistance level is around 25,860.0, while the key support level has formed near 24,455.0. Prices currently remain in a sideways range and are testing the support zone. If pressure persists, the next downside target could be 24,010.0.
The US Tech price forecast outlines the following scenarios:
- Pessimistic US Tech scenario: a breakout below the 24,455.0 support level could send the index down to 24,010.0
- Optimistic US Tech scenario: a breakout above the 25,860.0 resistance level could boost the index to 26,560.0
Summary
In practical terms, this data alone does not signal a reversal, since the index remains in expansion territory; however, it increases the likelihood that the market will pay closer attention to upcoming releases on employment, inflation, and consumer demand. Meanwhile, high-quality large-cap technology companies may look relatively better than the broader market due to the impact of interest rate expectations. The next downside target could be 24,010.0.
Editors’ picks
 EURUSD 2026-2027 forecast: key market trends and future predictions
This article provides the EURUSD forecast for 2026 and 2027 and highlights the main factors determining the direction of the pair’s movements. We will apply technical analysis, take into account the opinions of leading experts, large banks, and financial institutions, and study AI-based forecasts. This comprehensive insight into EURUSD predictions should help investors and traders make informed decisions.
 Gold (XAUUSD) forecast 2026 and beyond: expert insights, price predictions, and analysis
Dive deep into the Gold (XAUUSD) price outlook for 2026 and beyond, combining technical analysis, expert forecasts, and key macroeconomic factors. It explains the drivers behind gold’s recent surge, explores potential scenarios including a move toward 4,500 to 5,000 USD per ounce, and highlights why the metal remains a strong hedge during global uncertainty.
Forecasts presented in this section only reflect the author’s private opinion and should not be considered as guidance for trading. RoboForex bears no responsibility for trading results based on trading recommendations described in these analytical reviews.