US Tech forecast: the downtrend is gaining momentum
The US Tech index is consolidating below the support level and is poised for further decline. The US Tech forecast for next week is negative.
US Tech forecast: key takeaways
- Recent data: US initial jobless claims for last week came in at 210 thousand
- Market impact: the current data is negative for the technology sector
US Tech fundamental analysis
US initial jobless claims data generally looks like a moderately strong signal for the US economy. The actual figure was 210 thousand, below the forecast of 211 thousand, meaning the reading was slightly better than expected. At the same time, compared to the previous figure of 205 thousand, this represents a small increase. This combination is typically interpreted as the labour market remaining resilient without signs of a sharp deterioration. For the stock market, this suggests the US economy is still in a relatively stable condition, but it also reduces the likelihood of rapid monetary easing.
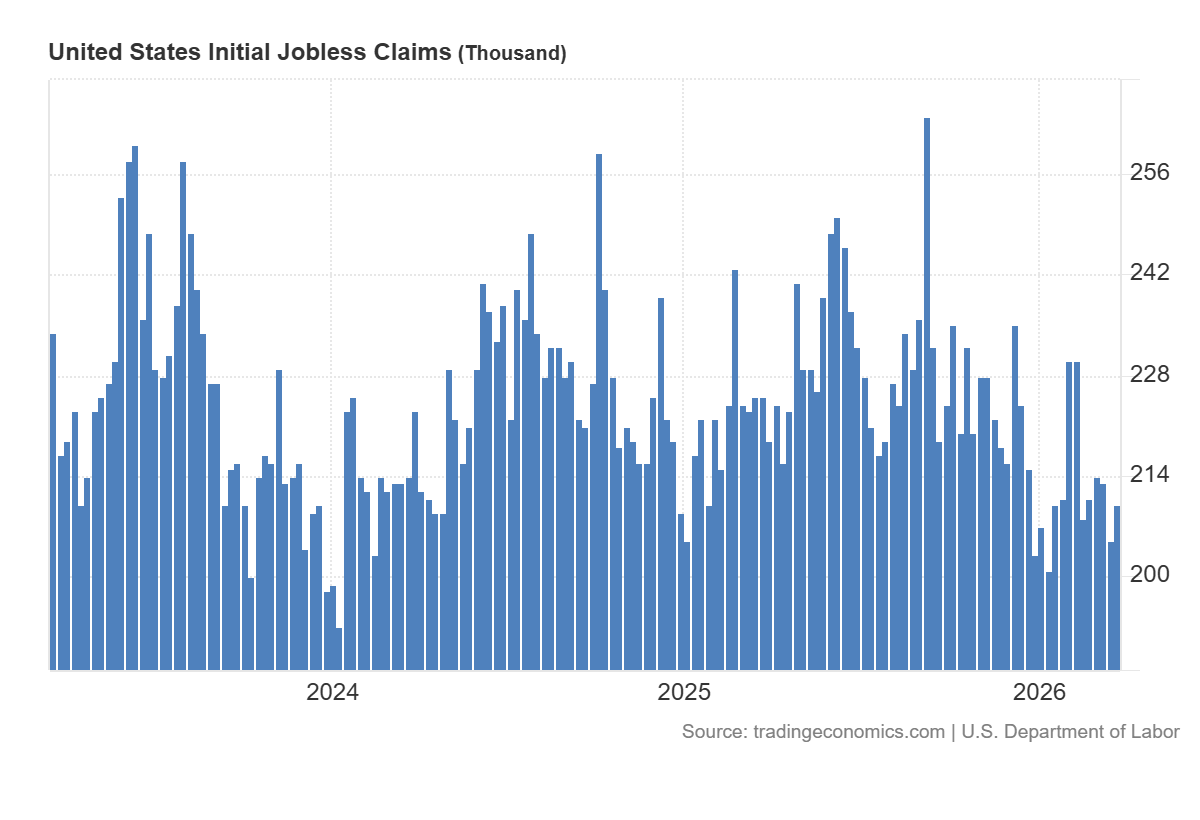
For the US Tech index, this news is rather neutral with a slight restraining effect. The technology sector is particularly sensitive to interest rate expectations, as the value of such companies largely depends on future earnings and long-term growth rates. When labour market data comes in fairly strong, it means the Federal Reserve has fewer reasons to rush into cutting rates.
US Tech technical analysis
At the same time, it is also unlikely to see a significant negative impact on the technology index. The difference between the actual figure and the forecast is minimal, and the indicator remains within a range that does not indicate either overheating or a sharp weakening of the labour market. In other words, this is not the kind of report that can, by itself, sharply shift market expectations. The most likely reaction for the US Tech is restrained, with possible short-term pressure on the segments most sensitive to interest rates.
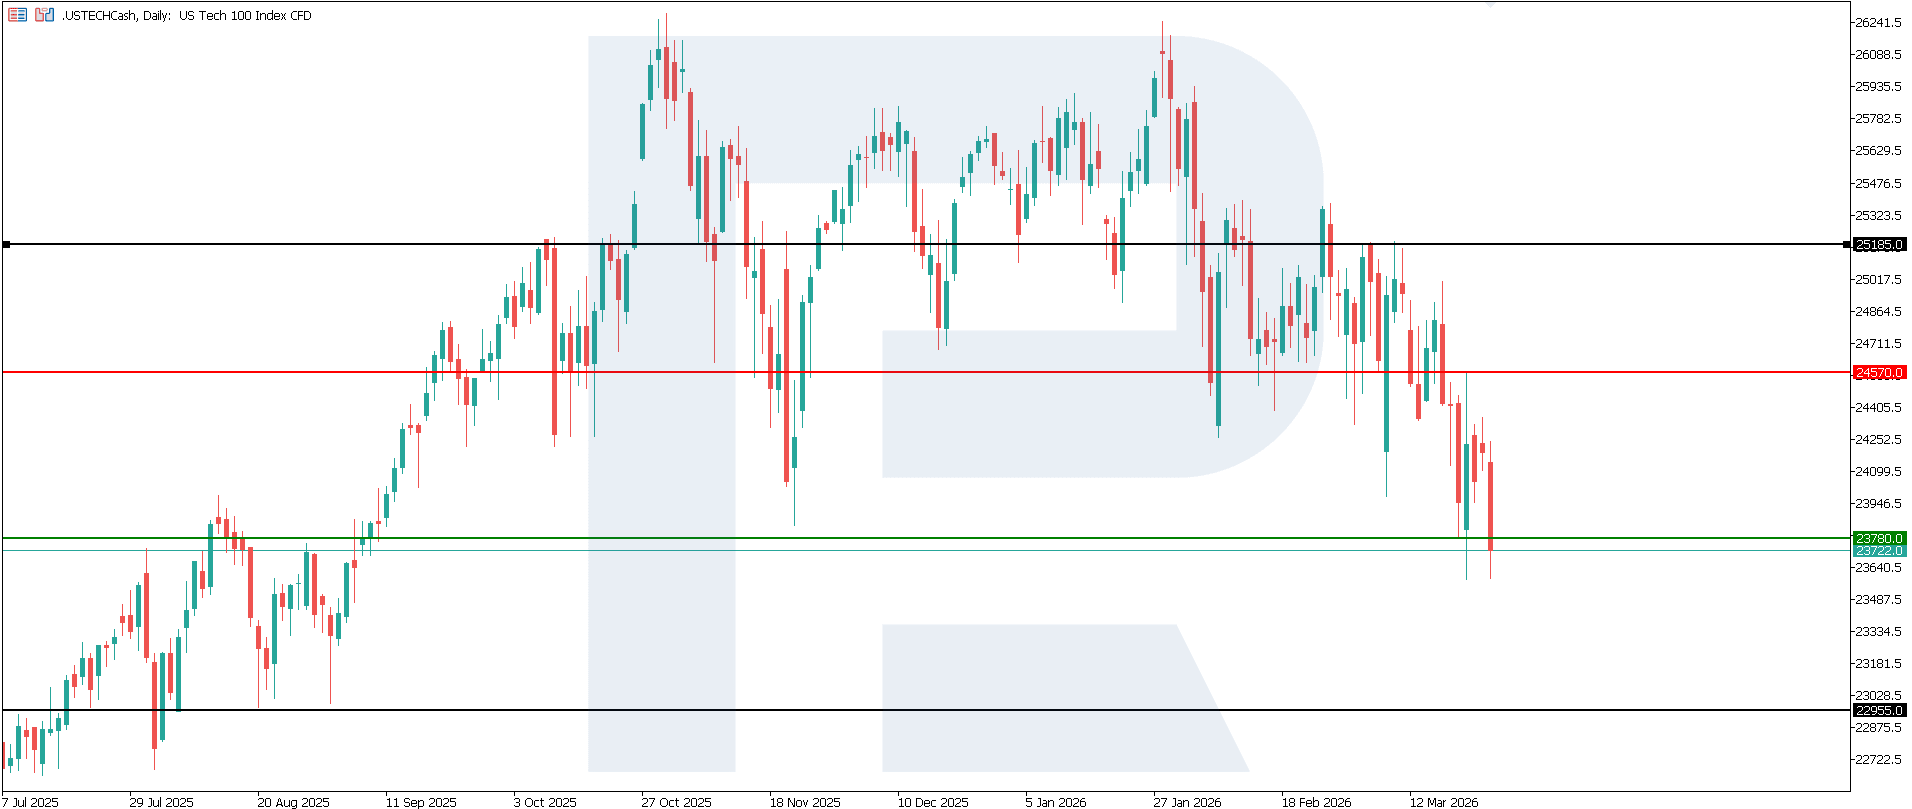
The US Tech index is showing downward momentum. The nearest resistance level is located around 24,570.0, while the main support level lies at 23,780.0. Prices are currently consolidating below support. If pressure persists, the next downside target could be the 22,955.0 area.
The US Tech price forecast outlines the following scenarios:
- Pessimistic US Tech scenario: if the price consolidates below the breached support level at 23,780.0, the index could dip to 22,955.0
- Optimistic US Tech scenario: a breakout above the 24,570.0 resistance level could drive the index up to 25,180.0
Summary
This release will most likely be viewed by the market as a signal that the US economy remains fairly resilient, but there are no additional reasons to expect rapid policy easing from the Federal Reserve. For the US Tech index, this is a neutral-to-negative factor, as the sector is rate-sensitive. For the US stock market overall, it is a moderately constructive, but not strongly positive, piece of news: it supports confidence in the state of the economy while simultaneously limiting hopes for cheaper money. The next downside target could be 22,955.0.
Editors’ picks
 EURUSD 2026-2027 forecast: key market trends and future predictions
This article provides the EURUSD forecast for 2026 and 2027 and highlights the main factors determining the direction of the pair’s movements. We will apply technical analysis, take into account the opinions of leading experts, large banks, and financial institutions, and study AI-based forecasts. This comprehensive insight into EURUSD predictions should help investors and traders make informed decisions.
 Gold (XAUUSD) forecast 2026 and beyond: expert insights, price predictions, and analysis
Dive deep into the Gold (XAUUSD) price outlook for 2026 and beyond, combining technical analysis, expert forecasts, and key macroeconomic factors. It explains the drivers behind gold’s recent surge, explores potential scenarios including a move toward 4,500 to 5,000 USD per ounce, and highlights why the metal remains a strong hedge during global uncertainty.
Forecasts presented in this section only reflect the author’s private opinion and should not be considered as guidance for trading. RoboForex bears no responsibility for trading results based on trading recommendations described in these analytical reviews.