US Tech forecast: the index resumed its upward movement with a strong impulse
The US Tech index broke through resistance with a strong impulse and formed an uptrend. The US Tech forecast for next week is negative.
US Tech forecast: key takeaways
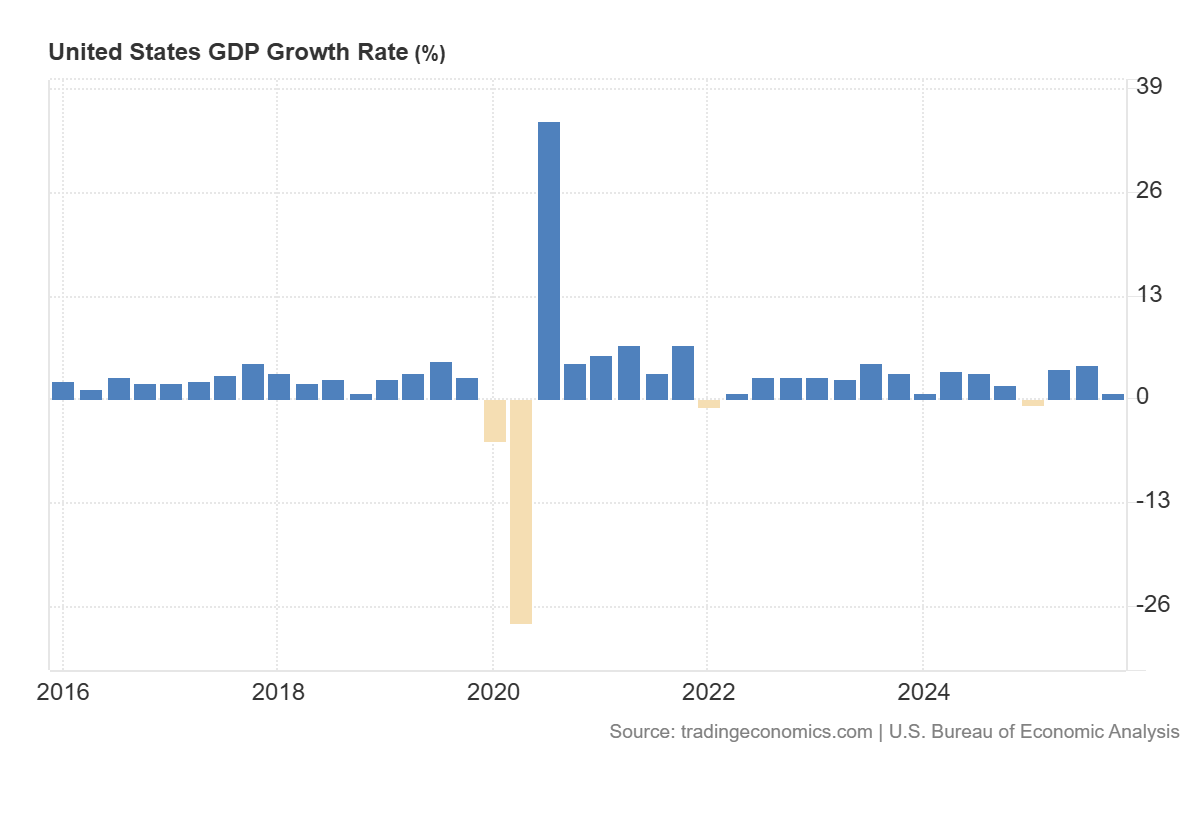
- Recent data: U.S. GDP for March increased by 0.5%
- Market impact: for the technology sector, the current data are mixed
US Tech fundamental analysis
The release of the U.S. GDP data looks restrainedly negative for the US Tech index overall. The U.S. economy grew only 0.5% (annualized) in Q4 2025, while the consensus expected 0.7%, and the previous quarter showed growth of 4.4%. This signals a noticeable slowdown in business activity and confirms that the economy entered 2026 with weaker momentum than the market had assumed. This matters for the technology index because the sector’s stocks are sensitive not only to interest rates, but also to expectations for corporate revenues, business investment, and consumer demand.
For US Tech, the initial reaction may be mixed, but in the base scenario the news is more likely to worsen the fundamental backdrop. On the one hand, weaker GDP is a signal of more moderate economic growth, meaning the market may revise down expectations for sales growth at companies tied to advertising, corporate budgets, e-commerce, and consumer activity. On the other hand, weaker macro data sometimes support the technology sector via expectations of a more accommodative Fed and lower bond yields.
US Tech technical analysis
For the broader U.S. equity market, this data means the overall background becomes less favorable for cyclical growth. Weaker GDP usually reduces investors’ risk appetite for sectors that depend more on accelerating economic activity and increases demand for more resilient business models. In other words, the report by itself does not necessarily trigger a large-scale sell-off, but it raises the probability of more cautious market behavior, where investors become more selective and less willing to pay premium valuations for companies whose profits depend on fast economic expansion.
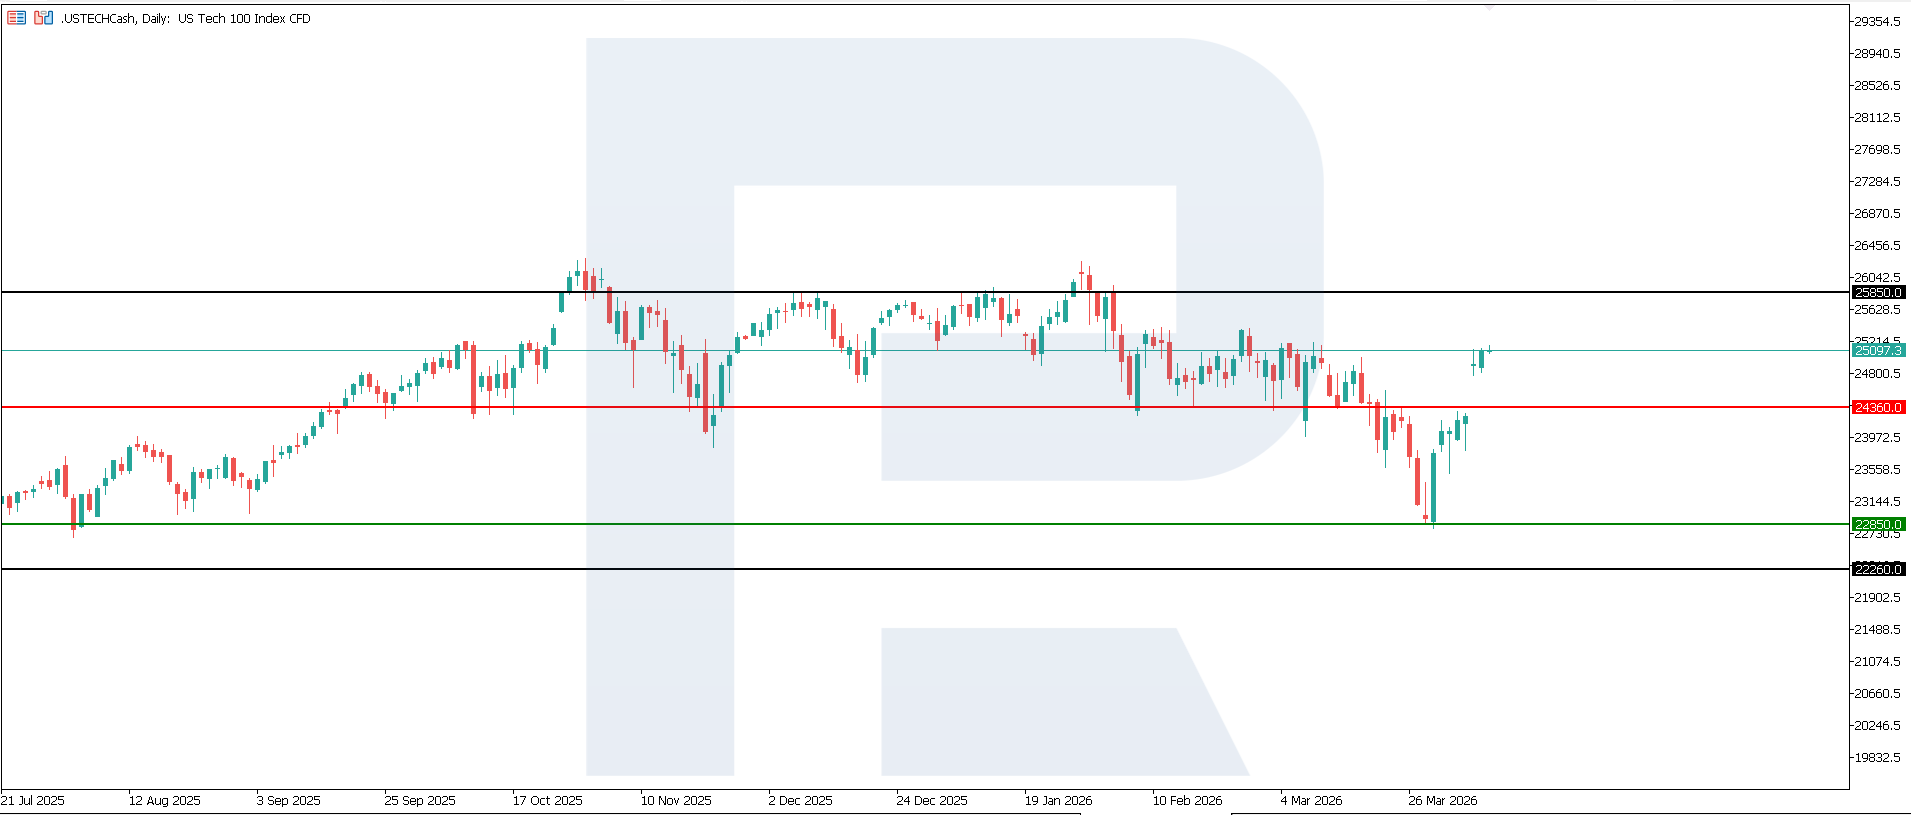
The US Tech index is showing strong upward momentum. The nearest resistance area around 24,360.0 points has been broken, while the main support is at 22,850.0. At the moment, a new resistance level has not yet formed. Volatility remains elevated. If the rally continues, the target level may be the 25,850.0-point area.
For the US Tech index price forecast, the following scenarios can be highlighted:
- Bearish scenario for US Tech: if support at 22,850.0 is broken, quotes may fall to 22,260.0
- Bullish scenario for US Tech: if price holds above the broken resistance at 24,360.0, quotes may rise to 25,850.0
Summary
In official terms, the conclusion can be described as follows: the news is moderately negative for the US Tech index and generally restrainedly negative for the U.S. stock market, as it confirms weaker economic dynamics than expected. The most vulnerable segments are cyclical and highly valued areas, while defensive industries may show relative resilience. In the short term, the market reaction may be mixed due to the ceasefire factor in the Middle East. The nearest upside target may be 25,850.0.
Editors’ picks
 EURUSD 2026-2027 forecast: key market trends and future predictions
This article provides the EURUSD forecast for 2026 and 2027 and highlights the main factors determining the direction of the pair’s movements. We will apply technical analysis, take into account the opinions of leading experts, large banks, and financial institutions, and study AI-based forecasts. This comprehensive insight into EURUSD predictions should help investors and traders make informed decisions.
 Gold (XAUUSD) forecast 2026 and beyond: expert insights, price predictions, and analysis
Dive deep into the Gold (XAUUSD) price outlook for 2026 and beyond, combining technical analysis, expert forecasts, and key macroeconomic factors. It explains the drivers behind gold’s recent surge, explores potential scenarios including a move toward 4,500 to 5,000 USD per ounce, and highlights why the metal remains a strong hedge during global uncertainty.
Forecasts presented in this section only reflect the author’s private opinion and should not be considered as guidance for trading. RoboForex bears no responsibility for trading results based on trading recommendations described in these analytical reviews.