US Tech forecast: the index is correcting
After reaching a new all-time high, the US Tech index started to decline, but the global trend remains bullish. The US Tech forecast for next week is positive.
US Tech forecast: key takeaways
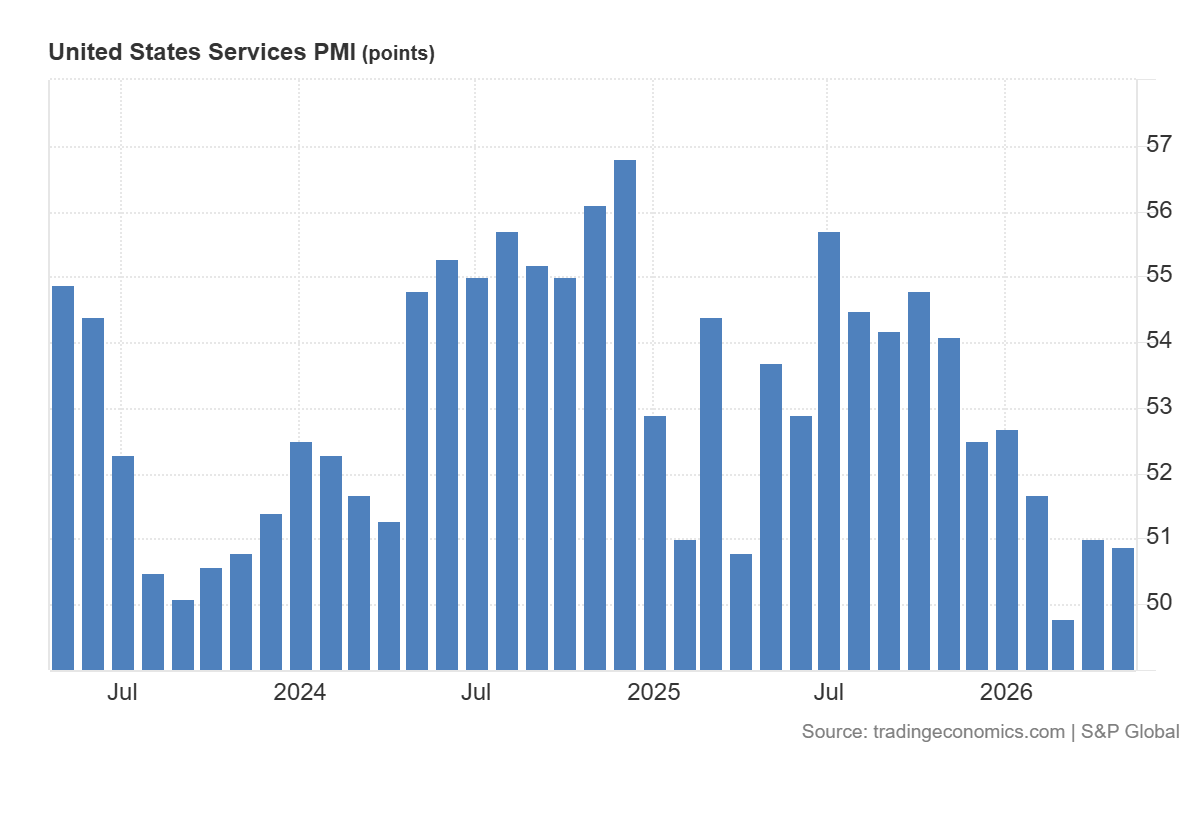
- Recent data: the preliminary US services PMI came in at 50.9 in May
- Market impact: the current data has a mixed effect on the technology sector
US Tech fundamental analysis
A drop in the US services PMI to 50.9 points, compared to the forecast of 51.1 and the previous 51.0, is a moderately negative signal for the market. The indicator remains above the 50-point threshold, indicating continued growth in business activity, but a weaker-than-expected figure suggests the pace of expansion is slowing. For the US Tech index, this news can have a dual effect. On the one hand, a weaker PMI reduces investor confidence in the sustainability of economic growth. On the other hand, signs of cooling in the economy may strengthen expectations for a more accommodative Federal Reserve policy in the future.
For the US Tech, the short-term reaction may be moderately negative or mixed. If investors interpret the data as a sign of weakening demand in the economy, pressure could increase on stocks of companies involved in corporate IT spending, cloud services, advertising, and software. As business activity deteriorates, companies may take a more cautious approach to new investments and cut spending on digital infrastructure, marketing, and technology solutions.
US Tech technical analysis
In the US stock market overall, the services PMI data could heighten caution, since the service sector is a key part of the US economy. A slowdown in this sector could indicate weaker consumer activity, slower order growth, and more cautious business behaviour. This could reduce interest in risk assets, especially if investors see the report as confirmation that the economy is gradually losing momentum.
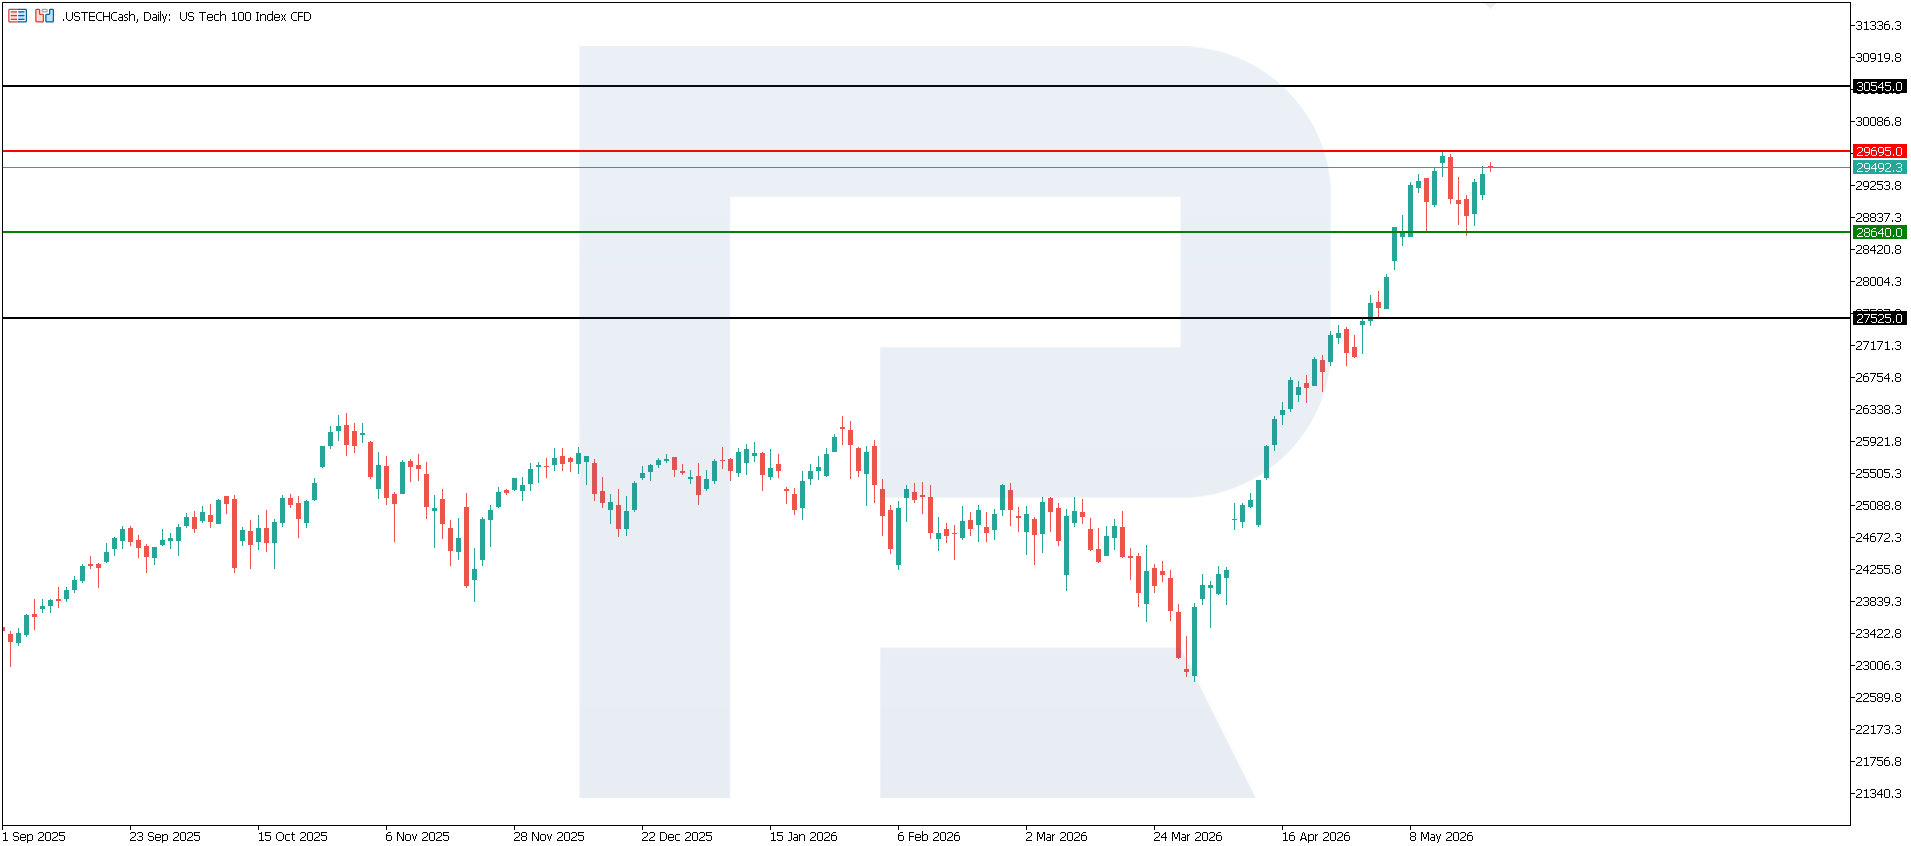
After hitting a new all-time high, the US Tech index started to decline. The resistance level formed around 29,695.0, while the nearest support is located at 28,640.0. The current trend is strong enough to expect another all-time high. If the rise continues, the next upside target could be 30,545.0.
The US Tech price forecast outlines the following scenarios:
- Pessimistic US Tech scenario: a breakout below the 28,640.0 support level could send the index down to 27,525.0
- Optimistic US Tech scenario: a breakout above the 29,695.0 resistance level could drive the index up to 30,545.0
Summary
The key risk is that a further decline in business activity in the service sector could fuel concerns about a slowing US economy. However, since the indicator remains above 50 points, the market may view the data not as a crisis signal, but as a sign of a soft cooling. For the US Tech, this creates a mixed backdrop: caution and profit-taking may prevail in the short term, but in the medium term, weaker macroeconomic data could support the sector through expectations of a more accommodative Fed policy. The nearest upside target could be 30,545.0.
Editors’ picks
 EURUSD 2026-2027 forecast: key market trends and future predictions
This article provides the EURUSD forecast for 2026 and 2027 and highlights the main factors determining the direction of the pair’s movements. We will apply technical analysis, take into account the opinions of leading experts, large banks, and financial institutions, and study AI-based forecasts. This comprehensive insight into EURUSD predictions should help investors and traders make informed decisions.
 Gold (XAUUSD) forecast 2026 and beyond: expert insights, price predictions, and analysis
Dive deep into the Gold (XAUUSD) price outlook for 2026 and beyond, combining technical analysis, expert forecasts, and key macroeconomic factors. It explains the drivers behind gold’s recent surge, explores potential scenarios including a move toward 4,500 to 5,000 USD per ounce, and highlights why the metal remains a strong hedge during global uncertainty.
Forecasts presented in this section only reflect the author’s private opinion and should not be considered as guidance for trading. RoboForex bears no responsibility for trading results based on trading recommendations described in these analytical reviews.