
US Tech forecast: index resumes growth
The US Tech index broke out of its sideways range and resumed its rise, with the potential to reach a new all-time high. The US Tech forecast for next week is positive.
US Tech forecast: key takeaways
- Recent data: US GDP grew by 1.5% in Q2 2026
- Market impact: the current data is negative for the technology sector
US Tech fundamental analysis
US Q2 GDP growth came in at 1.5%, below a forecast of 2.1% and the previous reading of 2.1%. The result indicates a more pronounced slowdown in the US economy than expected. For financial markets, this is a mixed signal. On the one hand, slower economic growth increases the risk of a decline in corporate earnings and weaker consumer activity. On the other hand, a weaker economy may increase expectations of monetary policy easing by the Federal Reserve, which could support stocks through potentially lower interest rates and government bond yields.
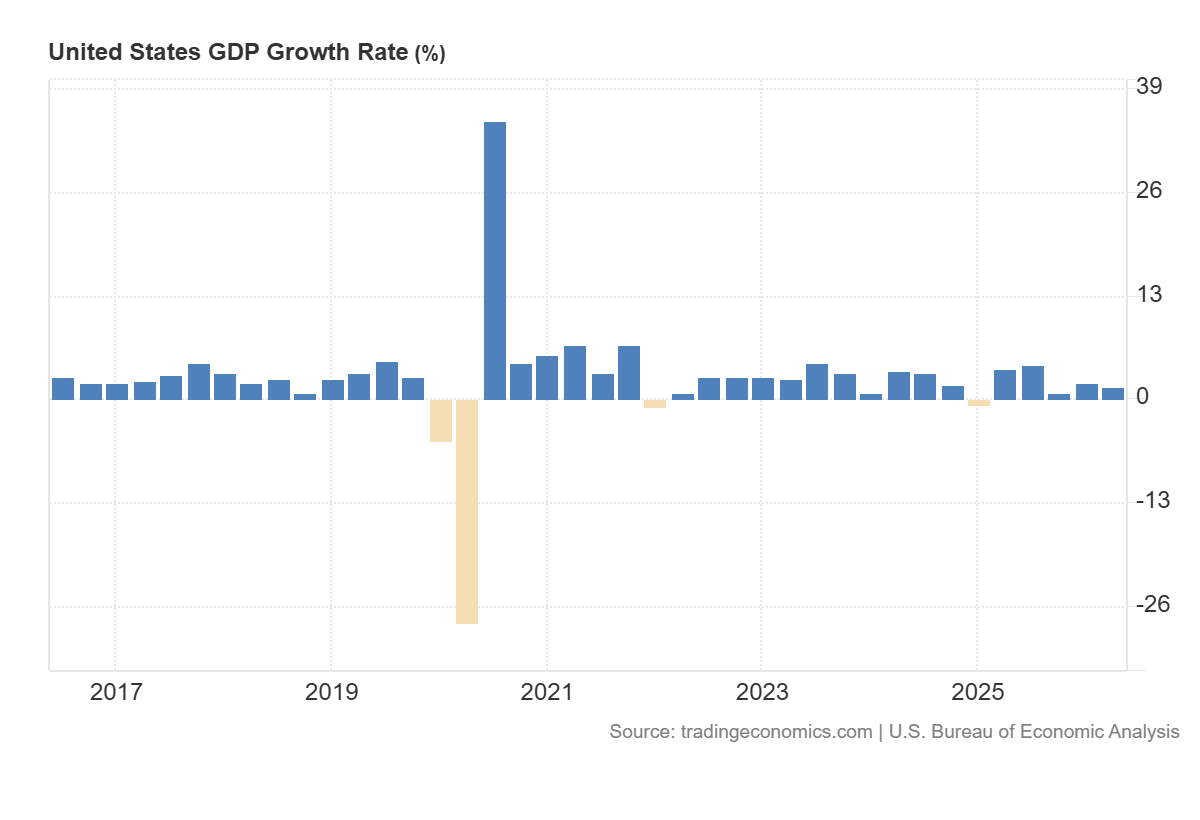
For the US Tech index, the initial reaction may be moderately negative, as the actual reading came in significantly below the forecast. Investors may be concerned about reduced corporate spending on information technology, cloud services, software, and digital advertising. Slower economic growth may also limit demand for computers, smartphones, semiconductors, and other technology products.
US Tech technical analysis
For the US stock market as a whole, the release is a rather negative signal, as it increases the likelihood of downward revisions to companies’ revenue and earnings forecasts. Weaker GDP growth may mean lower consumer spending, reduced production, and a more cautious investment policy by businesses. Investors may temporarily reduce their holdings in stocks sensitive to the economic cycle and increase allocations to more stable assets.
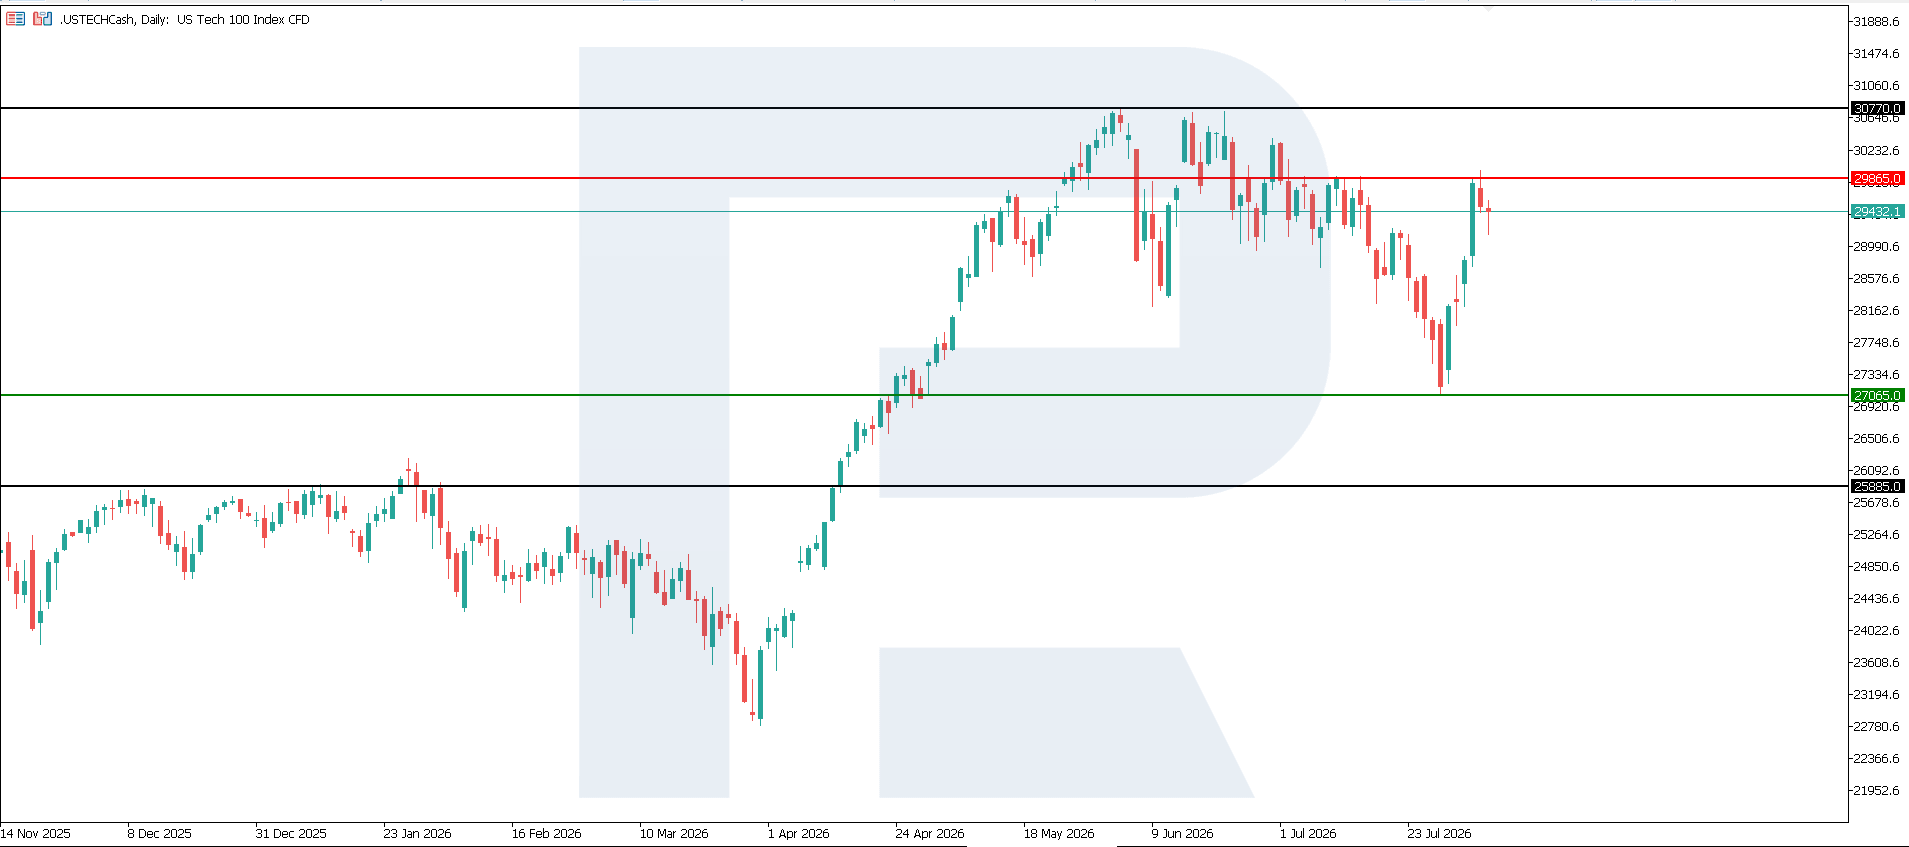
The US Tech index has shifted to an uptrend. The nearest resistance level has formed at 29,865.0, while the main support is located at 27,065.0. The index is experiencing elevated volatility. At the same time, if buying activity is insufficient, the index may continue to move within a sideways range. If the rise continues, the target could be 30,770.0.
The US Tech price forecast outlines the following scenarios:
- Pessimistic US Tech scenario: a breakout below the 27,065.0 support level could push the index down to 25,885.0
- Optimistic US Tech scenario: a breakout above the 29,865.0 resistance level could propel the index up to 30,770.0
Summary
The GDP data poses short-term downside risks for the US Tech and the broader US stock market, as it points to a weaker economy than expected. However, the overall reaction of the technology index may be less negative if market participants strengthen expectations of interest rate cuts. The further direction will depend on inflation data, labour market conditions, and comments from the Federal Reserve. If the economic slowdown is accompanied by lower inflation, the market could recover fairly quickly. The nearest upside target could be 30,770.0.
Editors’ picks
 EURUSD forecast 2026–2027: technical analysis, price levels & predictions
EURUSD has pulled back from the 2026 high of 1.1915 and is now trading near 1.1450 — below both EMA65 and EMA200 — with the active scenario shifting from bullish to bearish. The ECB raised rates to 2.40%, but the Fed holds at 3.75%, and US inflation (3.5%) continues to outpace the eurozone (2.8%). A confirmed break below 1.1280 opens the next downward wave toward 1.1080. We break down the key levels, three trading scenarios with entry triggers, and what Deutsche Bank, Morgan Stanley and UBS are forecasting for EURUSD in 2026.
 Gold (XAUUSD) forecast 2026: predictions based on fundamental and technical analysis
Gold has corrected over 25% from its all-time high of 5,597 USD and is now trading near 4,100 USD — testing a critical support zone. Is this the bottom, or will the downtrend continue? We break down the key levels (support 3,920 USD, breakout trigger 4,500 USD), three trading scenarios with entry levels, and what J.P. Morgan, Goldman Sachs and Deutsche Bank are forecasting for gold in 2026.
Forecasts presented in this section only reflect the author’s private opinion and should not be considered as guidance for trading. RoboForex bears no responsibility for trading results based on trading recommendations described in these analytical reviews.