
US Tech on the verge of a new move: market awaits a signal from Jackson Hole
US Tech analysis shows that the index still has a good chance of extending its gains. The US Tech price currently stands at 29,345.8.
US Tech forecast: key takeaways
- The market is awaiting the outcome of the Jackson Hole Symposium
- High Treasury yields remain one of the main headwinds for further gains in stocks
US Tech fundamental analysis
The US Tech forecast for today, 21 August 2026, takes into account that, following the decline, the index is forming a corrective wave and testing the 29,345.8 level.
US technology stocks came under renewed pressure after US Treasury yields rose. The 10-year Treasury yield is currently holding at around 4.71%, while the 30-year yield is near 5.25%. This is particularly challenging for the technology sector: when the cost of capital is high, companies whose valuations depend heavily on future earnings tend to suffer the most.
Following the large-scale wave of investment in artificial intelligence, the market is increasingly questioning when and to what extent Big Tech’s enormous spending will pay off. Concerns about excessive investment in AI have previously triggered sell-offs in chipmakers and other technology stocks.
On the one hand, weak employment data and moderate price growth have reduced expectations of further policy tightening. On the other hand, inflation remains noticeable, and energy prices are rising, so the Fed cannot move quickly towards easing. The market is now awaiting speeches by policymakers at the Jackson Hole Symposium, where investors hope to hear new signals on interest rates.
The US Tech index forecast is based on the view that the main headwinds for further gains in stocks remain high Treasury yields, high oil prices, and increasingly pressing questions about how and when the enormous investment in AI will generate returns. At the same time, the sector continues to receive support from strong earnings reports by the largest technology companies and sustained long-term demand for AI infrastructure. The key highlight next week will be the Federal Reserve’s Jackson Hole Symposium, which could significantly shift expectations for US interest rates.
US Tech technical analysis
On the H4 chart, the US Tech price has formed a Hammer reversal pattern near the lower Bollinger Band and is trading around 29,360.9. Since the price is moving within an ascending channel, it could form an upward wave as the pattern signal plays out, with the first upside target at 30,230.0.
At the same time, the US Tech forecast also considers an alternative market scenario: US Tech quotes could extend the correction and head towards 29,000.0 before resuming their rise.
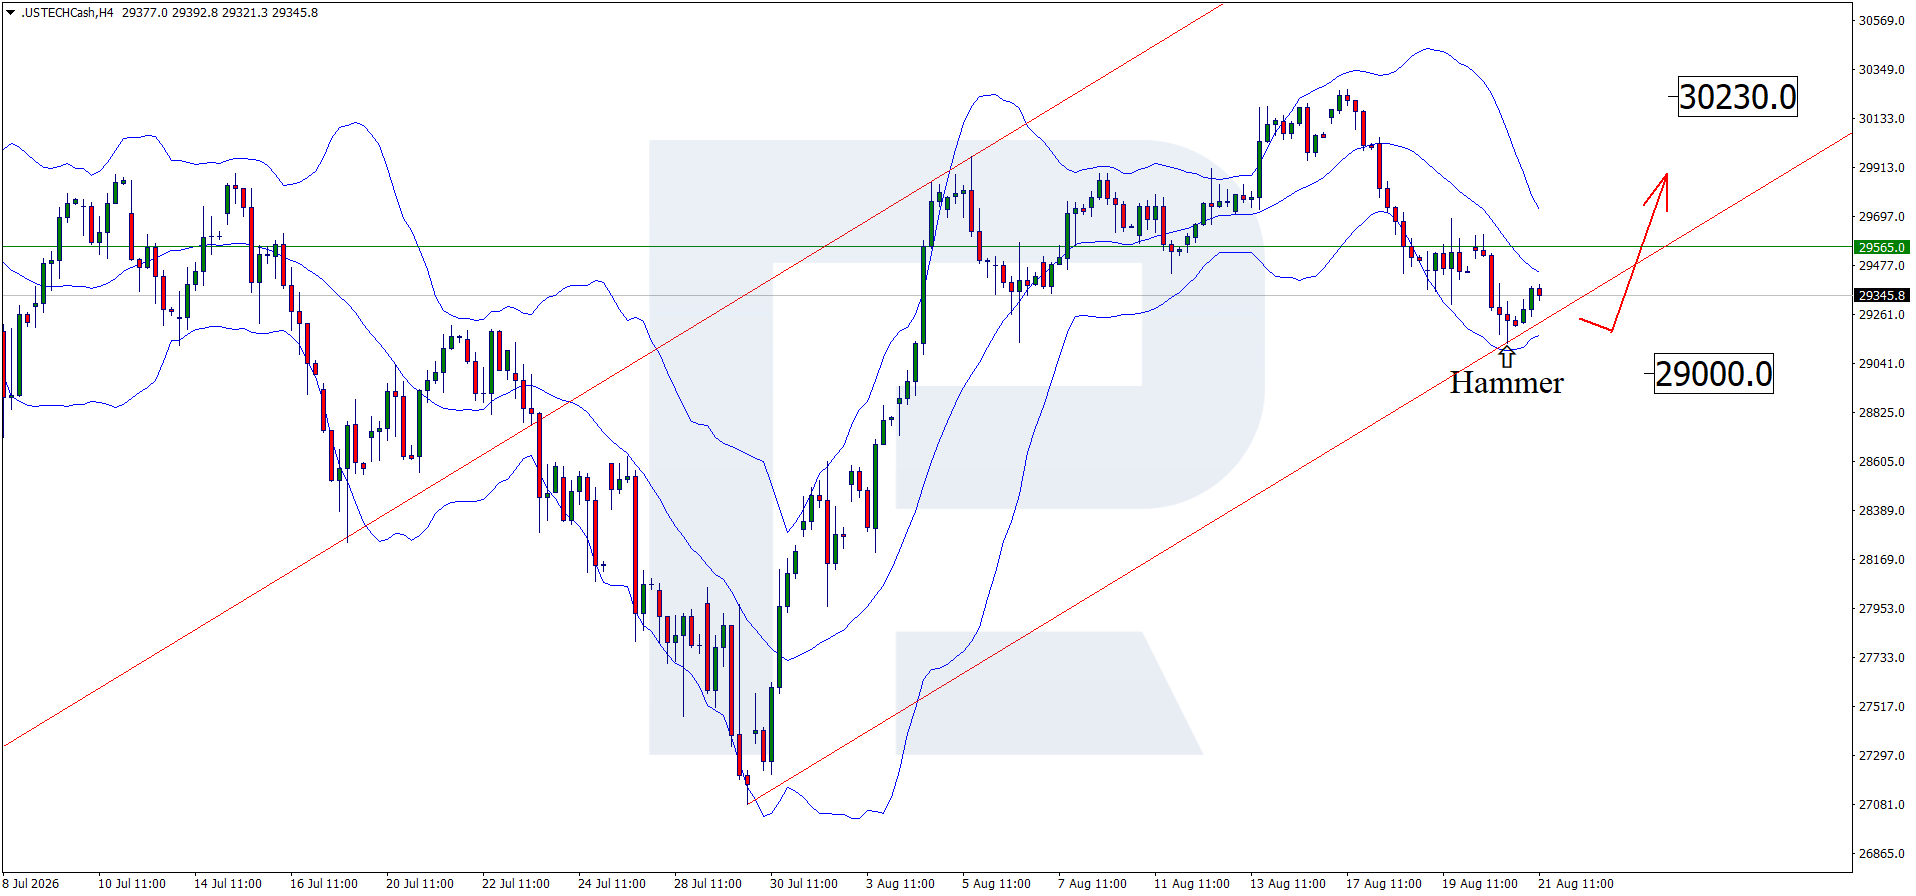
Main scenario (Buy Stop)
- Take Profit: 30,230.0
- Stop Loss: 29,375.0
Alternative scenario (Sell Stop)
- Take Profit: 28,300.0
- Stop Loss: 29,250.0
Trading idea validity period: 12:00 AM, 21 August 2026
Summary
The US Tech price forecast for today is moderately positive. Technical analysis suggests that, following the correction, the index could form an upward wave and head towards the 30,230.0 level.
Editors’ picks
 EURUSD forecast 2026–2027: technical analysis, price levels & predictions
EURUSD has pulled back from the 2026 high of 1.1915 and is now trading near 1.1450 — below both EMA65 and EMA200 — with the active scenario shifting from bullish to bearish. The ECB raised rates to 2.40%, but the Fed holds at 3.75%, and US inflation (3.5%) continues to outpace the eurozone (2.8%). A confirmed break below 1.1280 opens the next downward wave toward 1.1080. We break down the key levels, three trading scenarios with entry triggers, and what Deutsche Bank, Morgan Stanley and UBS are forecasting for EURUSD in 2026.
 Gold (XAUUSD) forecast 2026: predictions based on fundamental and technical analysis
Gold has corrected over 25% from its all-time high of 5,597 USD and is now trading near 4,100 USD — testing a critical support zone. Is this the bottom, or will the downtrend continue? We break down the key levels (support 3,920 USD, breakout trigger 4,500 USD), three trading scenarios with entry levels, and what J.P. Morgan, Goldman Sachs and Deutsche Bank are forecasting for gold in 2026.
Forecasts presented in this section only reflect the author’s private opinion and should not be considered as guidance for trading. RoboForex bears no responsibility for trading results based on trading recommendations described in these analytical reviews.