
Top 3 trade ideas for 18 September 2026
Trade ideas for XAUUSD, GBPUSD, and DE 40 are available today. The ideas expire on 18 September 2026 at 23:00 PM (server time, UTC +3).
XAUUSD trade idea
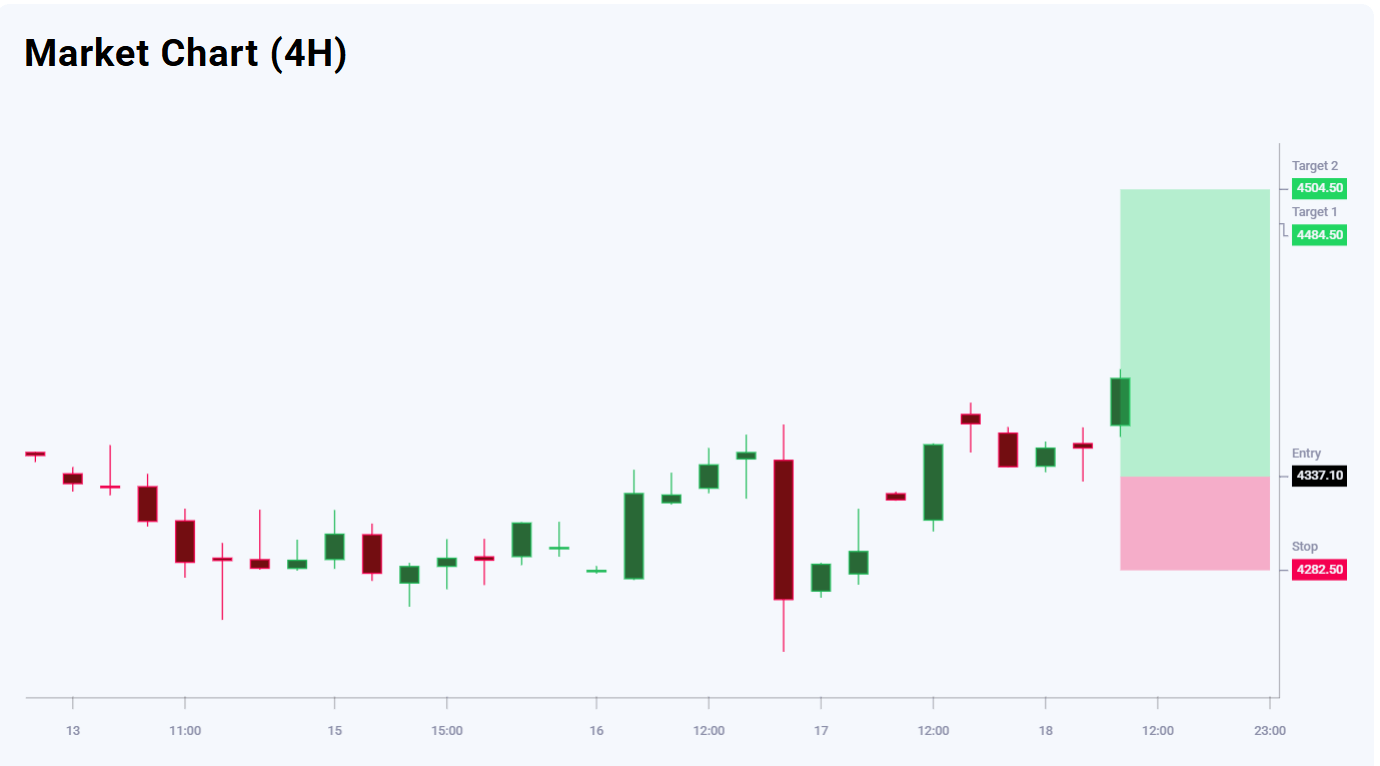
XAUUSD analysis on the H4 chart shows that after rebounding from the 4,235.20 area, prices moved into a recovery and formed a sequence of higher local lows. The current price is well above the proposed entry point, so buying at market appears less attractive from a risk-to-reward perspective. The baseline scenario involves placing a pending Buy Limit order at 4,337.10 and entering a long position after a temporary corrective decline. The 4,334.30–4,337.10 area acts as the nearest support zone, while consolidation below 4,282.50 would significantly weaken the bullish scenario. Additional support levels are located at 4,280.00 and 4,235.20, while the nearest resistance levels are at 4,402.60, 4,435.00, and 4,510.90.
The first target is at 4,484.50, offering upside potential of 147.40 points from the entry point. The second target at 4,504.50 offers upside potential of 167.40 points. A stop loss at 4,282.50 limits the risk to 54.60 points. The risk-to-reward ratio is therefore approximately 1:2.7 for the first target and 1:3.1 for the second. The scenario remains valid while the price stays above 4,282.50 and involves buying specifically after a pullback towards the 4,337.10 area rather than at current levels.
Trading plan
- Current price: 4,395.80
- Entry point: 4,337.10
- Stop loss: 4,282.50
- Target 1: 4,484.50
- Target 2: 4,504.50
- Risk-to-reward ratio: 1:2.7 and 1:3.1
GBPUSD trade idea
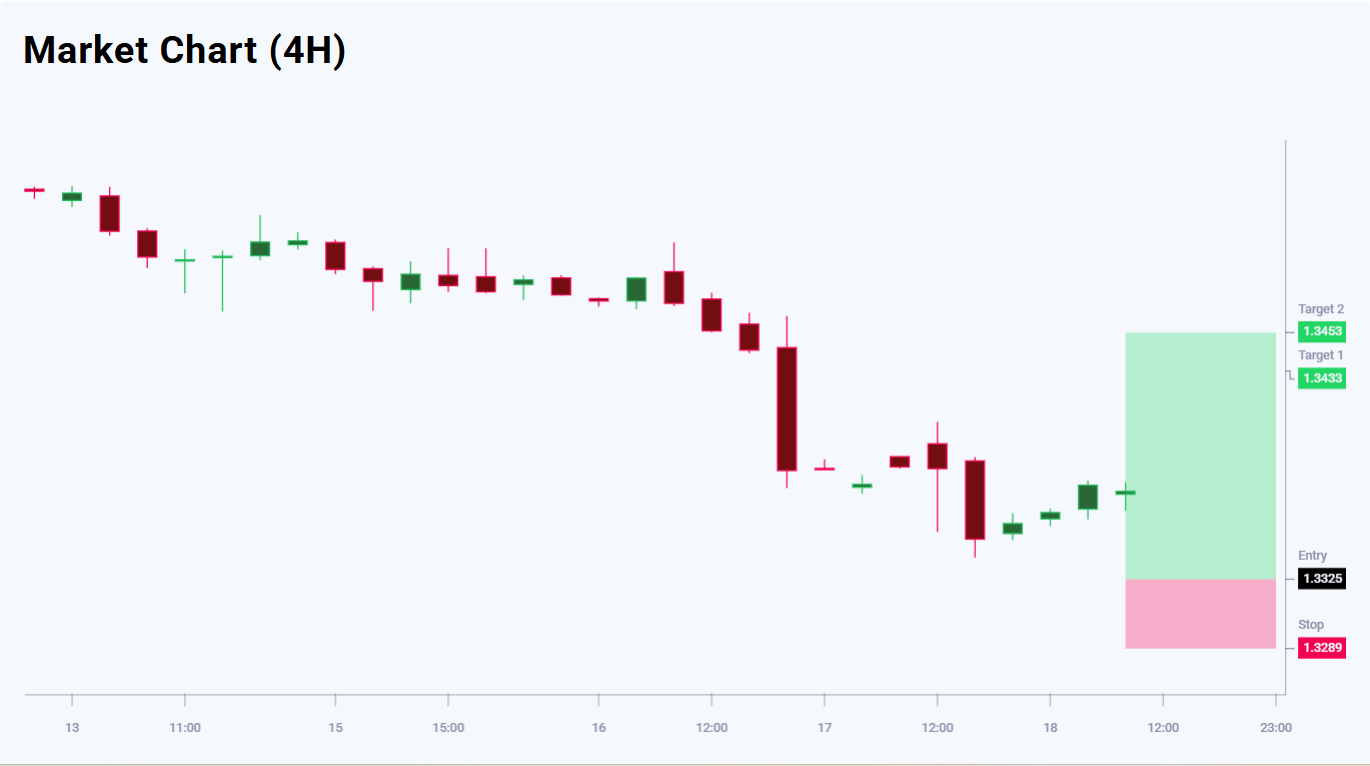
GBPUSD analysis on the H4 chart shows that after a pronounced decline, prices began to stabilise and are attempting to reverse upwards from local lows. Although the preceding movement remained bearish, easing selling pressure and a gradual recovery from the 1.3300 area point to a base forming for corrective growth. The current price is above the proposed entry point, so buying at market appears less attractive from a risk-to-reward perspective. The baseline scenario involves placing a pending Buy Limit order at 1.3325 and entering a long position after a temporary pullback. The 1.3336–1.3300 area acts as the nearest support zone, while consolidation below 1.3289 would significantly weaken the bullish scenario. Additional support is located at 1.3250, while the nearest resistance levels are at 1.3407, 1.3450, and 1.3500.
The first target is at 1.3433, offering upside potential of 108 pips from the entry point. The second target at 1.3453 offers upside potential of 128 pips. A stop loss at 1.3289 limits the risk to 36 pips. The risk-to-reward ratio is therefore 1:3 for the first target and approximately 1:3.6 for the second. The scenario remains valid while the price holds above the 1.3300–1.3325 area and involves buying specifically on a pullback towards support rather than at current levels.
Trading plan
- Current price: 1.3366
- Entry point: 1.3325
- Stop loss: 1.3289
- Target 1: 1.3433
- Target 2: 1.3453
- Risk-to-reward ratio: 1:3 and 1:3.6
DE 40 trade idea
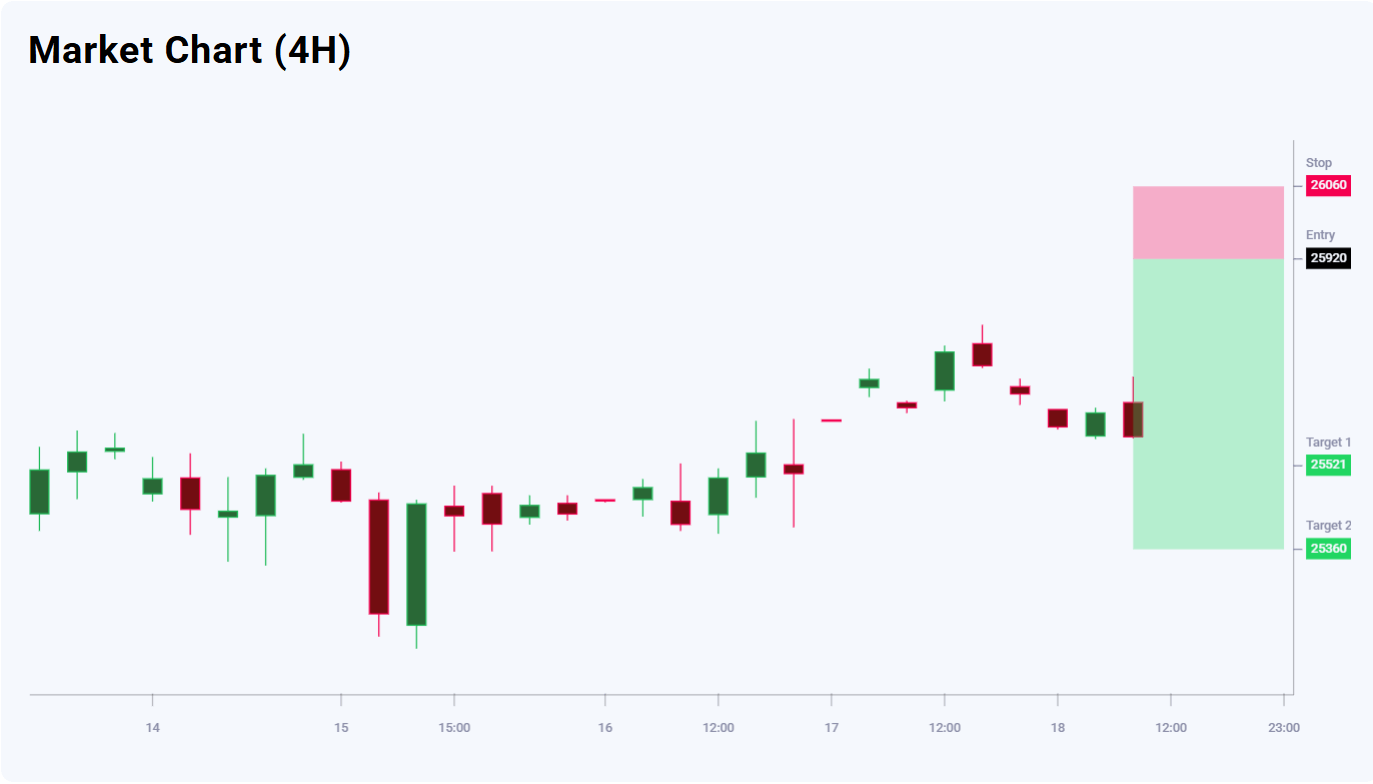
DE 40 analysis on the H4 chart shows that after a local rise, prices began to show signs of a top, while the subsequent decline points to weakening buying pressure. The short-term structure remains predominantly bearish, although the current price is below the proposed entry point, so selling at market appears less attractive from a risk-to-reward perspective. The baseline scenario involves placing a pending Sell Limit order at 25,920 and entering a short position after a corrective recovery. The 25,920–26,060 area acts as the nearest resistance zone, while consolidation above 26,060 would significantly weaken the bearish scenario. The nearest support is around 25,510, while deeper support levels are located at 24,820 and 24,260.
The first target is at 25,521, offering downside potential of 399 points from the entry point. The second target at 25,360 offers downside potential of 560 points. A stop loss at 26,060 limits the risk to 140 points. The risk-to-reward ratio is therefore approximately 1:2.9 for the first target and 1:4 for the second. The scenario remains valid while the price stays below 26,060 and involves selling specifically after a corrective rise towards the 25,920 area rather than at current levels.
Trading plan
- Current price: 25,543
- Entry point: 25,920
- Stop loss: 26,060
- Target 1: 25,521
- Target 2: 25,360
- Risk-to-reward ratio: 1:2.9 and 1:4
Editors’ picks
 EURUSD forecast 2026–2027: technical analysis, price levels & predictions
EURUSD has recovered from the July lows and is trading near 1.1545 — back in bullish territory. The pair has reclaimed EMA65 on the daily, formed a bullish EMA crossover on H4, and the US-eurozone GDP gap has narrowed sharply (US 1.5% vs eurozone 1.0%). Goldman Sachs and Deutsche Bank both now target 1.2500 by year-end. A confirmed close above 1.1700 opens the path to 1.1805. We break down the key levels, three trading scenarios, and what the unprecedented 9-3 FOMC dissent vote means for EURUSD.
 Gold (XAUUSD) forecast 2026: technical analysis, price levels & predictions
Gold has reversed its downtrend and is trading near 4,360 USD, back above both EMA65 and EMA200. ETF flows turned positive in July with 3 billion USD of net inflows, and central banks bought 288.9 tonnes in Q2 — up 62% year-on-year. A breakout above 4,500 USD opens the path to 4,855 USD and the 5,597 USD all-time high. We break down the key levels, three trading scenarios with entry triggers, and what J.P. Morgan, Deutsche Bank and Goldman Sachs are forecasting for gold in 2026.
Forecasts presented in this section only reflect the author’s private opinion and should not be considered as guidance for trading. RoboForex bears no responsibility for trading results based on trading recommendations described in these analytical reviews.