How to Read Bitcoin ETF Flows Through the Fed Meeting on 8-9 December: Signals to Watch

Bitcoin ETF flows show how much money US investors add to or take out of spot bitcoin funds each day, and the next scheduled date in the story is the Fed meeting on 8-9 December. By the 11 November session BlackRock's IBIT had recorded more than 2 billion USD of net outflows over nine straight sessions, Cointelegraph reported using Farside data. All US spot bitcoin ETFs together lost about 1.44 billion USD over five sessions, CoinDesk reported using SoSoValue data, and the same article put the chance of a rate hike in December at about 90% on CME FedWatch. This article turns those figures into four signals you can check every day, each with a rule that tells you when it stops applying.
TL;DR
- Track one series with one data provider. IBIT alone and all funds together give different runs, nine sessions and five.
- Four signals: the first run of net-inflow days, the size of the week against earlier weeks, how much of the outflow sits in one fund, and the sessions around the Fed meeting.
- The sources print flows and the rate outlook side by side and none says that one drives the other, so the scenarios below are conditions to check and carry no price view.
Last updated: 13 November 2026
Follow Markets in RoboForex MobileTrader
Quotes, charts and orders in one app, on your phone or in Telegram.
Which Bitcoin ETF Flows Number Should You Track?
A spot bitcoin ETF is a fund that holds bitcoin and trades on a stock exchange. Its net flow for a day is the money that came in through new shares minus the money that left through redeemed shares. A negative figure is a net outflow.
Headlines use different scopes for the same story, so the numbers do not line up. The windows also overlap on 5 and 6 November, which means the figures cannot be added together.
| Series | Scope | Window | Net outflow | Source and data provider |
|---|---|---|---|---|
| IBIT | One fund | Nine sessions to 11 November | More than 2 billion USD | Cointelegraph, Farside |
| All US spot funds | All funds | Five sessions from 5 November | About 1.44 billion USD | CoinDesk, SoSoValue; Cointelegraph, Farside |
| All 12 spot funds | All funds | Week of 2 to 6 November | 1.28 billion USD | The Block, SoSoValue |
This article uses the daily net flow of all funds as the main series and IBIT as the second one. IBIT carried most of the outflow on both days where the sources give its share.
Signal 1: When Does a Run of Bitcoin ETF Outflows End?
The Block listed the daily flows of the 12 funds for 2 to 6 November, using SoSoValue data. They add up to the weekly 1.28 billion USD (the five figures sum to 1,281.7 million USD).
Daily net flow of all US spot bitcoin ETFs, 2 to 6 November
2 Nov
-398.6
3 Nov
-115.6
4 Nov
+74.6
5 Nov
-430.2
6 Nov
-411.9
Million USD, bars to scale. Outflows extend left, the inflow extends right. Source: The Block, SoSoValue data.
Wednesday 4 November was the only net inflow of the week, 74.6 million USD, and the next two sessions lost 430.2 million and 411.9 million USD. One inflow day did not end the run. CoinDesk's count of five straight outflow days starts on 5 November, the session after that inflow.
Our reference rule for this article: treat a run of outflows as over after three net-inflow sessions in a row for all funds. Three is our choice, the sources define no such rule. Bitfinex told Cointelegraph that slowing outflows could be an early step toward a market floor, and added that they are not enough on their own to establish a recovery.
Signal 2: How Big Is the Week Against Earlier Ones?
The Block called 2 to 6 November the funds' worst week since late June and their second negative week in a row. The comparison week, which ended on 26 June, lost 1.79 billion USD. The Block ranked the November week seventh among the ten largest weekly outflows since the funds launched in January 2024. Year-to-date flows turned negative during the week: about 368 million USD of net inflows at the start of it, and about 914.1 million USD of net outflows by Friday.
| Period | Net outflow, all funds | Basis |
|---|---|---|
| Week to 26 June | 1.79 billion USD | The Block |
| 2 to 6 November | 1.28 billion USD | The Block, SoSoValue |
| 9 to 11 November, three sessions | About 0.6 billion USD | Our arithmetic: 1.44 billion since 5 November minus 0.842 billion for 5 and 6 November, both SoSoValue |
Threshold: a week with outflows above 1.28 billion USD would be the largest since the week to 26 June, and one above 1.79 billion USD would exceed that June week too. After three sessions the week of 9 to 13 November stands at about 0.6 billion USD, so the Thursday and Friday figures decide which side of the 1.28 billion line it lands on.
Signal 3: Is One Fund Doing Most of the Selling?
On Wednesday 11 November IBIT had 269.7 million USD of net outflows, about 90% of the roughly 300 million USD withdrawn from all US spot bitcoin ETFs that day, Cointelegraph reported. GBTC lost 39.1 million USD and MSBT added 9 million USD. Those three figures sum to a net outflow of 299.8 million USD, within 0.1 million of the 299.9 million USD total CoinDesk gave, so the other funds netted out close to zero on the day. This is our arithmetic across two data providers, and rounding can move it by a small amount.
The Block gave a similar share for Friday 6 November: IBIT lost 403 million USD, about 88% of that day's gross outflows. The two shares use different bases, one is a share of the net total and the other a share of gross outflows, so each should be compared only with its own base. Gross outflows count only the money that left, before inflows into other funds are netted against it.
Our rule for this article: when one fund is around 90% of a day's outflow, the day describes that fund. A broad signal needs outflows from several funds on the same day. Laser Digital named weak spot demand, a persistently negative Coinbase premium (bitcoin trading cheaper on Coinbase than on other venues) and liquidations of leveraged long positions (forced closing of bets on a rise) next to the outflows, readings that sit outside the ETF tables.
Signal 4: What Do Flows Look Like Around the Fed Meeting on 8-9 December?
The Federal Reserve's 2026 calendar lists the December meeting on 8 and 9 December, with a Summary of Economic Projections, the Fed's published forecasts for rates, growth and inflation. On 12 November CoinDesk reported CME FedWatch, a tool that turns futures prices into odds for the Fed's next move, pricing about a 90% chance of a hike. The same article gave the mood readings of the day: a positive put skew of about 11% on one-week bitcoin options, which means puts cost more than calls, one-week implied volatility (the price swings that options imply) of about 35% after 38% on Tuesday, a fear and greed index of 26 (a sentiment score where lower means more fear) and bitcoin near 73,400 USD, down 0.7% since midnight UTC.
None of the sources states that ETF flows follow the rate outlook. CoinDesk places them in one report without connecting them. Our working hypothesis for this article is that the sessions where the decision and the expectation can differ are the ones to compare with the run-up.
| Date | What happens | What to record |
|---|---|---|
| Until 7 December | Daily flows, FedWatch reading | All-funds net flow, IBIT, count of net-inflow sessions in a row |
| 8 December | First day of the Fed meeting | That session's flows |
| 9 December | Second day of the Fed meeting | That session's flows |
| 10 December | First full session after the meeting | Flows against the average of the week before the meeting |
BTCUSD Forecast: What the Price Chart Shows
The RoboForex weekly forecast of 9 November reads the daily BTCUSD chart as a decline from the September high near 87,400 USD: a sequence of lower highs and a break out of the earlier rising channel keep sellers in control, and the latest rebound ended in a new decline.
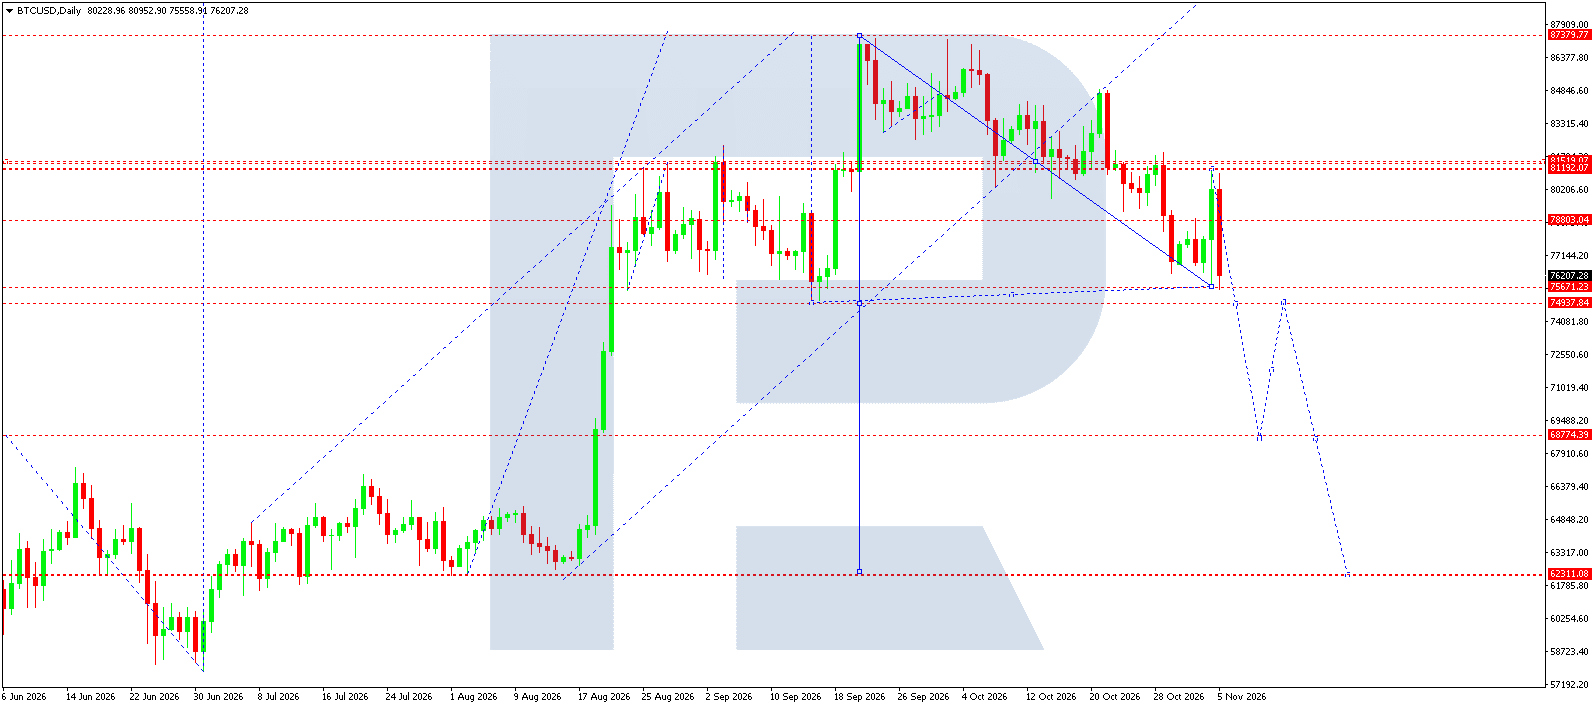
The levels marked on the chart:
| Level | BTCUSD | What it means |
|---|---|---|
| Support area | 75,671 to 74,938 | Consolidation below 74,938 confirms the next leg down |
| First target | 68,774 | Local target of that leg, with a possible return towards 75,000 after it |
| Next target | 62,311 | Later target that could take more than one week to reach |
| Resistance | 78,803 | A return above it weakens the bearish scenario |
| Review level | 81,102 | Consolidation above it calls for a review of the bearish outlook |
The path played out faster than one week. On 12 November CoinDesk put bitcoin near 73,400 USD, below 74,938, and on the morning of 13 November CoinGecko showed about 68,000 USD, at the first target of 68,774. By the chart, a rebound towards 75,000 can come after that target, and 62,311 is the next target of the decline. A return above 78,803 weakens that path. The flow signals add a check of their own: three net-inflow sessions in a row while the price holds above 78,803 would point against the bearish path. The forecast covers the week of 9 to 13 November, so compare these levels with the latest crypto outlook in Market Analysis before using them.
Three Scenarios and What Cancels Them
Scenario 1. Outflows run into the meeting
If all-funds flows stay negative on most sessions and FedWatch stays near 90%, then flows and FedWatch can be read side by side and the 8-9 December outcome is the next test. Three net-inflow sessions in a row cancel it.
Scenario 2. Flows turn first
If three net-inflow sessions in a row appear before 8 December, then the outflow scenario is cancelled whatever FedWatch shows. Bitfinex's caution applies: slowing outflows alone do not establish a recovery.
Scenario 3. The outcome differs
If the decision differs from the last FedWatch reading before the meeting, then compare flows on 9 and 10 December with the week before. A move in FedWatch before the meeting resets the comparison.
Each scenario links one observable to one rule. The price levels for BTCUSD come from the forecast chart in the previous section.
How to Follow Bitcoin ETF Flows Day by Day
- Choose one data provider, Farside Investors or SoSoValue, the two behind the figures above, and keep to it. Do not mix two providers in one tally.
- Each evening write down the all-funds net flow and the IBIT figure with the date.
- Count net-inflow sessions in a row for all funds and reset the count at the first outflow day.
- Add 8 and 9 December to the economic calendar so the meeting sessions are already marked when they arrive.
Conclusion
Before the Fed meeting the flow picture has a measurable shape: a run of five all-fund outflow sessions, one fund carrying around 90% of a day's outflow and a rate hike priced at about 90% on 12 November. Record daily flows until 8 December, count net-inflow sessions in a row, and compare the flows of 9 and 10 December with the week before.
FAQ
What does Bitcoin ETF outflow mean?
A net outflow means that on a given day more money left a spot bitcoin ETF through redeemed shares than entered through new shares. On 11 November 2026 all US spot bitcoin ETFs together recorded about 299.9 million USD of net outflows, according to SoSoValue data in CoinDesk.
How to check Bitcoin ETF flows?
Daily flow tables by fund come from data providers such as Farside Investors and SoSoValue, the two behind the figures in this article. Choose one provider, note the all-funds net flow and the IBIT figure each day and keep two providers out of one tally.
When is the next Fed meeting?
The Federal Reserve's 2026 calendar lists the December meeting on 8 and 9 December, with a Summary of Economic Projections. It is the last meeting on that calendar.
Do Bitcoin ETF flows predict the bitcoin price?
No source used in this article shows that flows predict the price. CoinDesk and Cointelegraph report flows next to the bitcoin price, the Fed outlook and readings such as weak spot demand and liquidations of leveraged long positions, without stating that one drives another. This article gives no price forecast.
- What Is an Economic Calendar and Why Every Trader Should Use It: how to track the Fed meeting and other dates that move markets.
- CPI in Forex Trading: What It Is and How It Moves Prices: the inflation data that feeds rate expectations.
Any forecasts contained herein are based on the author's independent analysis and reflect their personal opinion. These articles should not be construed as trading recommendations or a call to action. The authors and RoboForex accept no responsibility for the results of any trades made on the basis of these recommendations and reviews. Past performance is not indicative of future results. Trading cryptocurrencies, stocks and CFDs involves a high risk of capital loss.