Bank Deposit or Stocks? A 10-Year Test With JPMorgan Chase

When money is free to spend, it is also free to put to work. One of the most conservative options is a bank deposit that pays interest. The alternative is putting the same money into stocks on a schedule and letting price growth and dividends do the work instead. Comparing deposit vs stocks over a real ten-year stretch, using JPMorgan Chase for both sides of the comparison, shows exactly how far apart the two outcomes can get.
Both bank and the stock are the same company: a JPMorgan Chase savings deposit on one side, JPMorgan Chase & Co. (NYSE: JPM) shares on the other. Same JPMorgan Chase, same 100 USD every month, same ten years. The only thing that changes is what the money buys.
In Brief
- 100 USD a month, 10 years, same bank on both sides: a JPMorgan Chase deposit against JPMorgan Chase stock.
- The deposit's rate never rose above 1.41% a year over the whole decade.
- The stock portfolio pulled ahead within the first year and never gave the lead back, not even through two double-digit drops.
- Ten years of interest added 538 USD to the deposit.
- Ten years of dividends added 2,322 USD, all reinvested into more JPM shares.
- The final portfolio, 37,238 USD, is very nearly three times the deposit's final balance.
The Same Bank, Two Very Different Bets
Free money can always be spent. It can also be set aside, and what happens next depends entirely on where it goes. This test follows two versions of the same decision, both starting on 1 September 2016 and both ending on 1 September 2026, ten years and 120 monthly contributions of 100 USD apart.
The saver sends every 100 USD to a JPMorgan Chase deposit and lets the interest reinvest itself, month after month. The investor spends the same 100 USD on fractional shares of JPMorgan Chase & Co. (NYSE: JPM) and reinvests every dividend into more shares, a discipline known as dollar-cost averaging: buying on the same schedule every month, whatever the price happens to be doing that month.
By the end of the decade, both have put in exactly the same amount from their own pocket: 12,000 USD. Taxes, banking and brokerage fees, and inflation are left out on both sides, so what follows is the gap between the two strategies under identical conditions, not a net figure either of them would actually keep after costs.
JPM Trades on MT5 at RoboForex
Open the platform and see the current JPMorgan Chase & Co. price for yourself.
What JPMorgan’s Savings Rate Actually Paid, Year by Year
The deposit's fate was decided almost entirely by one number: JPMorgan Chase's own average Savings rate for its US accounts. For most of the decade, that number was close to nothing.
In 2016 the rate was 0.09% a year. It crept up to 0.15% in 2017 and 0.32% in 2018, reached 0.46% in 2019, then fell back to 0.13% in 2020 and 0.06% in 2021 as US interest rates dropped. A new hiking cycle then lifted it: 0.28% in 2022, 1.10% in 2023, 1.39% in 2024, 1.41% in 2025, and around 1.27% through the first half of 2026.
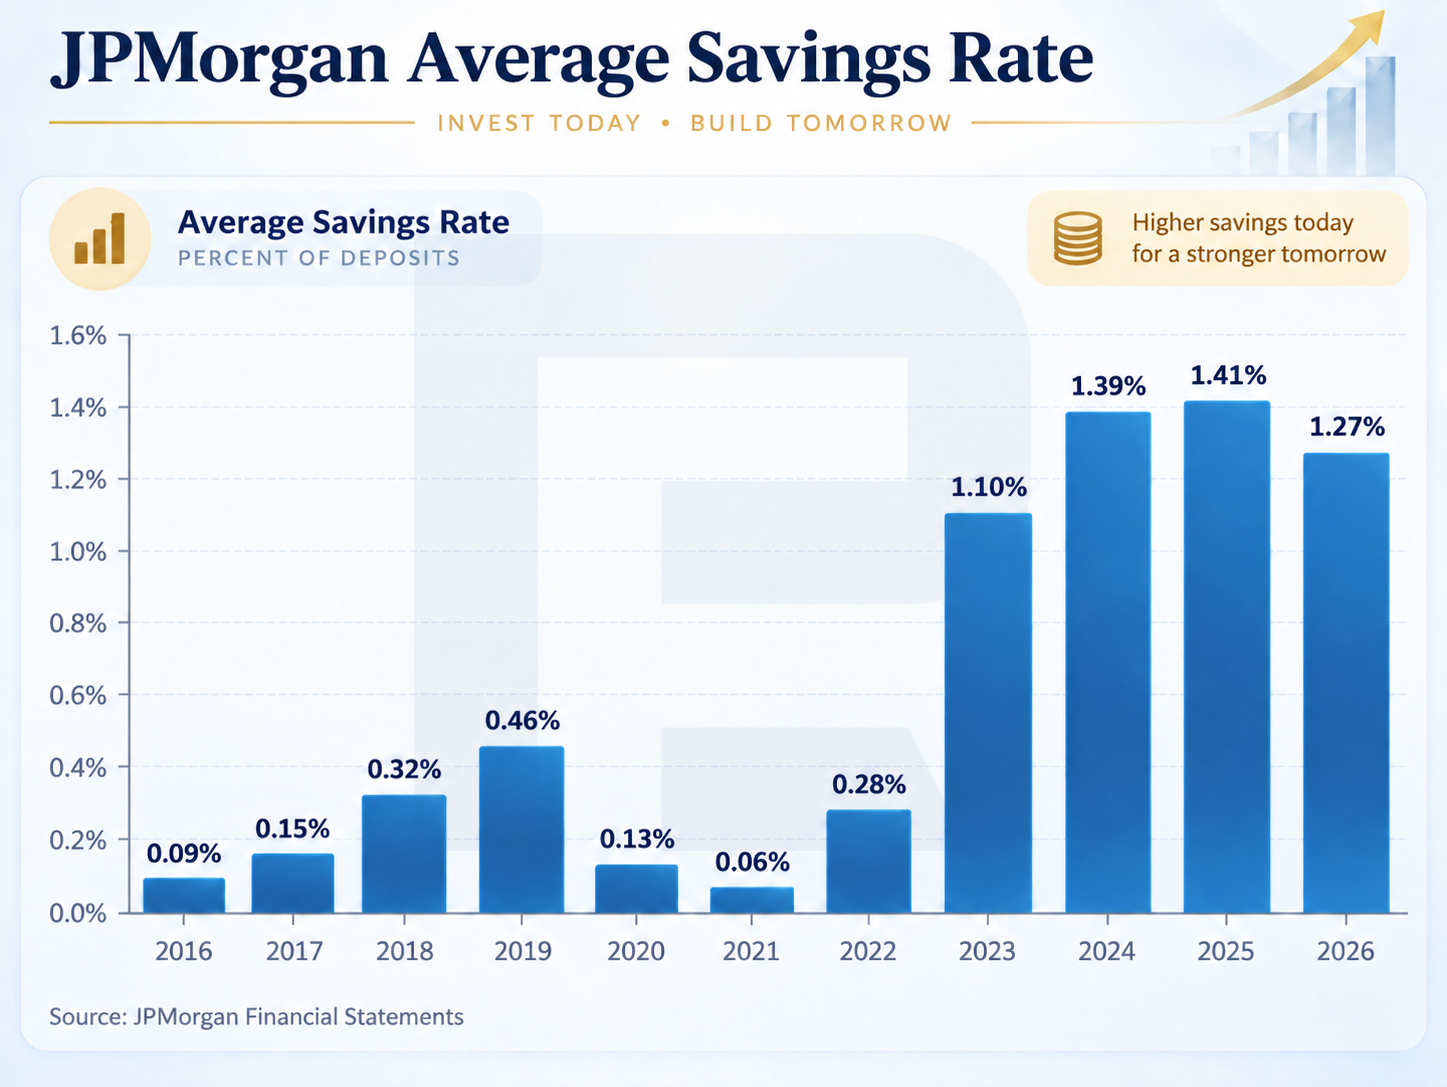
Even with every cent of interest reinvested, a rate that spent most of a decade under 1% had very little to work with. The deposit was never going to be the side of this test that surprised anyone.
The First 100 USD: 1.49 Shares of JPMorgan
On 1 September 2016, JPM shares closed at 67.21 USD. The investor's first 100 USD bought about 1.49 shares.
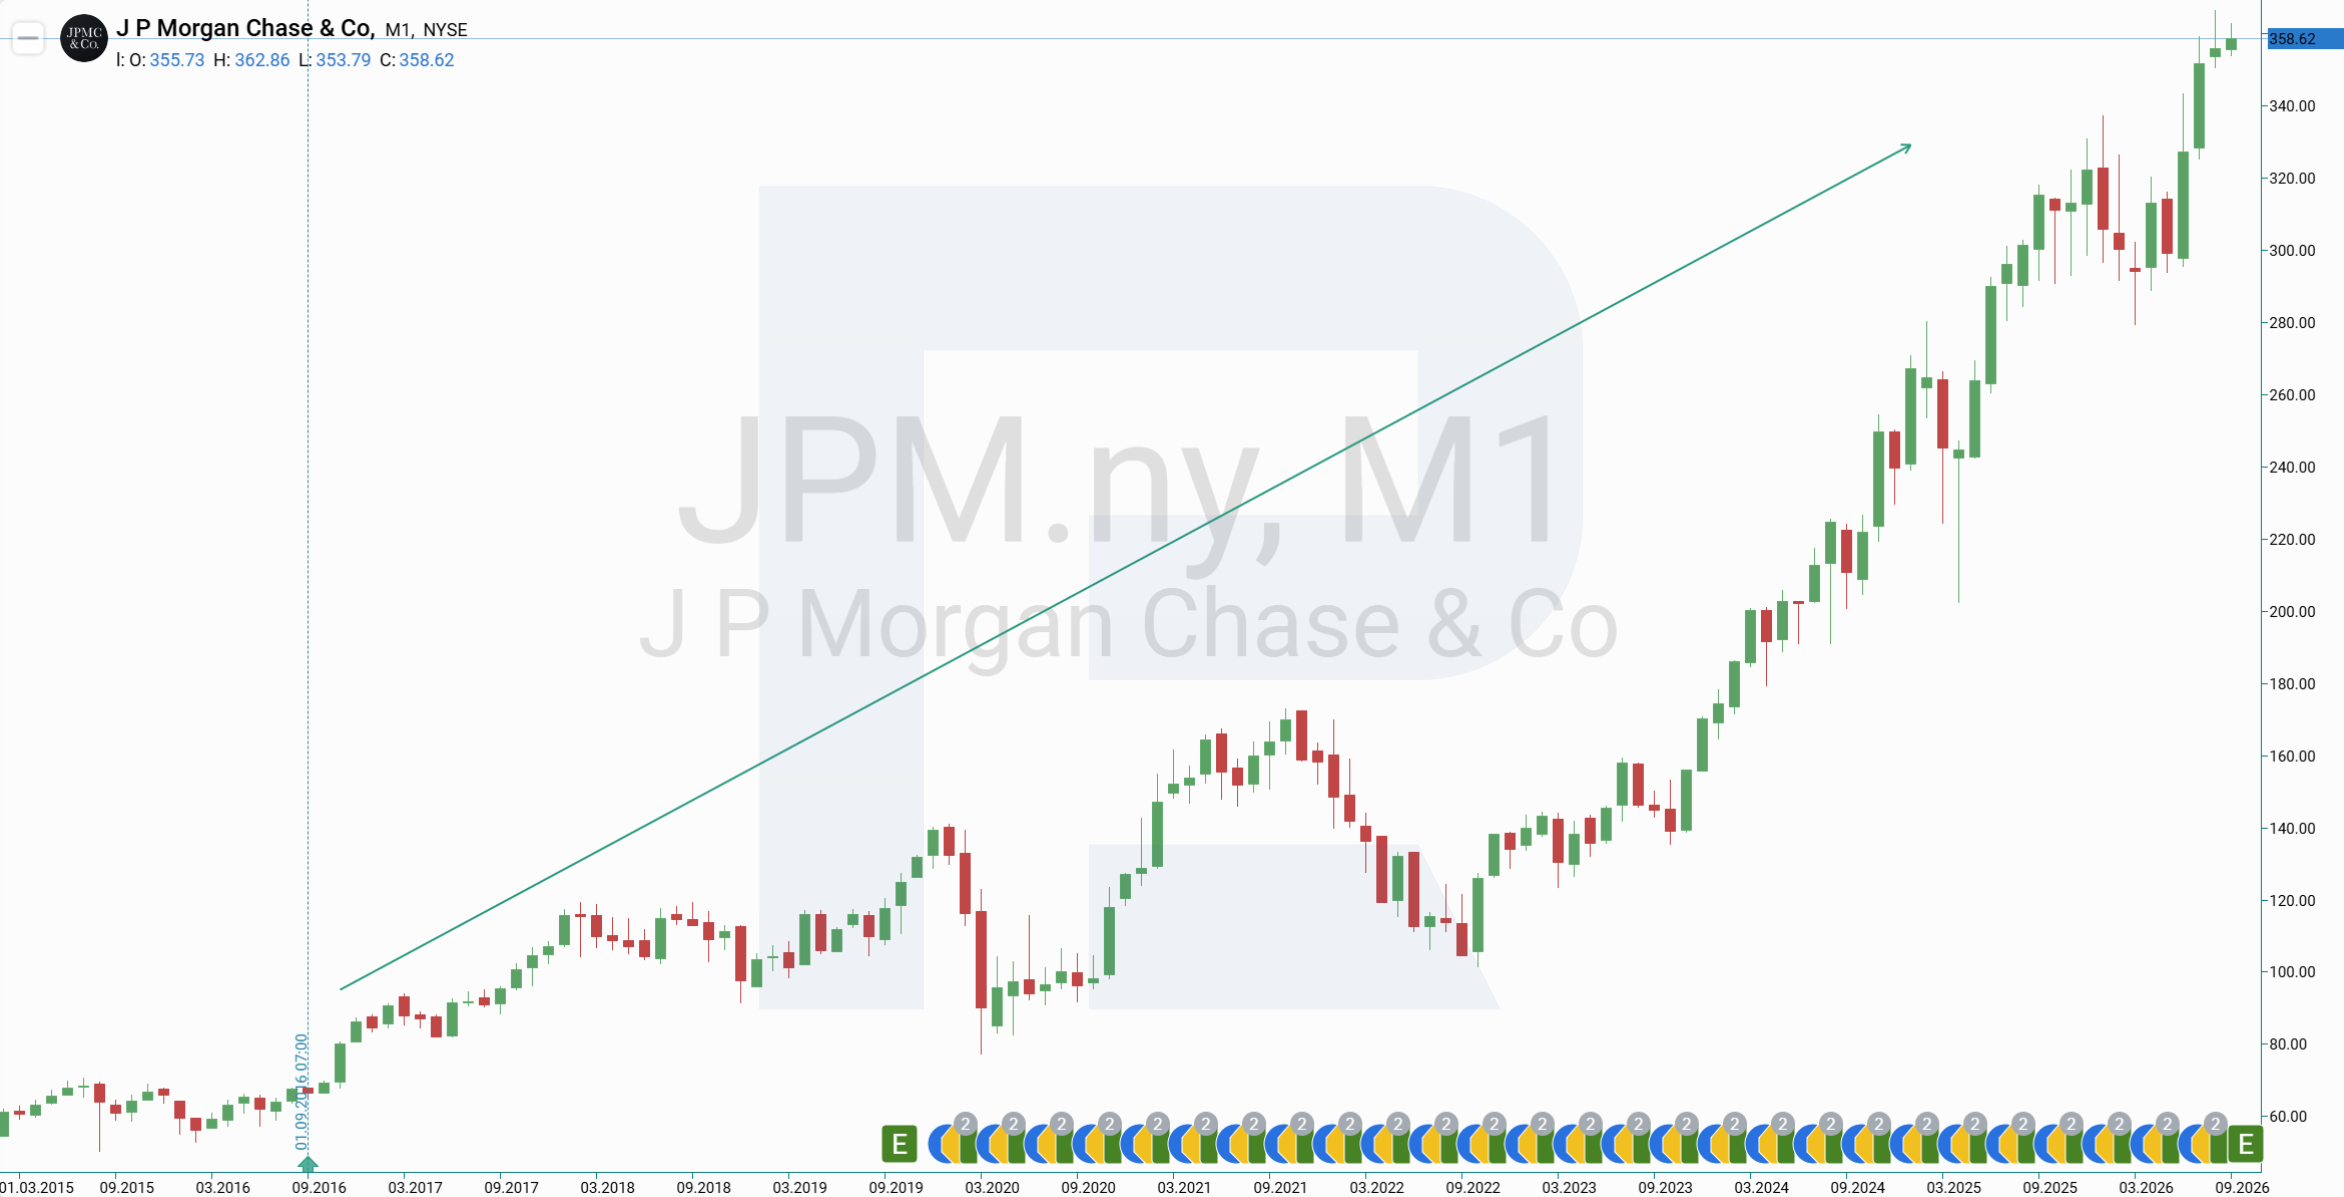
From there, the same 100 USD goes to JPM every month, whether that month's price is up or down. That single rule is what turns a falling market from a threat into an opportunity: a lower price buys more shares with the same 100 USD, and every one of those shares later collects its own dividend.
JPMorgan paid 0.48 USD per share each quarter in October 2016. The bank raised that payout repeatedly over the decade, to 1 USD per share by 2022 and 1.50 USD per share by mid-2026. Every dividend goes straight back into more JPM shares, and those new shares start earning dividends of their own.
One Year Later, the Investor Is Already Ahead
By the end of August 2017, each side had received 1,200 USD.
The deposit, interest included, held 1,201 USD. The stock portfolio held 14.6 JPM shares worth 1,324 USD.
One year in, with the same money and the same starting point, the investor was already 123 USD ahead. The gap was only going to widen from here, through two of the sharpest drops JPM saw in the whole decade.
The 2020 Test: the Lead Survives a 30% Drop
JPM traded above 130 USD in early 2020. By the end of March, in the pandemic crash, it had fallen to 90 USD, a drop of roughly 30%.
For a portfolio built up over four years, that kind of drop was not trivial. By August 2020 the investor had contributed 4,800 USD, owned 50.7 JPM shares, and the portfolio was worth 5,082 USD. The deposit, over the same four years, held 4,829 USD.
Even after one of the sharpest drops in JPM's history, the stock portfolio was still ahead of the deposit. The crash also did something for the portfolio a calm market never could: at 130 USD, the monthly 100 USD bought 0.8 of a share; at 90 USD, it bought 1.1 shares. Every month the price stayed down, the investor quietly picked up shares faster.
The 2022 Test: a Second Correction, the Same Result
Two years later, JPM dropped again, this time by 34%, from 158 USD in December 2021 to 104 USD by September 2022.
By the end of year six, the deposit held 7,247 USD on 7,200 USD contributed. The investor's 71.9 shares, priced at the lower level, were worth 8,181 USD.
The pattern repeats. A second sharp correction, and the portfolio's lead over the deposit does not shrink, it grows: from 123 USD after year one to 934 USD after year six.
Ten Years Later: the Final Numbers
After the last monthly contribution in August 2026, both sides had received exactly the same 12,000 USD from their own pocket. What each side turned that into is where the story lands.
The deposit ends at 12,538 USD. Ten years of interest, most of it earned at a rate under 1%, added 538 USD.
The stock portfolio ends at 37,238 USD: 104.6 JPM shares, worth 356 USD each on 1 September 2026, built from 12,000 USD of contributions and 2,322 USD of reinvested dividends.
| Metric | Bank Deposit | JPM Shares |
|---|---|---|
| Own contributions | 12,000 USD | 12,000 USD |
| Final value | 12,538 USD | 37,238 USD |
| Gain above own contributions | 538 USD | 25,238 USD |
| Dividends paid | — | ≈2,322 USD |
| Number of shares | — | ≈104.6 JPM |
Two different numbers describe that gap, and it is worth keeping them apart. The portfolio's 37,238 USD sits 24,700 USD above the deposit's 12,538 USD: that is what one strategy beat the other by. Measured against the 12,000 USD both sides actually put in, the portfolio's gain is 25,238 USD, against a 538 USD gain for the deposit. Same ten years, same money, two ways of stating a result that was never close.
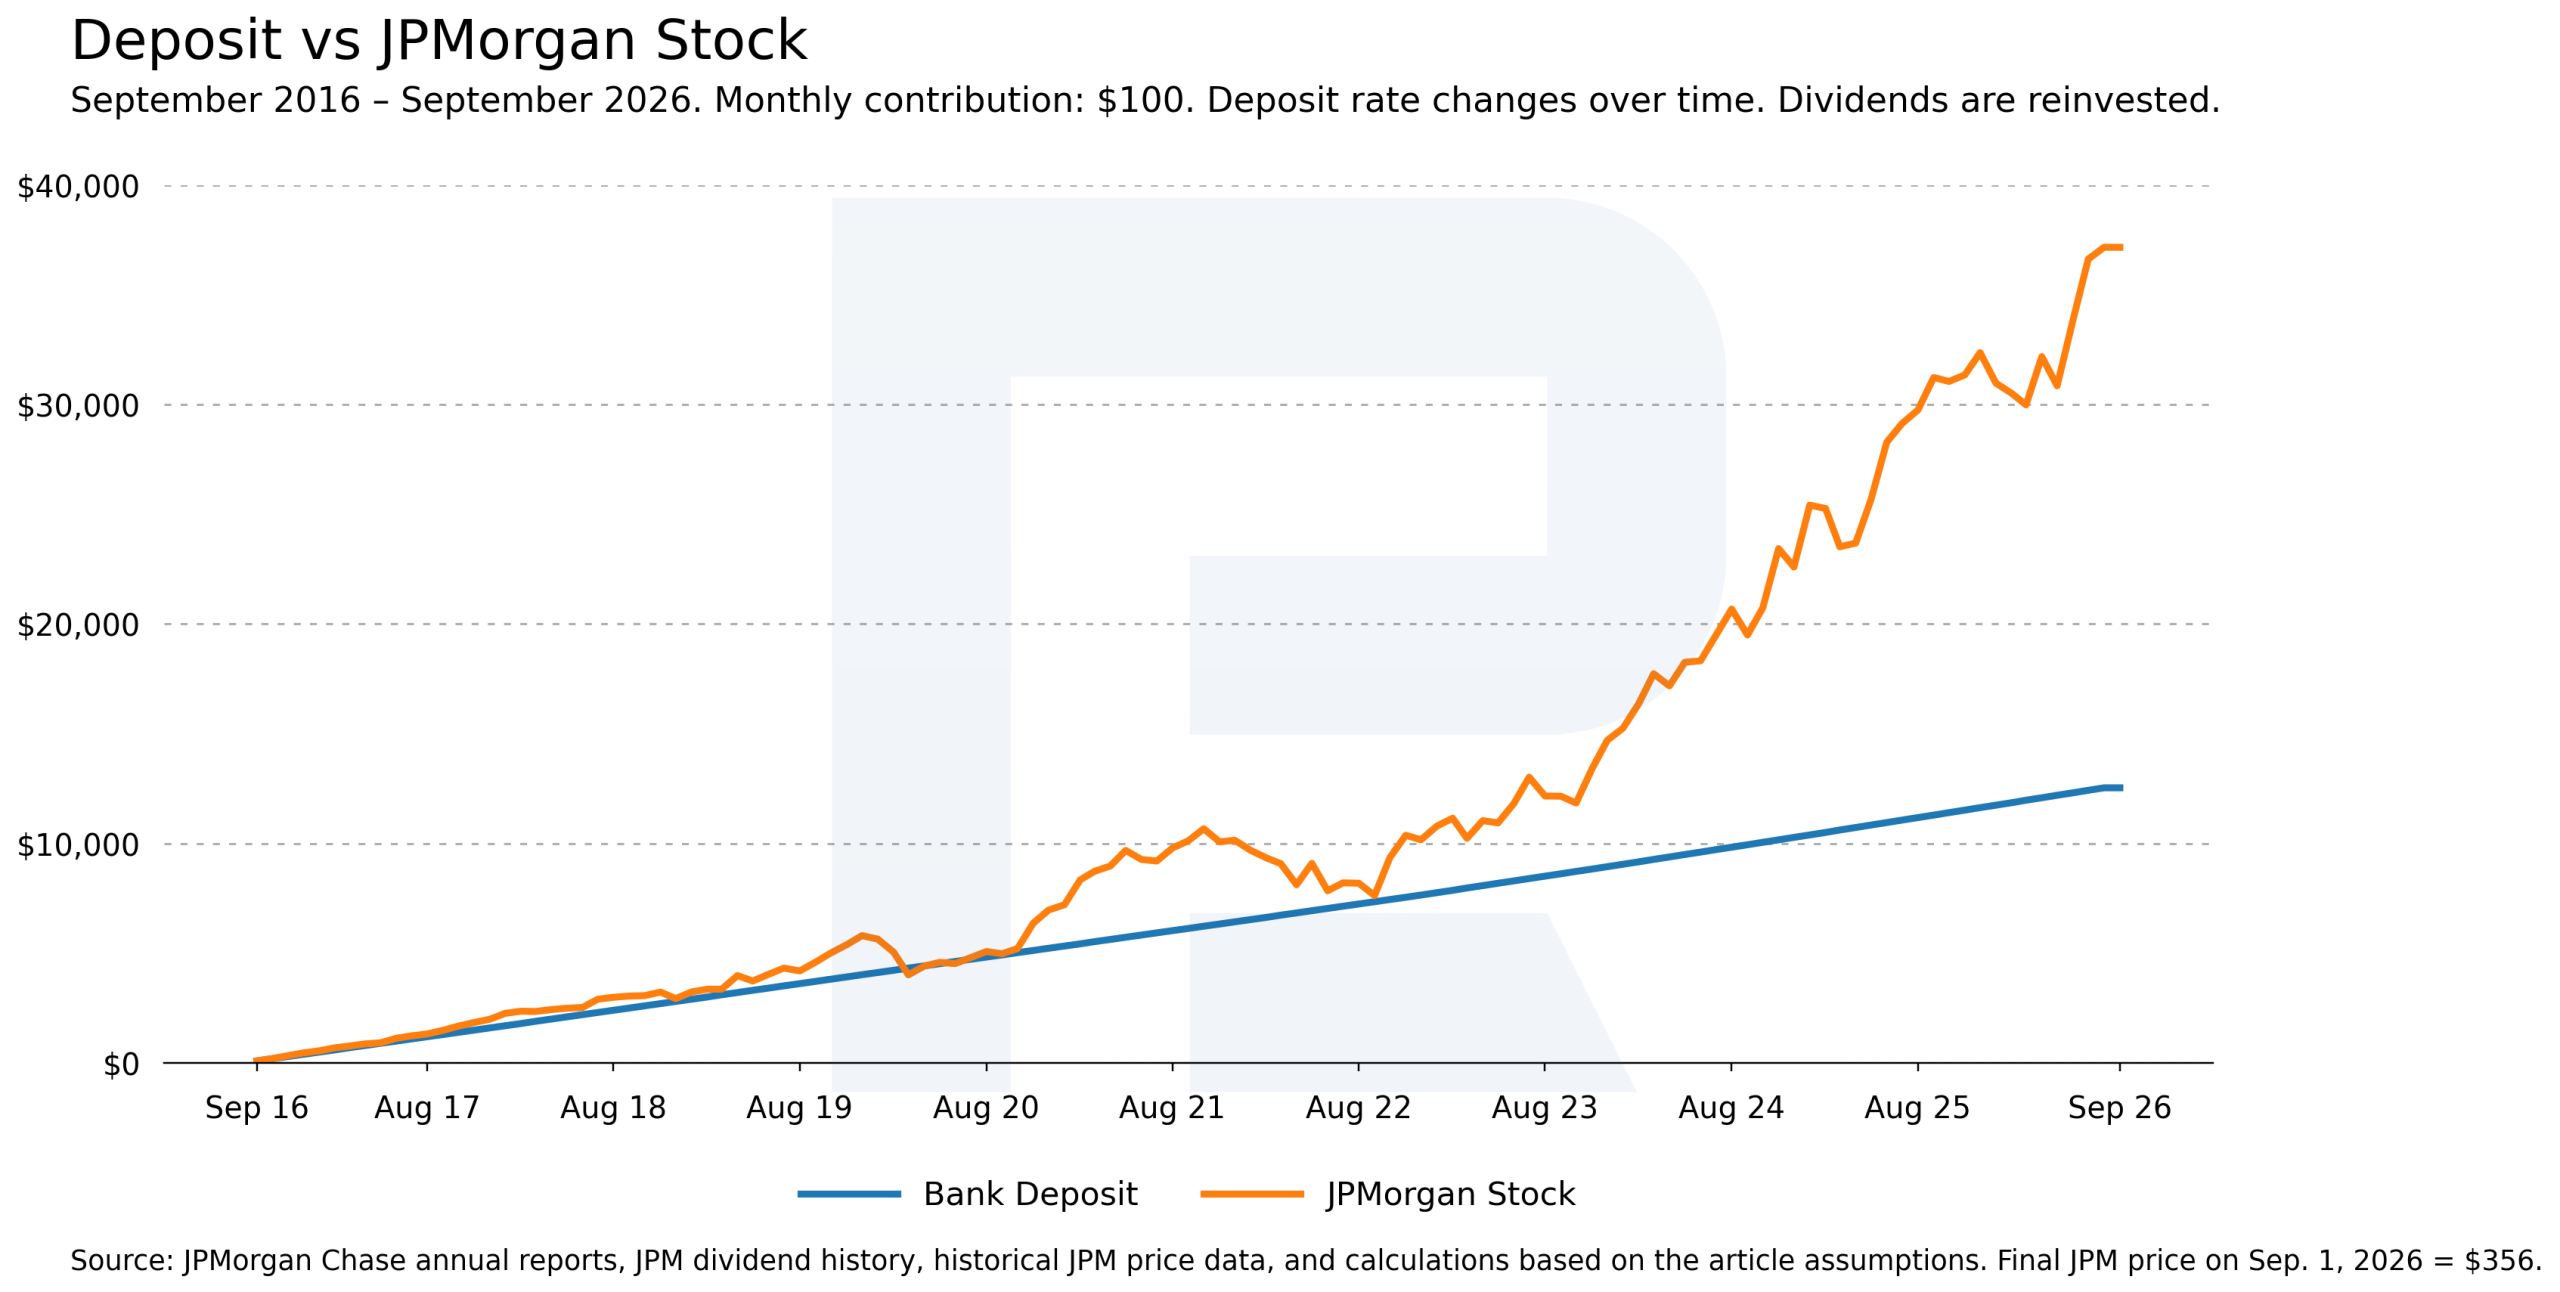
The calculation is based on actual JPM stock prices, not adjusted for dividends, which are tracked and reinvested separately in the numbers above. Where 1 September fell on a weekend or a stock market holiday, the opening price of the next trading day was used instead.
Deposit or Stocks: the Verdict
Running the same test with JPMorgan on both sides removes the one excuse a comparison like this usually gets: that the winning side had a better company or a luckier bank behind it. It did not. Both sides were JPMorgan Chase, the whole way through.
What separated a 538 USD gain from a 25,238 USD gain was not the company. It was two crashes the deposit never had to survive, and that the stock portfolio survived twice, coming out with a bigger lead each time. Regular monthly purchases kept buying shares through both drops, and every reinvested dividend kept adding to the share count in between. The deposit mostly preserved the money placed into it. The stock let that same money grow with JPMorgan's business, drops included.
None of this makes stocks a substitute for a deposit's certainty. JPMorgan's result over this particular ten years is one outcome for one company, not a guarantee for any stock, JPMorgan included, over the next ten. What it does show is the size of what a decade in cash-equivalent instruments can cost, measured against a decade of staying invested through the falls as well as the rallies.
Testing the same discipline starts with seeing where JPM is trading right now. It trades on MT5 at RoboForex alongside a wide range of other stocks, and a demo account is a way to run the numbers before any real money moves. One difference from the example above is worth knowing going in: JPM on MT5 trades as a CFD, through margin and leverage, not as a literal fractional share certificate, so it does not automatically repeat the exact share-count and dividend mechanics used in this calculation.
FAQ
Why compare a deposit and a stock from the same bank?
Using JPMorgan Chase on both sides removes one variable: which company or bank to trust. The comparison then isolates the difference between the deposit product and the stock as two ways of putting the same money to work.
Does this mean stocks always beat a deposit?
No. This example covers one company over one specific ten-year window. Stocks carry more risk than a deposit and can underperform one over other periods or other instruments. The result here shows what happened with JPMorgan specifically from September 2016 to September 2026, not a rule that holds for every stock or every decade.
What is dollar-cost averaging?
Investing a fixed amount on a fixed schedule, such as 100 USD every month, regardless of whether the price is higher or lower than last month. It means buying more shares when the price drops and fewer when it rises, without trying to time the market.
Why did the portfolio stay ahead even during the 2020 and 2022 drops?
Years of prior contributions had already built up a share count, so a price drop reduced the portfolio's value without erasing the gap it had built. The monthly purchases that continued through both drops also bought shares at lower prices, which helped the portfolio widen its lead once prices turned back up.
Can I trade JPMorgan Chase & Co. stock at RoboForex?
Yes, JPM is available on MT5 at RoboForex. Trading it there works as a CFD, through margin and leverage, which differs from literally owning fractional shares and collecting cash dividends the way this article's example does.
Any information provided in articles on this website is based solely on the personal opinions of the authors. These articles should not be construed as trading recommendations or a call to action. The authors and RoboForex accept no responsibility for the results of any trades made on the basis of these recommendations and reviews. Past performance is not indicative of future results. Trading stocks and CFDs involves a high risk of capital loss.