
EURUSD under pressure: between the Fed minutes and Hormuz
The EURUSD pair fell to 1.1412. No one likes Middle East risk. Find out more in our analysis for 8 July 2026.
EURUSD forecast: key takeaways
- The EURUSD pair is reacting to worsening news
- The worsening situation in the Strait of Hormuz means a broader move away from risk
- EURUSD forecast for 8 July 2026: 1.1399 or 1.1473
Fundamental analysis
The EURUSD rate fell to 1.1412 in the middle of the week, with stronger demand for safe-haven assets supporting the US currency following fresh US air strikes on Iranian facilities. The escalation followed recent attacks on ships passing through the Strait of Hormuz.
The deterioration in the situation has put the interim peace agreement between the US and Iran at risk. At the same time, oil prices moved upwards again, fuelling fears of a new surge in inflation. This forced market participants to revise their interest rate expectations: the likelihood of a Federal Reserve rate hike in September rose to about 50% from 46% a day earlier.
The release of the minutes of the June Fed meeting remains in focus today. The market expects to receive additional signals about the future path of monetary policy after the US regulator took a more hawkish stance in June.
US external trade data also became an additional factor for the dollar. The trade deficit widened to 77.6 billion USD in May, the highest level since March 2025.
The EURUSD forecast is mixed.
Technical outlook
On the H4 chart, the EURUSD pair continues to trade within a range after the corrective rise ended. After failing to consolidate above the 1.1473 resistance level, quotes gradually pulled back to the 1.1410–1.1420 area, where the 50-period moving average is located. Bollinger Bands are starting to narrow, indicating lower volatility and the anticipation of a new impulse.
The technical picture remains neutral. The nearest support level lies in the 1.1399–1.1410 area, with a stronger one at 1.1323. The resistance level remains at 1.1473, where sellers have repeatedly become more active. As long as the EURUSD rate holds above 1.1400, buyers retain a chance of retesting the upper boundary of the range, but consolidation below this mark will increase the risk of a deeper correction.
Indicators are giving mixed signals. MACD remains near the zero mark, reflecting the absence of a clear trend, while the histogram is gradually shrinking. The Stochastic Oscillator is near oversold territory and is starting to turn upwards, suggesting an attempt at a short-term recovery. The baseline scenario remains consolidation in the 1.1399–1.1473 range until new fundamental drivers emerge, with the main one being the publication of the minutes of the June Federal Reserve meeting.
EURUSD overview
- Asset: EURUSD
- Timeframe: H4 (Intraday)
- Trend: sideways (within a correction)
- Key resistance levels: 1.1473 and 1.1565
- Key support levels: 1.1399 and 1.1323
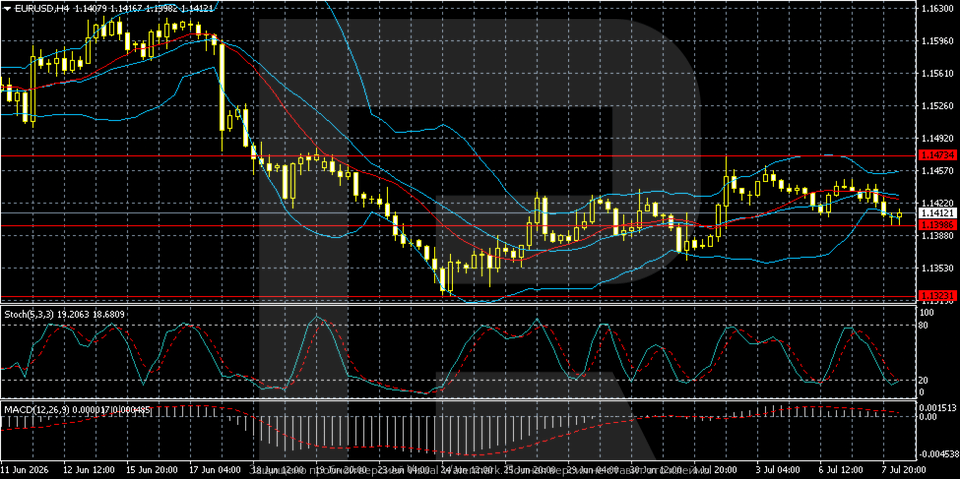
EURUSD trading scenarios for today
Main scenario (Sell Stop)
A breakout and consolidation below the 1.1399 support level would signal the completion of the current correction and increase pressure on the EURUSD rate amid growing demand for the dollar as a safe-haven asset.
- Take Profit: 1.1323
- Stop Loss: 1.1435
Alternative scenario (Buy Stop)
Consolidation above the 1.1473 resistance level would confirm a renewed upward correction and create conditions for a move towards the next resistance level at 1.1565.
- Take Profit: 1.1565
- Stop Loss: 1.1450
Risk factors
The main risk to the EURUSD downside scenario remains softer Federal Reserve rhetoric in the published minutes of the June meeting or easing geopolitical tensions in the Middle East. In this case, pressure on the dollar may increase. A confident consolidation above 1.1473 will signal a continued euro recovery.
Summary
The EURUSD pair is falling again amid worsening market conditions. The EURUSD forecast for today, 8 July 2026, suggests that the 1.1399–1.1473 consolidation range remains in place.
Editors’ picks
 EURUSD forecast 2026–2027: technical analysis, price levels & predictions
The ECB holds rates at 2.15% while the Fed stays at 3.75% — and that divergence is the central driver of EURUSD in 2026. The pair is range-bound between 1.1400 and 1.1915, with Deutsche Bank targeting 1.2500 and Morgan Stanley calling for 1.3000 by year-end. We analyse the technicals, break down the macro factors, and outline three trading scenarios with specific entry levels.
 Gold (XAUUSD) forecast 2026: predictions based on fundamental and technical analysis
Where is gold headed after pulling back from the all-time high of 5,597 USD? XAUUSD is consolidating near 4,518 USD between key levels 4,220 USD and 4,855 USD, with major banks targeting 5,243–6,200 USD by year-end. Read our comprehensive gold forecast: technical analysis across three timeframes, trading scenarios with specific entry levels, Fed policy and central bank demand outlook, and institutional predictions for 2026 and beyond.
Forecasts presented in this section only reflect the author’s private opinion and should not be considered as guidance for trading. RoboForex bears no responsibility for trading results based on trading recommendations described in these analytical reviews.