
EURUSD consolidates near local lows ahead of Fed Chairman’s speech
The EURUSD pair is extending its downward correction ahead of a key speech by the Federal Reserve chairman, with the price currently standing at 1.1644. Discover more in our analysis for 28 August 2026.
EURUSD forecast: key takeaways
- Market participants have adopted a wait-and-see stance ahead of Federal Reserve Chairman Kevin Warsh’s speech at Jackson Hole
- Market consensus expects a hawkish stance from the new head of the US regulator
- EURUSD forecast for 28 August 2026: 1.1745
Fundamental analysis
The EURUSD rate has continued to correct for seven consecutive trading sessions. The 1.1685 mark remains a strong resistance level that buyers were unable to overcome during the bullish momentum.
Investors are currently awaiting Federal Reserve Chairman Kevin Warsh’s speech at the Jackson Hole Symposium, seeking new signals on the future path of US interest rates. Market consensus is that the Fed chairman will adopt a hawkish stance, creating risks of a further short-term correction in the euro. Nevertheless, any further declines are likely to attract active buying support.
The fundamental backdrop remains tense. Yesterday, Federal Reserve officials openly expressed concern about inflation dynamics in the US. These concerns were triggered by fresh macroeconomic data: the Personal Consumption Expenditures price index, a key indicator for the regulator, accelerated to 3.7% year-on-year.
Despite the continuing risks of short-term consolidation, the euro’s underlying fundamentals remain solid. The pair is finding reliable support from persistent investor concerns about the risks of a US debt crisis, as well as systematic weakness in the US dollar due to the Treasury’s expanded bond buyback program.
Technical outlook
The EURUSD rate continues to develop a downward correction but remains within the medium-term bullish channel. Today’s EURUSD forecast suggests an attempt to resume growth towards 1.1745.
Technical indicators confirm continued bullish sentiment. The Stochastic Oscillator has reached the support line and is poised to turn upwards, indicating increased buying activity. An additional signal in favour of the bullish scenario would be consolidation above the 1.1665 resistance level, which would indicate a breakout above the upper boundary of the local correction channel and strengthen bullish momentum.
An alternative scenario would come into play if the price breaks the lower boundary of the ascending channel and consolidates below 1.1620. This signal would invalidate bullish expectations and indicate a deeper bearish correction.
EURUSD overview
- Asset: EURUSD
- Timeframe: H4 (intraday)
- Trend: bullish
- Key resistance levels: 1.1665 and 1.1685
- Key support levels: 1.1620 and 1.1585
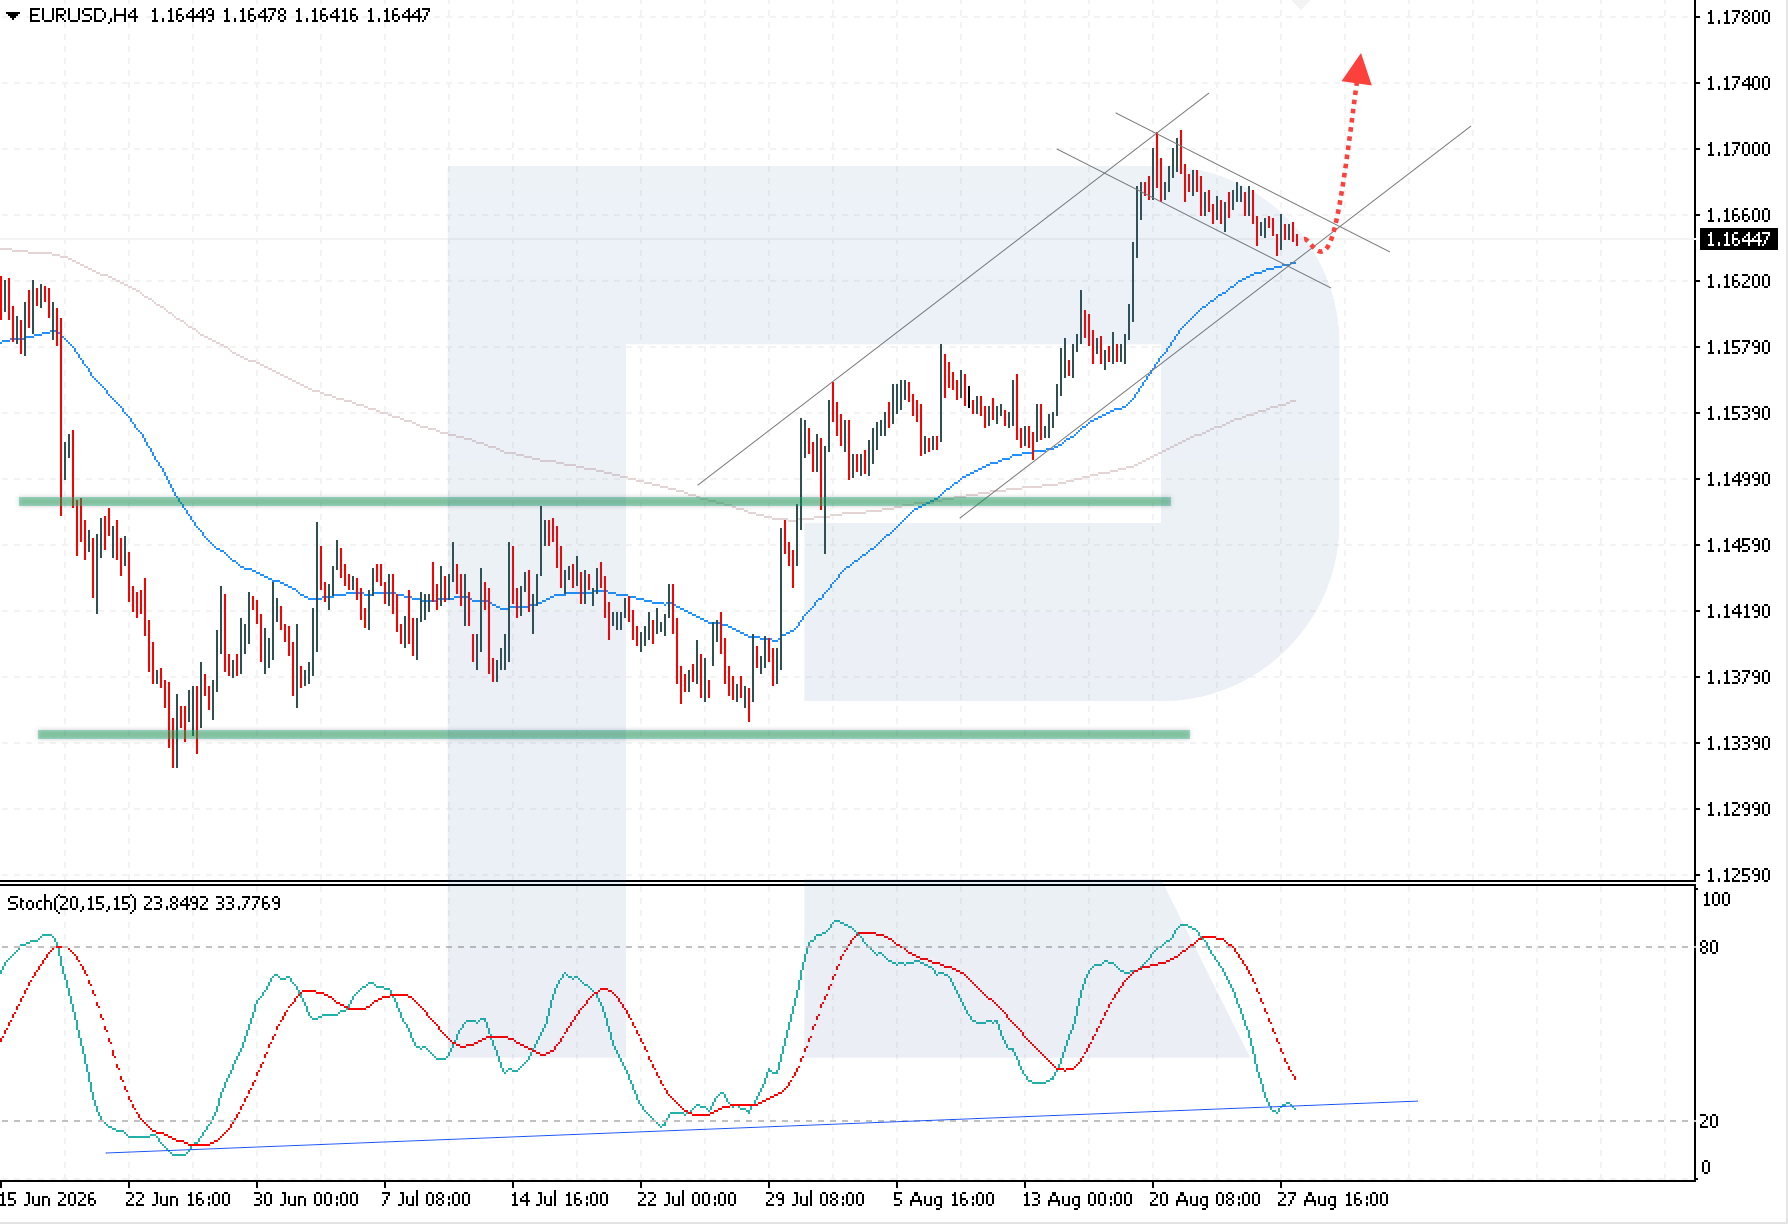
EURUSD trading scenarios for today
Main scenario (Buy Stop)
A breakout above the upper boundary of the descending correction channel, with the price consolidating above 1.1665, would create conditions for opening long positions and indicate the end of the EURUSD downward consolidation.
- Current price: 1.1644
- Entry price: 1.1665
- Stop loss: 1.1635
- Take profit: 1.1745
- Risk-to-reward ratio: more than 1:2
Alternative scenario (Sell Stop)
A breakout below the lower boundary of the medium-term channel, with the price consolidating below 1.1620, would indicate increased bearish pressure and a continued correction.
- Entry level: 1.1620
- Stop loss: 1.1645
- Take profit: 1.1535
- Risk-to-reward ratio: more than 1:3
The trade idea is valid until midnight on 29 August 2026 (server time, UTC+3).
Risk factors
The main risk to the bullish EURUSD scenario is hawkish rhetoric from Federal Reserve Chairman Kevin Warsh, which, amid accelerating inflation, could trigger a renewed strengthening of the US dollar. In this case, a breakout below the 1.1620 support level could lead to a deeper correction.
Summary
The EURUSD’s seven-day downward correction below the 1.1685 resistance level reflects the market’s natural caution ahead of potentially hawkish rhetoric from Kevin Warsh. Nevertheless, the risks of a US debt crisis and the Treasury’s bond buyback program provide solid fundamental support for the euro, which could prompt buying on any short-term dips.
Editors’ picks
 EURUSD forecast 2026–2027: technical analysis, price levels & predictions
EURUSD has recovered from the July lows and is trading near 1.1545 — back in bullish territory. The pair has reclaimed EMA65 on the daily, formed a bullish EMA crossover on H4, and the US-eurozone GDP gap has narrowed sharply (US 1.5% vs eurozone 1.0%). Goldman Sachs and Deutsche Bank both now target 1.2500 by year-end. A confirmed close above 1.1700 opens the path to 1.1805. We break down the key levels, three trading scenarios, and what the unprecedented 9-3 FOMC dissent vote means for EURUSD.
 Gold (XAUUSD) forecast 2026: technical analysis, price levels & predictions
Gold has reversed its downtrend and is trading near 4,360 USD, back above both EMA65 and EMA200. ETF flows turned positive in July with 3 billion USD of net inflows, and central banks bought 288.9 tonnes in Q2 — up 62% year-on-year. A breakout above 4,500 USD opens the path to 4,855 USD and the 5,597 USD all-time high. We break down the key levels, three trading scenarios with entry triggers, and what J.P. Morgan, Deutsche Bank and Goldman Sachs are forecasting for gold in 2026.
Forecasts presented in this section only reflect the author’s private opinion and should not be considered as guidance for trading. RoboForex bears no responsibility for trading results based on trading recommendations described in these analytical reviews.