
USDJPY maintains bullish momentum despite the threat of currency intervention
The USDJPY pair maintains its upward trajectory despite consolidation near the key resistance level at 162.50, as pressure on the Japanese yen remains. The rate currently stands at 162.38. Find out more in our analysis for 20 July 2026.
USDJPY forecast: key takeaways
- The Japanese yen remains under pressure amid a sharp rise in global oil prices
- The escalation of the conflict between the US and Iran has increased the risk of energy supply disruptions
- The Japanese authorities have not yet confirmed any interventions
- USDJPY forecast for 20 July 2026: 163.15
Fundamental analysis
The USDJPY rate is consolidating near the 162.50 resistance level, but buyers still have the upper hand. The Japanese yen remains weak amid a surge in global oil prices triggered by the escalation of geopolitical tensions in the Middle East.
The worsening conflict between the US and Iran has heightened concerns about potential supply disruptions, pushing global oil prices higher. For Japan, which is almost entirely dependent on energy imports, rising oil prices mean a deterioration in the trade balance and additional long-term pressure on the national currency.
Another negative factor for the yen was weak macroeconomic data. According to the latest figures, machinery orders in May fell more sharply than expected, indicating a decline in business investment activity. This trend limits the BoJ’s ability to tighten monetary policy further and maintains the dollar’s attractiveness against the yen.
At the same time, the Japanese currency trading near multi-year lows increases the likelihood of verbal or even direct currency interventions from Japan’s Ministry of Finance, which periodically limits further USDJPY strengthening. However, market participants have not yet received confirmation of active intervention by the authorities and are awaiting official currency intervention data later this month.
Technical outlook
The USDJPY rate is moderately rising after rebounding from the support level and remains within the ascending channel. Today’s USDJPY forecast suggests continued growth with a target at 163.15.
The technical picture remains favourable for buyers. The Stochastic Oscillator is approaching oversold territory and is testing the support line, indicating weaker selling pressure and conditions for a new upward momentum. A confident breakout above the 162.50 resistance level, followed by consolidation above this mark, would further confirm the bullish scenario.
At the same time, the risks of a downward correction remain. A breakout below the lower boundary of the ascending channel and consolidation below the 162.15 support level would signal easing buying pressure and cancel the current positive scenario. In this case, the USDJPY pair may move into a deeper correction with the potential for further decline.
USDJPY overview
- Asset: USDJPY
- Timeframe: M15 (Intraday)
- Trend: upward bias
- Key resistance levels: 162.50 and 162.60
- Key support levels: 162.20 and 162.05
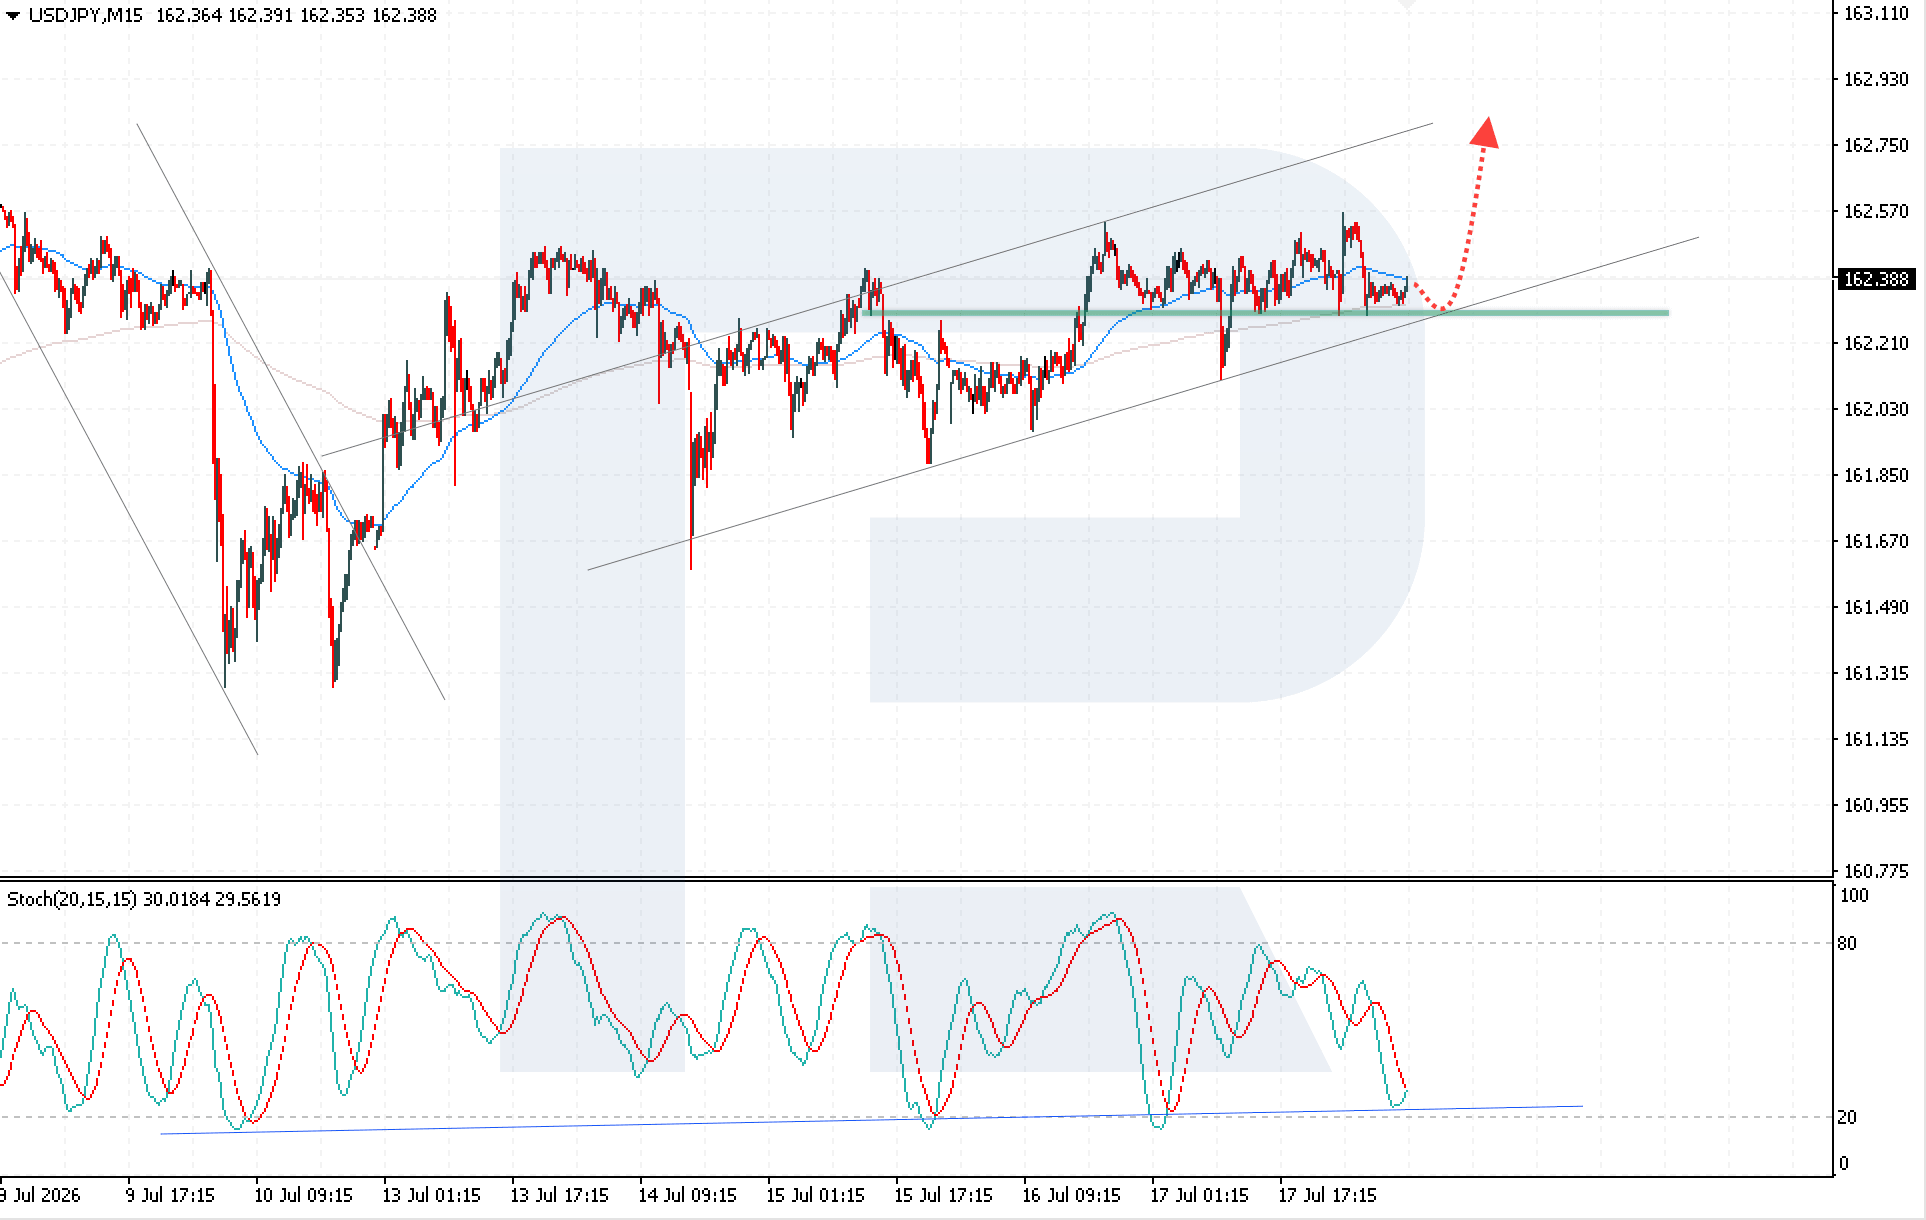
USDJPY trading scenarios for today
Main scenario (Buy Stop)
A breakout above the local resistance level at 162.50 would confirm growing bullish pressure and indicate continued upward momentum.
- Take Profit: 163.15
- Stop Loss: 162.20
Alternative scenario (Sell Stop)
Consolidation below the lower boundary of the bullish channel with a decline below 162.10 would indicate a downward correction with lower targets.
- Take Profit: 161.65
- Stop Loss: 162.35
Risk factors
The main risk to the scenario of further USDJPY growth remains a possible increase in expectations of currency intervention by the Japanese authorities, especially if the price reaches new multi-year highs and the yen weakens further. Additional pressure on the pair may come from a worsening geopolitical situation or lower oil prices, which may reduce the negative effect on the Japanese currency and trigger a deeper correction.
Summary
The USDJPY rate retains the potential for further gains thanks to sustained buying pressure and a favourable technical picture, but the approach to the key resistance level at 162.50 increases the risk of short-term profit-taking. Consolidation above this mark will open the way towards 163.15.
Editors’ picks
 EURUSD forecast 2026–2027: technical analysis, price levels & predictions
EURUSD has pulled back from the 2026 high of 1.1915 and is now trading near 1.1450 — below both EMA65 and EMA200 — with the active scenario shifting from bullish to bearish. The ECB raised rates to 2.40%, but the Fed holds at 3.75%, and US inflation (3.5%) continues to outpace the eurozone (2.8%). A confirmed break below 1.1280 opens the next downward wave toward 1.1080. We break down the key levels, three trading scenarios with entry triggers, and what Deutsche Bank, Morgan Stanley and UBS are forecasting for EURUSD in 2026.
 Gold (XAUUSD) forecast 2026: predictions based on fundamental and technical analysis
Gold has corrected over 25% from its all-time high of 5,597 USD and is now trading near 4,100 USD — testing a critical support zone. Is this the bottom, or will the downtrend continue? We break down the key levels (support 3,920 USD, breakout trigger 4,500 USD), three trading scenarios with entry levels, and what J.P. Morgan, Goldman Sachs and Deutsche Bank are forecasting for gold in 2026.
Forecasts presented in this section only reflect the author’s private opinion and should not be considered as guidance for trading. RoboForex bears no responsibility for trading results based on trading recommendations described in these analytical reviews.